
Optical Lens Edger Market Size and Share
Market Overview
| Study Period | 2022 - 2031 |
|---|---|
| Market Size (2026) | USD 653.65 Million |
| Market Size (2031) | USD 836.28 Million |
| Growth Rate (2026 - 2031) | 5.05 % |
| Fastest Growing Market | Asia Pacific |
| Largest Market | North America |
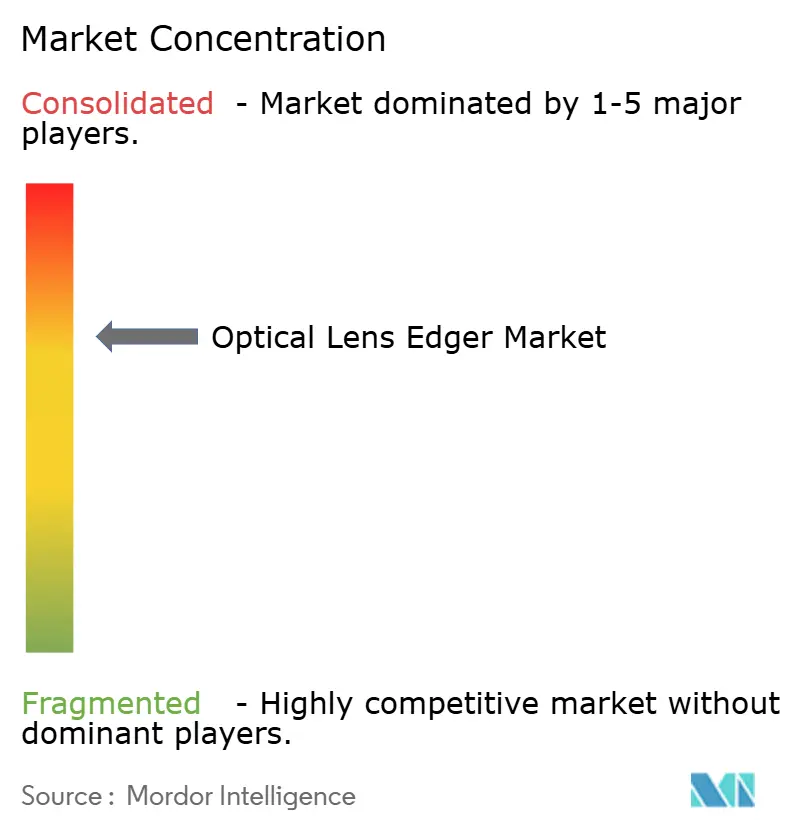
| Market Concentration | Medium |
Major Players *Disclaimer: Major Players sorted in no particular order Image © Mordor Intelligence. Reuse requires attribution under CC BY 4.0. | |
Optical Lens Edger Market Analysis by Mordor Intelligence
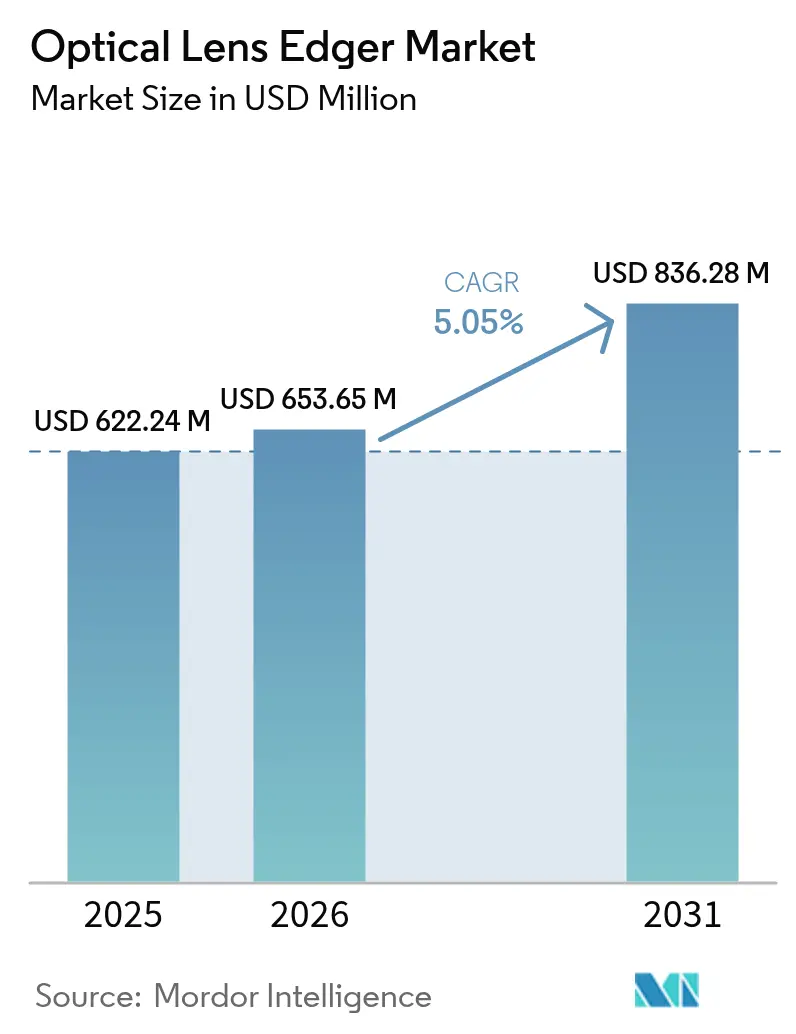
The optical lens edger market size is expected to grow from USD 622.24 million in 2025 to USD 653.65 million in 2026 and is forecast to reach USD 836.28 million by 2031 at 5.05% CAGR over 2026-2031. The current growth pattern reflects the powerful mix of rising myopia prevalence, a larger presbyopic population, and the widening use of precision optics across consumer and industrial devices. Automatic, pattern-less computer-numerical-control (CNC) units now set the technology benchmark because they reduce finishing errors and accommodate complex freeform lens geometries. Regional retail chains that build in-store finishing labs, smartphone makers that demand ultra-thin camera optics, and hospitals that centralize optical services all feed the demand curve. Supply chain restraints for premium diamond wheels and stricter rules on airborne dust disposal introduce cost headwinds, yet most leading vendors pursue vertical integration to limit risk.
Key Report Takeaways
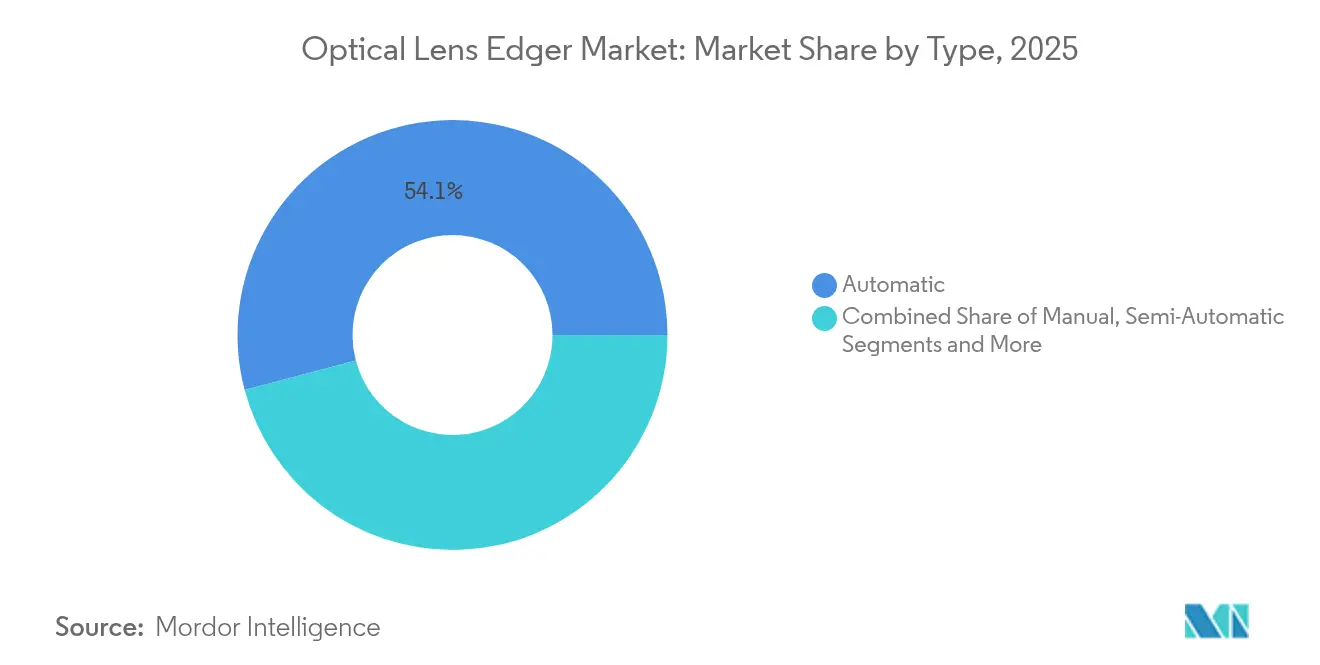
- By type, automatic edgers led with 54.12% optical lens edger market share in 2025, while semi-automatic models posted a modest 6.32% share.
- By application, eyeglass lenses accounted for 70.20% of the optical lens edger market size in 2025; smartphone / AR-VR optics is projected to expand at 6.05% CAGR to 2031.
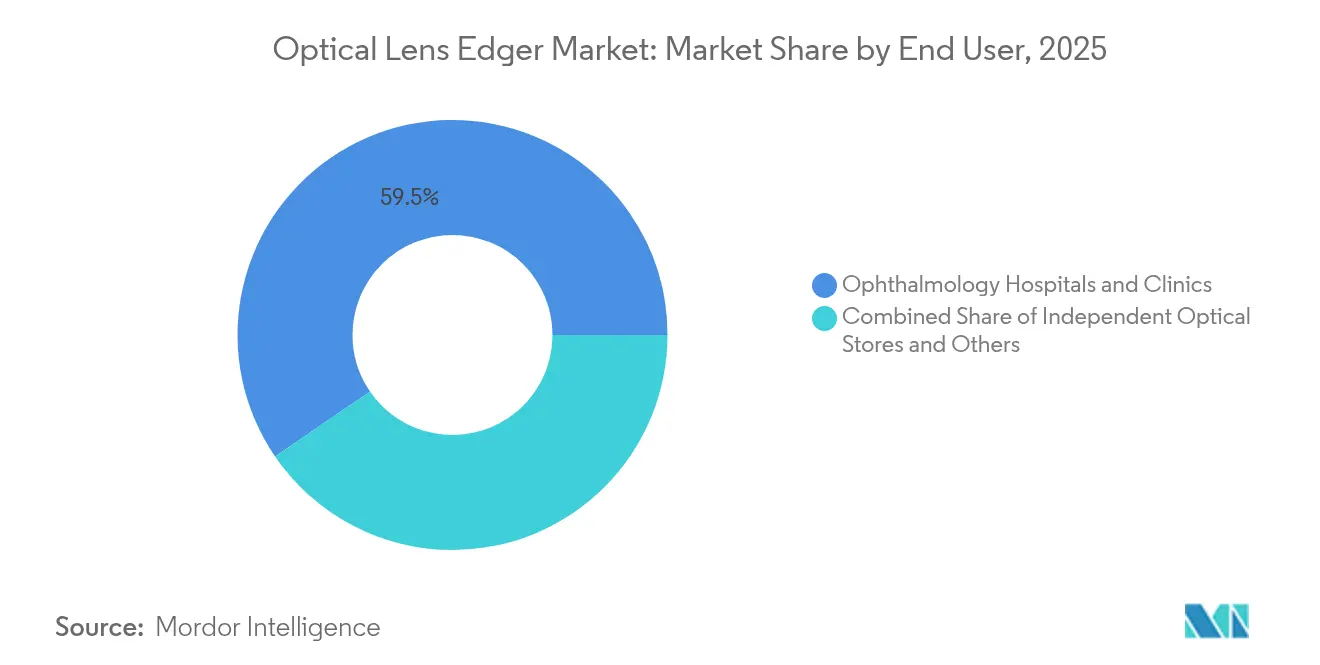
- By end user, ophthalmology hospitals and clinics held 59.55% of the optical lens edger market share in 2025; independent optical stores represented 7.05% yet are forecast to grow fastest as in-office labs spread.
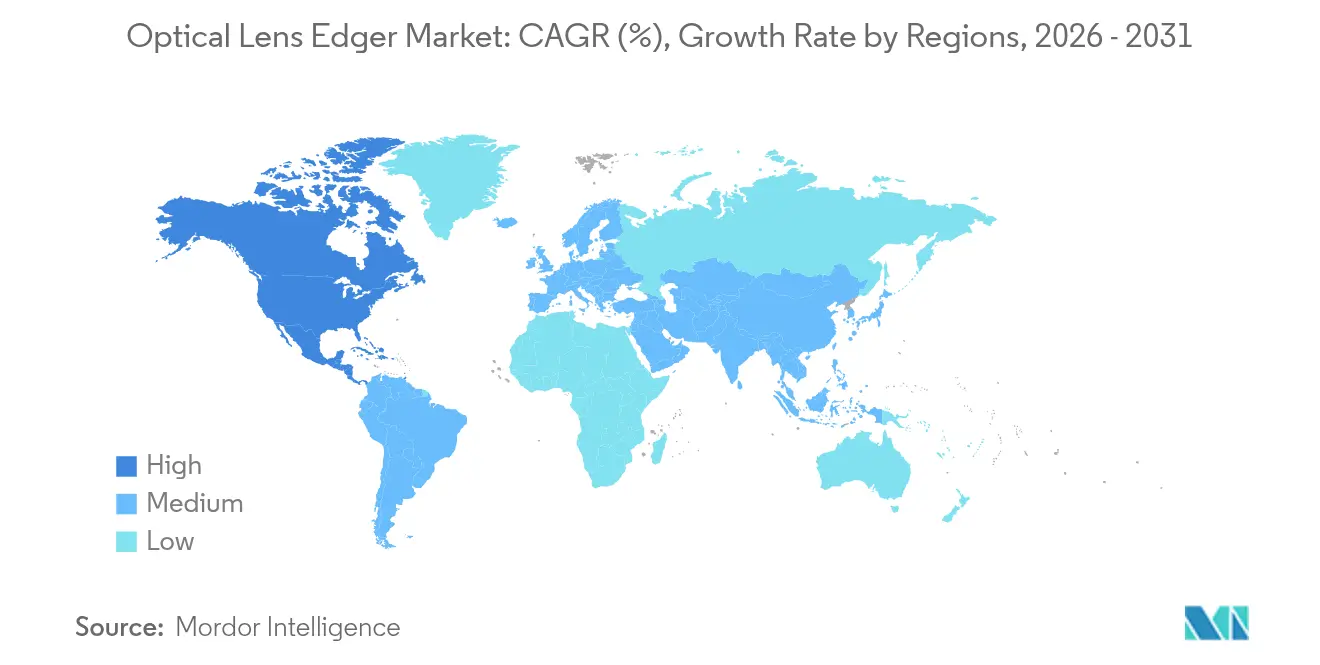
- By geography, North America commanded 42.10% revenue share in 2025, while Asia-Pacific is set to accelerate at 6.95% CAGR through 2031.
Note: Market size and forecast figures in this report are generated using Mordor Intelligence’s proprietary estimation framework, updated with the latest available data and insights as of 2026.
Market Trends and Insights
Drivers Impact Analysis of Optical Lens Edger Market*
| Driver | (~) % Impact on CAGR Forecast | Geographic Relevance | Impact Timeline |
|---|---|---|---|
| Soaring prevalence of myopia & hyper-screen exposure | +1.2% | Global, with APAC concentration | Long term (≥ 4 years) |
| Rapid expansion of vision-care retail chains in EMs | +0.8% | APAC core, spill-over to MEA | Medium term (2-4 years) |
| Uptick in geriatric population with presbyopia | +0.9% | North America & EU primarily | Long term (≥ 4 years) |
| Rising demand from camera & imaging optics makers | +0.6% | Global, concentrated in tech hubs | Medium term (2-4 years) |
| Adoption of in-office finishing labs by independents | +0.7% | North America & EU, expanding to APAC | Short term (≤ 2 years) |
| Shift to patternless CNC edgers for complex lenses | +0.5% | Global, led by developed markets | Medium term (2-4 years) |
| Source: Mordor Intelligence | |||
Soaring prevalence of myopia & hyper-screen exposure
Nearly 30% of the world’s population lived with myopia in 2020; projections point to 50% by 2050, including 1 billion high myopes who rely on complex prescription lenses [1]Padmaja Sankaridurg, “Myopia Control and Its Emerging Importance,” PubMed, pubmed.ncbi.nlm.nih.gov. The optical lens edger market benefits because freeform edging allows high-index substrates to retain thin profiles while meeting power requirements. Remote work culture amplifies screen time and shortens outdoor exposure, both linked to faster myopia progression. Economically, Asian adults already spend USD 328 billion yearly on myopia correction, signaling sustained purchasing power for advanced finishing tools. New edgers integrate algorithms to ease blue-light filter lens production, enabling labs to capture premium order value.
Rapid expansion of vision-care retail chains in emerging markets
Regional chains accelerate store rollouts and embed compact edging labs to promise same-day delivery. Paris Miki operates 635 outlets in Japan and 74 abroad, each equipped to finish lenses in-house, cutting external lab fees while improving service speed. In-office systems trim USD 5-15 per job, yielding quick payback when volumes exceed 50 pairs a day. Equipment makers position mid-tier automatic units at the USD 20,000-50,000 range, bridging affordability and precision for new entrants.
Uptick in geriatric population with presbyopia
Roughly 1.8 billion people live with presbyopia, and that count rises as longevity gains continue. Progressive-addition and extended-depth-of-focus designs require strict centration accuracy, forcing hospitals to upgrade to four-axis blockers and edgers. FDA clearance of Vuity eye drops adds diagnostic visits, nudging prescription volumes higher. Edger makers respond with tooling kits that keep multifocal alignment within two microns to meet service contracts tied to postoperative quality benchmarks.
Rising demand from camera & imaging optics makers
Multi-lens smartphone stacks demand aspheric forms held to 2-micron positioning tolerance; AR-VR waveguides need freeform surfaces outside classical designs [2]Andreas Steinich, “Optics for Mobile Devices: Challenges and Opportunities,” Carl Zeiss AG, zeiss.com. Fraunhofer IPT’s OPTICS48 pilot shows how hybrid laser-and-grinding lines cut fabrication time to 48 hours, a blueprint for agile camera-module production. Equipment suppliers introduce adaptive-pressure clamps and nano-position stages to keep edge-chipping under 5 µm for brittle infrared glasses.
Restraints Impact Analysis of Optical Lens Edger Market*
| Restraint | (~) % Impact on CAGR Forecast | Geographic Relevance | Impact Timeline |
|---|---|---|---|
| Growing preference for contact lenses & LASIK | -0.7% | Global, stronger in developed markets | Medium term (2-4 years) |
| Plateauing incremental hardware innovation cycles | -0.4% | Global, concentrated in mature markets | Short term (≤ 2 years) |
| Tight supply of premium diamond-abrasive wheels | -0.3% | Global, acute in precision segments | Short term (≤ 2 years) |
| Stricter dust-emission norms for optical workshops | -0.2% | EU & North America primarily | Medium term (2-4 years) |
| Source: Mordor Intelligence | |||
Growing preference for contact lenses & LASIK
Daily disposable lenses grew to 78.8% of UK soft-lens fits in 2023, reflecting consumer tilt toward lower maintenance eyewear [3]Alanna Young, “UK Contact Lens Market Grows 5.6% in 2023,” Association of Optometrists, aop.org.uk. Refractive surgery options such as EVO ICL extend spectacle-free intervals for younger users. These shifts temper high-volume lens edging demand in mature retail channels, though industrial and diagnostic optics remain insulated.
Plateauing incremental hardware innovation cycles
Conventional grinding and polishing deliver diminishing performance gains; many labs transitioned to automatic systems years ago. Buyers now replace units mainly for uptime or software features, lengthening refresh cycles. Incremental advances like coated spray nozzles that push surface roughness from 75 nm to 35 nm improve quality but seldom justify full system swaps in smaller shops.
*Our forecasts treat driver/restraint impacts as directional, not additive. The impact forecasts reflect baseline growth, mix effects, and variable interactions.
Optical Lens Edger Market Segment Analysis
By Type:
Automation Pushes Manual Units to the FringeAutomatic models generated the largest revenue pool and captured 54.12% optical lens edger market share in 2025. Their closed-loop servo motors and patternless tracing shorten finishing time, reduce reject rates, and enable same-day delivery for multifocal lenses. The optical lens edger market size tied to automatic platforms is forecast to expand at 5.55% CAGR through 2031 as mid-tier retailers move away from manual benches. Manual machines persist where capital budgets are tight, yet their share faces erosion as refurbished automatic units enter the secondary market. Semi-automatic systems bridge capability and cost, but only 6.32% share confirms limited long-run appeal. Integrated blocker-edger designs post the highest unit growth because they cut floor space and streamline workflows, a key metric for urban clinics with limited real estate.
Consolidation drives suppliers to bundle software, edging, and coating in one enclosure. Fraunhofer IPT’s 48-hour optics cell indicates how factory-ready blocks encompass forming, laser ablation, and edge finishing in a single track, a template that could spur next-generation product lines. Vendors embed AI-driven parameter libraries to switch from CR-39 to polycarbonate with no manual recalibration. Such features underscore why system value rises even as hardware margins compress.



By Application:
Eyeglass Lenses Maintain, but Imaging Optics SurgeEyeglass lenses held 70.20% revenue share in 2025, underpinned by the global myopia wave and presbyopic demand. The optical lens edger market benefits from higher-value multilayer coatings and blue-filter upgrades that lift average selling price. Yet smartphone and AR-VR optics form the fastest wedge, growing 6.05% yearly thanks to multi-camera phones and immersive headsets that push freeform surface needs. The optical lens edger market size for imaging optics is projected to double relative to 2024 by 2030 as handset makers raise lens counts per unit.
Scientific optics, including microscope and lab instrumentation, set stricter tolerances that pull premium pricing. Edmund Optics tightened spherical lens centration below 1 arcminute, standards only achievable with ultra-precision edging and inspection. Thin metalenses that turn infrared to visible wavelengths introduce non-traditional substrates like lithium niobate, steering demand toward hybrid laser-edge stations able to mitigate micro-cracks without post-polish.
By End User:
Hospitals Dominate, Independents Adopt In-Office LabsHospitals and clinics processed the bulk of prescriptions and held 59.55% market share in 2025. Large patient flows justify high-speed edgers that finish 150-plus lenses per shift, aligning with integrated diagnostic workflows. Independent optical stores managed 7.05% but represent the most dynamic adopter set as they install all-in-one units to cut lab outsourcing costs. Payback windows narrow to under two years when volumes cross 50 pairs daily, prompting single-location chains to finance mid-range automatic machines.
Ophthalmology centers add on-site surfacing to back premium surgical offerings such as refractive lens exchange, ensuring spectacle delivery before postoperative discharge. Industrial users—camera module assemblers, scientific labs, and defense producers—seek sub-micron edge positioning, carving a speciality lane where unit prices top USD 100,000 with aftermarket service contracts.
Geography Analysis
North America Optical Lens Edger Market
North America generated the largest revenue slice at 42.10% in 2025. Strong insurance coverage for eye exams, consumer acceptance of premium coatings, and a dense network of independent optometrists fuel equipment turnover. Many practitioners shifted to in-office labs for one-hour service, extending automatic edger penetration. The region also hosts major manufacturers that offer local service hubs; therefore, downtime penalties remain low and encourage technology updates. Safety guidelines on optical-radiation exposure tighten dust-extraction standards, pushing labs to modern enclosed systems.
APAC Optical Lens Edger Market
Asia-Pacific is the fastest riser at 6.95% CAGR from 2026-2031. Myopia incidences above 80% among urban teens in markets such as Singapore feed sustained prescription volumes. EssilorLuxottica logged 8.2% revenue lift in the region, mirroring chain expansion that embeds in-store edging. China moderates price pressure through procurement rules that favor value lenses, steering labs toward multifocal finishing to preserve margins. Japan’s Paris Miki chain prioritizes precision, spurring demand for AI-enabled blockers. India and Southeast Asia open fresh lanes as disposable incomes permit premium lens upgrades.
Europe, LATAM and Middle East Optical Lens Edger Market
Europe exhibits stable demand driven by technology refresh cycles and specialized applications. Rodenstock’s migration of finishing to Czech plants underscores cost-optimization, yet quality bars remain high. Contact-lens adoption—up 5.2% across Europe—tempers unit volumes yet stimulates niche opportunities in multifocal hard lenses that need tight concentricity. Latin America and the Middle East start from small installed bases but post double-digit unit growth where public-private partnerships fund vision-screening initiatives.

Regulatory Landscape
Optical lens edgers sit at the intersection of medical-device quality systems and optical-product standards, so compliance is shaped by both workshop safety rules and downstream ophthalmic optics requirements. In the United States, the FDA Quality Management System Regulation (QMSR) took effect on February 2, 2026, raising the bar on design controls, supplier management, and documentation practices that edger OEMs and their critical component suppliers (notably CNC controls and abrasive tooling) must align to when selling into regulated clinical settings.
In Europe, the EU MDR framework continues to tighten traceability and post-market expectations for optical products used in healthcare supply chains. The European Commission published Commission Delegated Regulation (EU) 2025/1920 on September 23, 2025, mandating Master UDI-DI assignment for spectacle frames and lenses (applicable from November 1, 2028), which pushes labs and lens suppliers to upgrade data capture and labeling interoperability that indirectly affects finishing-equipment integration. Standards updates also influence procurement: ISO 14889:2025 (published April 2025) and China GB/T 28217-2025 (released May 30, 2025, implemented December 1, 2025) formalize requirements affecting lens quality expectations and shop-level edging equipment conformance, while evolving trade measures add compliance and cost complexity for imported optical devices and parts.
Value Chain Analysis
The value chain starts with upstream inputs such as high-grade aluminum structures, CNC controllers and drives, optical-grade sensors and tracing modules, diamond-impregnated grinding wheels, coolant and filtration subsystems, and software libraries that parameterize materials from CR-39 to high-index and coated lenses. Core manufacturing and sub-assembly footprints are concentrated in Japan, Germany, and China, with final system integration typically performed by major OEMs and select private-label partners. China's GB/T 28217-2025 effective December 1, 2025, increases the need for documented inspection routines and maintenance management, extending requirements beyond the machine build to installation, calibration, and shop-floor procedures.
Downstream, distribution runs through OEM direct sales into hospital and chain-lab networks, and dealer channels serving independent optical stores. These arrangements are often bundled with installation, training, and service coverage, which can shape purchase decisions given uptime sensitivity. Aftermarket dependence is pronounced in high-consumable nodes such as diamond wheels and filtration, which are also highlighted as supply-chain pressure points for premium consumables. As edgers shift toward patternless CNC and integrated blocker-edger workflows, competitive value increasingly concentrates in software, digital tracing, and diagnostics-to-edging interoperability, tightening partnerships between equipment OEMs, lens suppliers, and retail chains running in-store finishing labs.
Competitive Landscape
The arena is moderately consolidated. EssilorLuxottica, Topcon, and NIDEK employ vertical integration and patented edge-sensing to differentiate; acquisitions such as Heidelberg Engineering’s 80% stake consolidation signal an end-to-end ecosystem strategy.
Topcon blends optomechatronics with diagnostic data to feed precision presets into its edgers, trimming technician input. NIDEK couples biometry with surfacing to guarantee postoperative refractive targets. Coburn Technologies targets North American independents with mid-price automatic lines, while MEI focuses on compact edgers that slot beneath retail counters.
Second-tier brands like Huvitz and Santinelli win share by bundling service contracts and financing packages, appealing to cash-conscious small labs. Disruptors experiment with additive-manufactured tooling and cloud-based process analytics that flag mis-centered lenses in real time. High switching costs, software lock-ins, and multi-year warranty ties protect incumbents, so price wars remain muted. The patent landscape highlights adaptive clamping, auto-calibration lasers, and machine-learning kerf prediction, each feeding incremental performance gains as mechanical limits approach.
Optical Lens Edger Industry Leaders
Essilor International S.A
Topcon Corporation
Coburn Technologies Inc
Huvitz Corp
NIDEK CO., LTD
- *Disclaimer: Major Players sorted in no particular order
Optical Lens Edger Market Companies Covered in this Report
- EssilorLuxottica
- Topcon Corp.
- Nidek
- Coburn Technologies
- Huvitz Corp.
- MEI Srl
- Santinelli International
- Satisloh (Bühler)
- Schneider Optical Machines
- OptoTech
- Briot-Weco (Luneau Tech)
- Supore Instruments
- National Optronics
- Visslo
- INNOVA Medical Ophthalmics
- Nanjing Laite Optical
- Veer Optronics
- DTC (Delco)
- Marmore Inc.
- Beijing HongDi

Market Opportunities and Future Outlook
Whitespace is opening around in-office finishing systems that help independents and smaller clinics capture same-day delivery economics without relying on wholesale labs, particularly as complex lens geometries and coatings raise reject-rate sensitivity. The market context already shows payback improving when volumes cross roughly 50 pairs per day, and product moves such as Coburn Technologies introduction of the Huvitz HPE-990 lens edger (positioned as a premium in-office finishing system with high-curve and specialty bevel capabilities) reinforce vendor focus on compact, higher-function platforms tailored to retail and clinic footprints.
On the technology frontier, manufacturing approaches that alter how prescription lenses are formed are gaining visibility, creating both opportunity and disruption for edger OEMs. American Chemical Society reporting in July 2026 highlighted activity around new lens-making methods (including rapid curing concepts and additive workflows), and academic work on fluidic shaping and footprint-matching algorithms points to a pathway where lens geometry is produced closer to final rim shape, changing how much post-fabrication edging is required. For edger suppliers, this supports near-term demand for hybrid capability (handling hydrophobic coatings, high-curvature lenses, and fragile materials with improved clamping and anti-slip control), while also pushing R and D into modular finishing cells and software-defined process control that can fit emerging lens fabrication routes rather than competing only on mechanical grinding throughput.
Recent Industry Developments in Optical Lens Edger Market
- February 2026: The US FDA Quality Management System Regulation (QMSR) became effective, elevating quality-system expectations for manufacturers supplying equipment into regulated clinical environments. For optical lens edger OEMs, this increases emphasis on supplier controls, documentation discipline, and service traceability when selling into hospital and clinic labs.
- August 2025: Coburn Technologies introduced the Huvitz HPE-990 lens edger, positioning it as a premium in-office finishing system with high-speed motor performance and Deep Step Bevel functionality for lens-over-frame sunglass manufacturing. The launch targets higher-value retail finishing use cases, including high-curve and specialty eyewear, where precision and repeatability influence remake rates and lab profitability.
- June 2025: ETH Zurich reported ultra-thin lithium-niobate metalenses, demonstrating a compact optics pathway that can expand the mix of specialty substrates and geometries moving through precision finishing workflows. This type of optics innovation raises requirements for handling brittle or non-traditional materials, supporting demand for advanced edging control and inspection integration.


Optical Lens Edger Market Report Scope and Research Methodology
Market Definition and Coverage
For this study, the market covers revenue earned from new optical lens edger machines used to shape and finish lenses to match a selected frame shape in optical labs, retail stores, and clinical settings.
Scope exclusions: We exclude used or refurbished units, equipment rental, standalone blockers, edging consumables, and service or maintenance contracts.
Segments Covered in This Report
- By Type
- Manual
- Semi-Automatic
- Automatic
- Patternless CNC
- Integrated Blocker-Edger Systems
- By Application
- Eyeglass Lens
- Microscope/Scientific Lens
- Camera & Imaging Lens
- Smartphone/AR-VR Lens
- By End User
- Independent Optical Stores
- Ophthalmology Hospitals & Clinics
- Others
- By Geography
- North America
- United States
- Canada
- Mexico
- Europe
- Germany
- United Kingdom
- France
- Italy
- Spain
- Rest of Europe
- Asia-Pacific
- China
- Japan
- India
- Australia
- South Korea
- Rest of Asia-Pacific
- Middle East & Africa
- GCC
- South Africa
- Rest of Middle East & Africa
- South America
- Brazil
- Argentina
- Rest of South America
- North America
Data Sources, Market Sizing, and Validation
Desk Research
Desk research was used to set the market boundaries and build realistic input ranges for demand and pricing. We relied on public sources such as US Census Bureau trade and manufacturing statistics, UN Comtrade for cross border flows, World Bank and IMF macro series for country level normalization, and OECD health indicators for eye care related context.
Along with this, we reviewed company annual reports, investor decks, product brochures, and patent databases to track technology shifts such as automation levels and digital tracing. A paid subscription for company financials and news was used to sanity check revenue direction and organizational changes. Where trade signals were useful, we also pulled from an import and export shipment level database to explain unit movement by region. These sources are not exhaustive, and many other public documents were also referenced for data collection, validation, and clarification.
Primary Interviews and Surveys
Primary work focused on interviews and surveys with equipment manufacturers, optical lab owners, retail optical chains, distributors, and service teams who see installation and replacement cycles in practice. For global coverage, inputs were cross checked across APAC, EMEA, and the Americas so differences in lab automation, pricing, and purchasing routes could be captured and then reconciled into one consistent view.
Distribution of primary research fieldwork respondents
| Company type | Respondent position | Region |
|---|---|---|
| Top tier: 29% | CXOs: 14% | APAC: 46% |
| Mid tier: 55% | Functional/Unit leaders: 26% | EMEA: 31% |
| Smaller Players: 16% | Managers: 60% | Americas: 23% |
Market-Sizing & Forecasting
Sizing starts with a top down build where the demand pool is reconstructed from optical lab and store counts, estimated edger penetration, typical replacement cycles, and average selling price ranges by automation level. Once this structure was set, we tested it with selective bottom-up checks, where sampled unit shipments and channel feedback were translated into value and used to adjust the overall totals.
Key inputs in the model include the pace of lab automation, the share of in house edging versus outsourced lab work, the mix shift toward automatic and patternless systems, import intensity in markets with limited local production, and serviceability factors that influence replacement timing. Forecasts were produced using scenario analysis since purchasing decisions often align with macro confidence and clinic and retail capex cycles. Scenarios were then compared against what primary respondents described as realistic over the next few years. When direct unit signals were weak for a smaller country, proxy indicators such as optical retail footprint growth and trade movement were used, then reviewed again during validation.
Data Validation & Update Cycle
Outputs are cross checked against independent signals such as trade values, installation base discussions shared by experts, and pricing bands visible in public product information. If a country level result looks unusual, assumptions are revisited, and follow up calls are made to confirm whether the difference is coming from scope, timing, or price mix.
Before sign off, the model and written conclusions go through multi step analyst review so arithmetic, logic, and narrative stay aligned. The report is refreshed annually, and interim updates are made when material events occur, such as policy changes that impact optical retail activity or major supply disruptions. Before delivery, one final pass is completed so clients receive the latest updated view.
Mordor Intelligence's Optical Lens Edger Market Size Versus Other Published Estimates
Published market sizes for optical lens edgers often differ because teams pick different product boundaries, timing of the base year, and how they translate units into dollars when price mix is shifting.
The main gap comes from whether refurbished and service revenues are counted, where Mordor Intelligence keeps the scope to new machine sales and then applies ASP movement based on automation mix and replacement cycles rather than using a single blended price for all systems.
Benchmark comparison
| Source | Market Size | Gaps in Research Methodology |
|---|---|---|
| Mordor Intelligence | USD 0.62 B (2025) | |
| Global Consultancy A | USD 0.66 B (2025) | Uses a broader equipment revenue pool in some regions and applies a higher uniform growth path through 2034, which can lift the 2025 value when back-cast from long range forecasts. |
| Industry Publisher B | USD 0.52 B (2024) | Anchors the market in an earlier year and appears to rely more on generic CAGR application without clearly separating price mix by automation level, which can understate near term value when premium systems rise. |
Overall, the spread is explained by scope and timing choices first, and then by how pricing and replacement behavior are modeled. By keeping inputs tied to lab footprint, penetration, replacement cycles, and observed price bands, the estimate stays traceable and can be repeated when new evidence is collected.


Key Questions Answered in the Report
What is the current Global Optical Lens Edger Market size?
The optical lens edger market generated USD 653.65 million in 2026 and is projected to grow to USD 836.28 million by 2031 at a 5.05% CAGR.
Who are the key players in Global Optical Lens Edger Market?
Essilor International S.A, Topcon Corporation, Coburn Technologies Inc, Huvitz Corp and NIDEK CO., LTD are the major companies operating in the Global Optical Lens Edger Market.
Which segment leads by type?
Automatic edgers lead, accounting for 54.12% revenue share in 2025 due to their precision and labor-saving benefits.
Which region is expanding fastest?
Asia-Pacific shows the quickest momentum with a 6.95% CAGR expected between 2026 and 2031, driven by high myopia rates and retail chain growth.
Page last updated on:


 Your data is secure and never sold or shared.


