Online Trading Platform Market Size and Share
Market Overview
| Study Period | 2020 - 2031 |
|---|---|
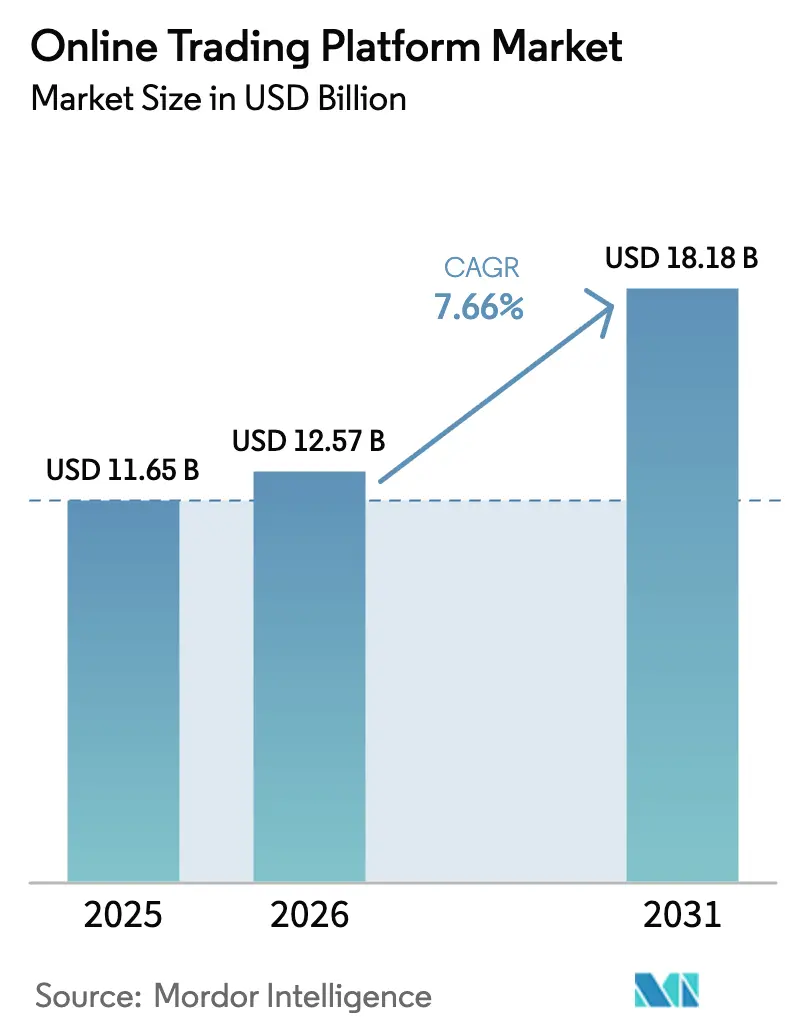
| Market Size (2026) | USD 12.57 Billion |
| Market Size (2031) | USD 18.18 Billion |
| Growth Rate (2026 - 2031) | 7.66% CAGR |
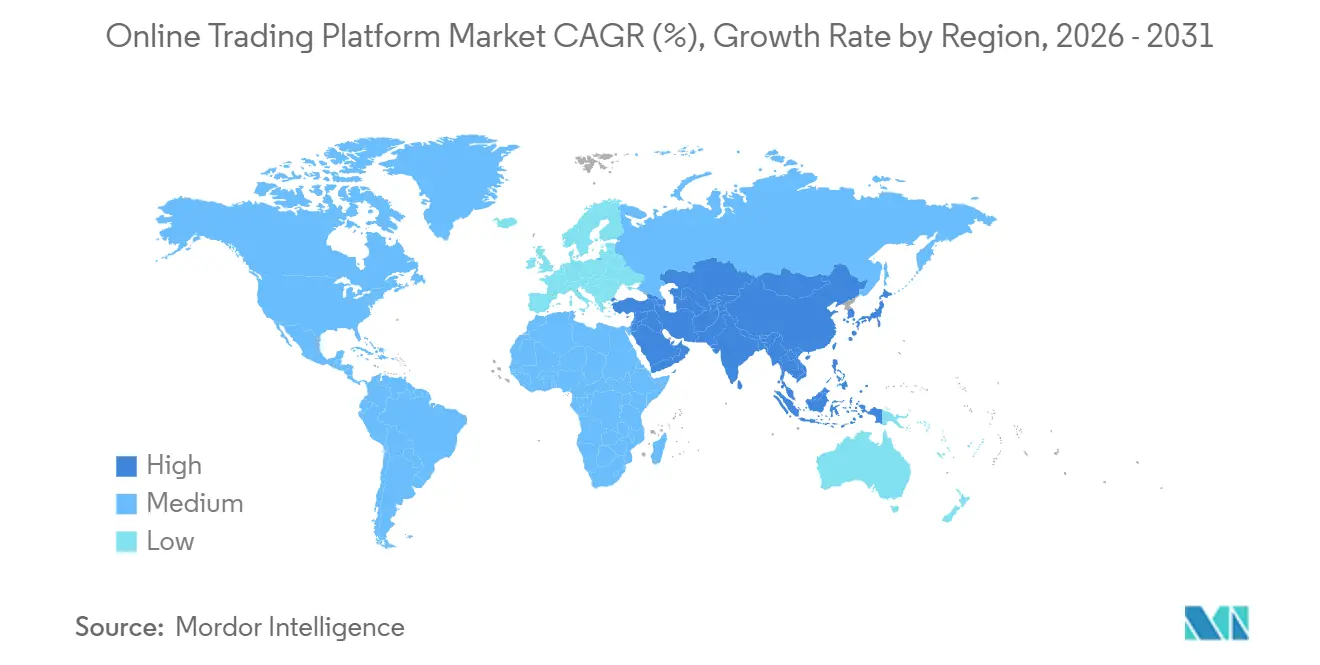
| Fastest Growing Market | Asia Pacific |
| Largest Market | North America |
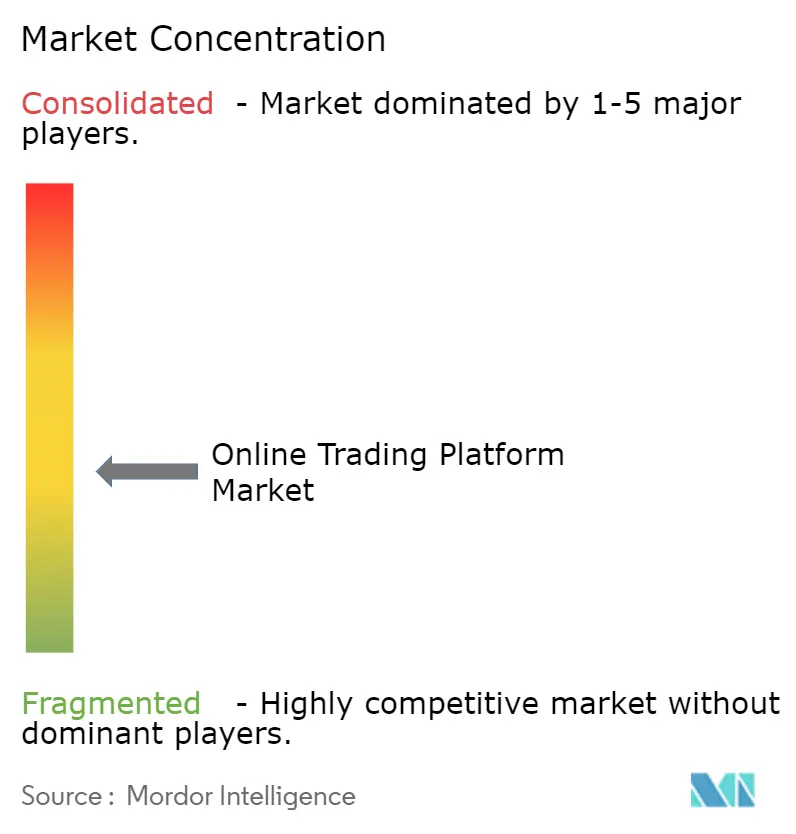
| Market Concentration | Medium |
Major Players *Disclaimer: Major Players sorted in no particular order Image © Mordor Intelligence. Reuse requires attribution under CC BY 4.0. | |
Online Trading Platform Market Analysis by Mordor Intelligence
The online trading platform market size is projected to expand from USD 11.65 billion in 2025 and USD 12.57 billion in 2026 to USD 18.18 billion by 2031, registering a 7.66% CAGR between 2026 and 2031. Momentum is fueled by mobile-first investors, cloud-native scalability, and a piecemeal regulatory landscape that rewards agile compliance strategies. As zero-commission offers squeeze legacy margins, brokers are monetizing interest on idle balances, payment-for-order-flow, and subscription bundles that bundle advanced analytics with robo-advisory cues. Cloud deployment already anchors more than half of the online trading platform market, giving providers real-time elasticity when retail volumes spike during volatility. Finally, white-label APIs are unbundling brokerage services, allowing neobanks to embed trading while sidestepping the capital burden of full broker-dealer licenses.
Key Report Takeaways
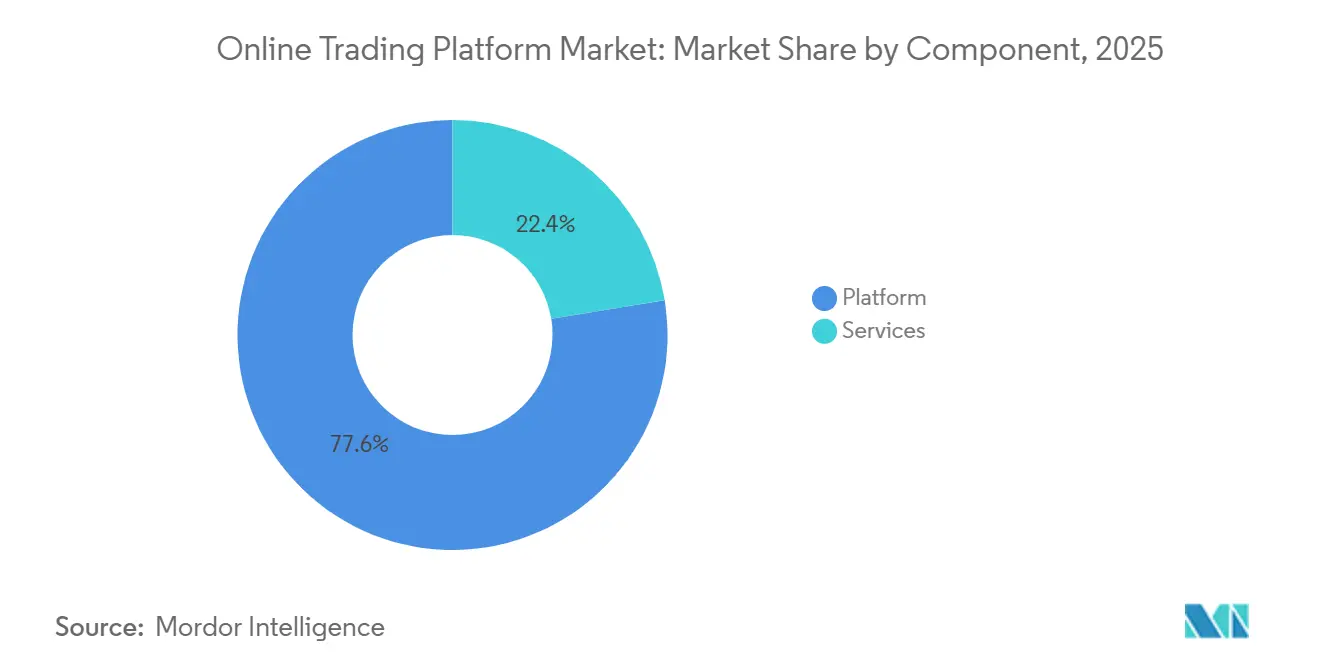
- By component, platform offerings captured 77.59% of online trading platform market share in 2025, whereas services are forecast to expand at a 9.86% CAGR to 2031 as brokers lean into robo-advisory subscriptions and API licensing.
- By charges type, transaction fees accounted for 59.67% of the online trading platform market size in 2025 and are still set to grow at 8.12% through 2031 despite headline “zero-commission” messaging.
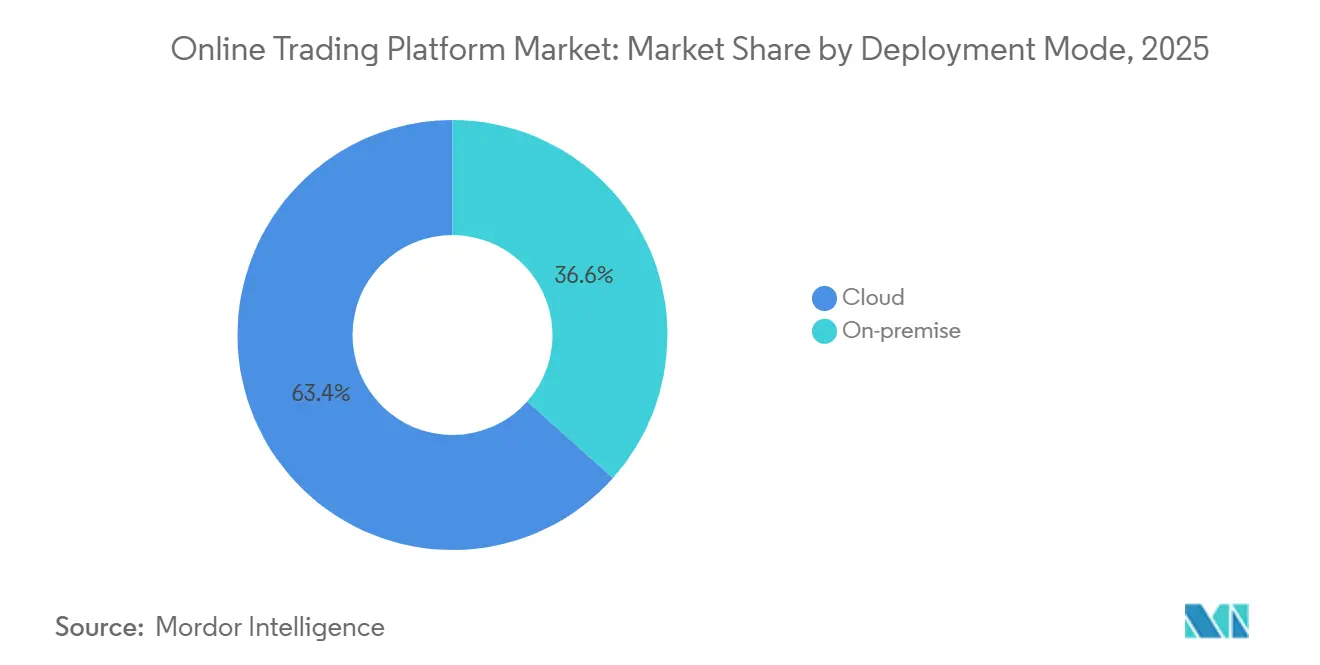
- By deployment mode, cloud-based systems held 63.42% of online trading platform market share in 2025 and are advancing at an 8.51% CAGR, steadily eroding the on-premise footprint
- By application, retail investors controlled 69.59% of the online trading platform market size in 2025 and will grow at an 8.43% CAGR to 2031, propelled by fractional shares and gamified mobile apps.
- By geography, North America led with 33.87% of revenue in 2025, but Asia-Pacific is on pace for the fastest 9.03% CAGR through 2031, reflecting rising smartphone penetration and gradual capital-markets liberalization.
Note: Market size and forecast figures in this report are generated using Mordor Intelligence’s proprietary estimation framework, updated with the latest available data and insights as of 2026.
Global Online Trading Platform Market Trends and Insights
Drivers Impact Analysis*
| Driver | (~) % Impact on CAGR Forecast | Geographic Relevance | Impact Timeline |
|---|---|---|---|
| Mobile-First Retail Trading Adoption | +1.8% | Global, Highest in Asia-Pacific and South America | Medium Term (2-4 Years) |
| AI-Driven Robo-Advisory Integration | +1.5% | North America and Europe Core, Spreading to Asia-Pacific | Long Term (≥ 4 Years) |
| Fractional Share Trading Regulatory Approvals | +1.3% | North America and Europe, Pilot Asia-Pacific Markets | Short Term (≤ 2 Years) |
| API-Based Brokerage-as-a-Service Demand | +1.2% | Global, Led by U.S., EU, and Singapore | Medium Term (2-4 Years) |
| Real-Time ESG Scoring Widgets for Gen-Z Investors | +0.9% | Europe and North America, Nascent in Asia-Pacific | Long Term (≥ 4 Years) |
| On-Device ML Behavioral Nudges Reducing Churn | +0.7% | Global, Early U.S. and EU Deployment | Medium Term (2-4 Years) |
| Source: Mordor Intelligence | |||
Mobile-First Retail Trading Adoption
Smartphones have replaced desktops as the first contact point for retail investors, making intuitive, latency-light interfaces a prerequisite for growth in the online trading platform market. Seamless biometric login, instant wallet funding, and tap-to-trade journeys mirror e-commerce checkouts and erase historical onboarding friction. Charles Schwab disclosed that mobile app sessions jumped 34% in 2025, with 62% of retail orders now placed via handheld devices.[1]Charles Schwab Corporation, “Form 10-K Annual Report for Fiscal Year Ended December 31, 2025,” SEC, sec.gov India and Southeast Asia exemplify the shift, with mobile internet users dwarfing fixed broadband households. Because regulators stay device-neutral, competitive advantage now hinges on uptime, response speed, and iterative feature releases that fit small-screen ergonomics.
AI-Driven Robo-Advisory Integration
Robo modules have matured from passive rebalancing to real-time tax-loss harvesting and consumption-linked risk profiling, transforming platforms into end-to-end decision support centers. Interactive Brokers reported 28% lower attrition among robo users than execution-only clients in 2025.[2]Interactive Brokers LLC, “Q3 2025 Earnings Call Transcript,” Interactive Brokers Investor Relations, interactivebrokers.com Proprietary behavioral datasets, risk tolerance or cash-flow patterns, can be anonymized and sold to asset managers chasing retail sentiment signals, adding fresh revenue streams. Regulation Best Interest and MiFID II force more transparent algorithmic disclosures, but neither curtails adoption, so robo capability is fast becoming table stakes in the online trading platform market.
Fractional Share Trading Regulatory Approvals
Sub-share buying removes price barriers for high-ticket stocks, enabling younger or lower-income cohorts to diversify with minimal capital. U.S. and European regulators clarified in 2024-2025 that fractional positions can reside in omnibus custody without voting rights, eliminating legal gray zones.[3]U.S. Securities and Exchange Commission, “No-Action Letter on Fractional Share Trading,” SEC Division of Trading and Markets, sec.gov Order frequency tends to rise once users engage in low-denomination trades, boosting payment-for-order-flow income even though explicit commissions disappear. With compliance clarity in place, platforms worldwide are shipping fractional features to widen reach inside the online trading platform market.
API-Based Brokerage-as-a-Service Demand
BaaS providers wrap order routing, custody, and licensing into modular APIs so neobanks and super-apps can launch trading with little capital overhead. DriveWealth and Alpaca together powered more than 150 embedded integrations by mid-2025.[4]DriveWealth LLC, “Mid-Year 2025 Business Update,” DriveWealth, drivewealth.com This structural separation lets fintechs focus on front-end UX while specialists handle back-office complexity, disaggregating the traditional brokerage value chain. Net-capital thresholds still classify hosts as introducing brokers, nudging market share toward well-funded, multi-jurisdictional platforms.
Restraints Impact Analysis*
| Restraint | (~) % Impact on CAGR Forecast | Geographic Relevance | Impact Timeline |
|---|---|---|---|
| EU MiFID III Compliance Cost Inflation | -1.1% | Europe with Global Spillover | Short Term (≤ 2 Years) |
| Rising Cyber-Security Breaches | -0.9% | Global, Severe in U.S. and EU | Short Term (≤ 2 Years) |
| Revenue Compression from Zero-Commission Saturation | -0.7% | North America and Europe, Emerging Asia-Pacific | Medium Term (2-4 Years) |
| Latency-Arbitrage Risk from Co-Location Trading | -0.5% | North America and Europe | Long Term (≥ 4 Years) |
| Source: Mordor Intelligence | |||
EU MiFID III Compliance Cost Inflation
Phased rulemaking slated for full enforcement in 2026 forces brokers to install real-time surveillance, granular reporting, and stricter inducement controls. PwC pegs upfront outlays for a mid-tier broker at EUR 15 million-EUR 40 million (USD 16 million-USD 43 million), with 12%-18% recurring expense inflation. Smaller European firms may exit or consolidate, while global brokers must ring-fence capital for EU clients. The diversion of funds from R&D leaves less budget for mobile upgrades, slowing user experience improvements and creating a headwind for the online trading platform market.
Rising Cyber-Security Breaches
Ransomware and credential-stuffing attacks erode user trust faster than marketing can restore it. Robinhood’s USD 85 million security retro-fit in 2024 underlines the scale of remediation spending. FINRA now requires quarterly penetration testing and structured incident response playbooks, adding compliance drag. Breaches invite class actions under GDPR or Regulation S-P, ratcheting up legal exposure. Elevated threat landscapes therefore act as a universal restraint, especially in North America and Europe where enforcement is stringent and users are quick to switch providers.
*Our forecasts treat driver/restraint impacts as directional, not additive. The impact forecasts reflect baseline growth, mix effects, and variable interactions.
Segment Analysis
By Component: Services Gain as Platforms Commoditize
Services contributed only 22.41% revenue in 2025, yet they are pacing at a 9.86% CAGR that outstrips the 7.66% expansion of the broader online trading platform market. The online trading platform market size for service offerings is projected to capture a steadily larger slice of wallet share as brokers roll out managed portfolios, tax engines, and white-label APIs. Subscriptions smooth cash flows in a landscape where explicit commissions are negligible, enabling incumbents to cross-finance digital upgrades. DriveWealth’s BaaS model, which booked a 47% year-over-year lift in 2025, illustrates how licensing income scales without proportionate marketing spend.
Platform revenue, while still dominant, exhibits margin erosion as execution quality converges and price wars race to the bottom. As mobile-first users treat trading as a commodity utility, differentiation shifts to advisory layers and ecosystem partnerships. Brokers that fail to cultivate service pipelines risk revenue decay once payment-for-order-flow rates face regulatory caps. Consequently, component dynamics signal that the online trading platform market will reward operators that can layer fee-based advisory models on top of speed-optimized execution rails.


By Charges Type: Transaction Fees Persist Despite Zero-Commission Rhetoric
The marketing promise of zero commissions disguises the resilience of transaction-based monetization. Transaction fees captured 59.67% revenue in 2025 and are projected to rise at an 8.12% CAGR, eclipsing other fee categories within the online trading platform market. Brokers embed costs in foreign-exchange spreads, options contract charges, and payment-for-order-flow rebates, allowing revenue generation without explicit line-items on statements. The SEC’s 2024 proposal to force per-trade disclosure of PFOF income could erode this tactic, yet no binding rule has materialized, preserving the status quo.
Subscription tiers, bundling Level II order books and advanced charting, entice heavy traders but face resistance among casual users wary of recurring charges. Spread mark-ups on crypto and forex generate windfalls when volatility spikes, offsetting lulls in equity turnover. These hybrid fee matrices show that the online trading platform market is not abandoning transaction economics, it is reframing them in less visible forms that regulators are only beginning to scrutinize.
By Deployment Mode: Cloud Migration Speeds Up in Volatile Markets
Cloud-based deployments owned 63.42% of 2025 revenue, and this slice is growing at an 8.51% CAGR as the online trading platform market migrates away from fixed-capacity data centers. Real-time margin calculations, options Greeks, and risk analytics all burst compute ceilings during market whipsaws, making elastic scaling indispensable. Interactive Brokers shaved 18 milliseconds off quote latency by moving pricing engines to AWS, translating speed into execution quality, a metric retail social forums increasingly rank.
On-premise systems persist among a shrinking cadre of institutional brokers tied to decades-old mainframes. Maintenance windows, capex cycles, and geographic expansion costs create drag that cloud peers sidestep with region-agnostic deployments. Cybersecurity once favored on-premise controls, yet hyperscale vendors now match or exceed internal defenses, undercutting the remaining argument against migration. Deployment choices therefore bifurcate the online trading platform market into agile cloud natives and legacy incumbents confronting inevitable modernization.
By Application: Retail Momentum Outpaces Institutional Stability
Retail activity represented 69.59% of 2025 trades, and it is expanding at an 8.43% CAGR, reinforcing how democratized access fuels the online trading platform market. Fractional shares, gamified leaderboards, and social feeds entice Gen-Z cohorts, converting them from observers to market participants. Indian broker Zerodha’s 12 million active accounts illustrate the scale unlocked by low-balance onboarding paths. Because individual tickets skew small, total revenue hinges on frequency rather than ticket size, pushing platforms to drop latency and add behavioral nudges that promote repeat trades.
Institutional desks, while a minority in volume, generate high-value algorithmic routing fees and dark-pool commissions. Their requirements, execution algorithms tuned for implementation shortfall, colocation for microsecond fills, and granular post-trade analytics, demand R&D investments that only well-capitalized providers can sustain. As asset managers seek multi-asset OMS stacks, brokers offering unified equities-futures-FX rails gain share. This split personality forces platforms to straddle two ends of the service continuum, proving the adaptability of the online trading platform market.
Geography Analysis
North America accounted for 33.87% revenue in 2025, buoyed by deep capital markets and widespread tax-advantaged retirement accounts. The region’s growth is decelerating relative to emerging peers because more than half of U.S. households already own equities, limiting first-time user upside. Brokers are therefore pivoting toward wallet-share strategies such as cash-sweep interest and robo-tax tools to sustain top-line momentum. Canada’s consolidated banking structure inhibits fintech entry, while Mexico’s high inflation and limited financial literacy slow retail onboarding, capping continental upside. Nonetheless, regulatory stability and entrenched wealth pools keep North America the largest single contributor to the online trading platform market size.
Asia-Pacific is primed for a 9.03% CAGR by 2031, the highest regional clip, as India’s UPI rail streamlines funding and China loosens wealth-management fences. The online trading platform market size for the region is accelerating because smartphone adoption leaps over desktop incumbency; population-scale mobile penetration offers immediate scale for cloud-native brokers. Regulatory headwinds persist, China’s CSRC capital controls and Japan’s cautious stance on crypto trading, but localized players such as Futu (Moomoo) adapt faster than international brands shackled by cross-border licensing. South Korea and Australia add mature infrastructure to the region, yet their growth rates trail India’s retail surge.
Europe’s outlook is hampered by MiFID III compliance spend that diverts capital from customer acquisition, holding the region to mid-single-digit CAGR. Brexit forces dual licensing footprints, inflating overhead for UK-EU cross-border platforms. The Nordics exhibit best-in-class digital adoption yet limited population bases, while Central and Eastern Europe remain price-sensitive and fragmented. South America and the Middle East and Africa collectively represent single-digit contributions today but harbor pockets of promise: Brazil’s inflation-hedging retail wave and the United Arab Emirates’ sovereign-backed FinTech sandboxes signal upside catalysts. Still, currency volatility, political risk, and patchy broadband complicate scaling, tempering the aggregate impact on the global online trading platform market.
Mordor Intelligence provides coverage of the online trading platform market across other key regional markets. Detailed country-level analysis extends to United States incorporating local coverage and market participation, as required.

Competitive Landscape
The online trading platform market is moderately concentrated: the top five incumbents account for roughly 55% combined revenue, leaving ample room for disruptors. Incumbents such as Charles Schwab, Interactive Brokers, and Fidelity counter zero-commission income loss by monetizing idle cash, securities lending, and advisory subscriptions. Robinhood, Zerodha, and Futu court younger demographics with gamified UX, but escalating customer-acquisition costs on social channels compress startup runways. API-first brokers like Alpaca and DriveWealth bypass retail ad spend entirely, embedding licensed trading rails inside super-apps and digital wallets, thus capturing wholesale volumes invisible to traditional league tables.
Technology remains the decisive battlefield. Millisecond-level latency improvements translate into social-media bragging rights that sway retail communities. Intellectual-property filings around behavioral nudges, real-time ESG scoring, and on-device machine learning establish defensible moats. Regulatory overhang shapes strategy: proposed U.S. caps on payment-for-order-flow could undercut free-trade leaders, while MiFID III’s inducement bans push European brokers to produce in-house research or acquire boutique analysts. Capital adequacy rules favor incumbents with sizable balance sheets, yet cloud economics reduce fixed costs for newcomers, balancing barriers to entry.
Consolidation pressures intensify as compliance and marketing spend rise faster than revenue. Schwab’s full integration of TD Ameritrade’s 12 million accounts saves USD 400 million in annual opex, setting a benchmark for synergy extraction. Neobank partnerships such as Revolut-Robinhood demonstrate how embedded finance can unlock scale without direct retail licensing. Private-equity interest peaks where API infrastructure offers predictable recurring income at margin profiles absent in consumer-facing brokers. Thus, strategic maneuvering, not price wars, will define the competitive hierarchy of the online trading platform market.
Online Trading Platform Industry Leaders
TradeStation Group, Inc.
Interactive Brokers LLC
Ally Financial Inc.
MarketAxess Holdings Inc.
DigiFinex Limited
- *Disclaimer: Major Players sorted in no particular order

Recent Industry Developments
- January 2026: Charles Schwab Corporation completed its USD 1.2 billion acquisition of Wealthfront, adding USD 50 billion in robo-managed assets and direct-indexing technology to its retail suite.
- December 2025: Interactive Brokers LLC introduced fractional trading across 8,000 U.S. and European equities with minimum tickets of USD 1, responding to regulatory green lights.
- November 2025: Robinhood Markets Inc. partnered with Revolut, embedding Robinhood’s brokerage rails into Revolut’s European banking app serving 35 million users.
- October 2025: Zerodha Broking Ltd. raised USD 250 million from Temasek Holdings, valuing the firm at USD 3.5 billion and funding Southeast Asian expansion.


Global Online Trading Platform Market Report Scope
An online trading platform lets users and individuals place orders for financial items across a network with a financial intermediary while streaming real-time market prices. These financial items include stocks, bonds, money, commodities, derivatives, etc.
The Online Trading Platform Market Report is Segmented by Component (Platform, and Services), Charges Type (Commissions, Transaction Fees, Subscription Fees, and Spread Mark-Up), Deployment Mode (On-Premise, and Cloud-Based), Application (Institutional Investors, and Retail Investors), and Geography (North America, Europe, Asia-Pacific, South America, Middle East, and Africa). The Market Forecasts are Provided in Terms of Value (USD).
| Platform |
| Services |
| Commissions |
| Transaction Fees |
| Subscription Fees |
| Spread Mark-Up |
| On-Premise |
| Cloud-Based |
| Institutional Investors |
| Retail Investors |
| North America | United States |
| Canada | |
| Mexico | |
| Europe | United Kingdom |
| Germany | |
| France | |
| Nordics | |
| Rest of Europe | |
| Asia-Pacific | China |
| India | |
| Japan | |
| South Korea | |
| Rest of Asia-Pacific | |
| South America | Brazil |
| Argentina | |
| Rest of South America | |
| Middle East | United Arab Emirates |
| Saudi Arabia | |
| Turkey | |
| Rest of Middle East | |
| Africa | South Africa |
| Nigeria | |
| Rest of Africa |
| By Component | Platform | |
| Services | ||
| By Charges Type | Commissions | |
| Transaction Fees | ||
| Subscription Fees | ||
| Spread Mark-Up | ||
| By Deployment Mode | On-Premise | |
| Cloud-Based | ||
| By Application | Institutional Investors | |
| Retail Investors | ||
| By Geography | North America | United States |
| Canada | ||
| Mexico | ||
| Europe | United Kingdom | |
| Germany | ||
| France | ||
| Nordics | ||
| Rest of Europe | ||
| Asia-Pacific | China | |
| India | ||
| Japan | ||
| South Korea | ||
| Rest of Asia-Pacific | ||
| South America | Brazil | |
| Argentina | ||
| Rest of South America | ||
| Middle East | United Arab Emirates | |
| Saudi Arabia | ||
| Turkey | ||
| Rest of Middle East | ||
| Africa | South Africa | |
| Nigeria | ||
| Rest of Africa | ||


Key Questions Answered in the Report
How large will global platforms become by 2031?
The online trading platform market size is projected to reach USD 18.18 billion by 2031, expanding at a 7.66% CAGR from 2026.
Which region offers the fastest growth opportunity?
Asia-Pacific leads with a forecast 9.03% CAGR through 2031, driven by smartphone penetration, regulatory liberalization, and pension reforms.
Why do brokers still earn from "zero-commission" trades?
Hidden transaction fees, spreads on forex and crypto, and payment-for-order-flow arrangements continue to deliver revenue even when explicit commissions are waived.
What role does cloud computing play?
Cloud deployments now command 63.42% market share and allow brokers to scale compute resources instantly during volatility spikes, cutting latency and infrastructure costs.
How will MiFID III affect European platforms?
Mandatory real-time reporting and inducement bans could add USD 16 million-43 million in upfront compliance costs for mid-tier firms, pressuring margins and spurring consolidation.
Which segment is expected to outpace the broader market?
Services revenues such as, robo-advisory, API licensing, and white-label infrastructure, are forecast to grow at 9.86% annually, faster than core execution platforms.
Page last updated on:


