
Market Overview
| Study Period | 2021 - 2031 |
|---|---|
| Market Size (2026) | USD 2.95 Billion |
| Market Size (2031) | USD 4.13 Billion |
| Growth Rate (2026 - 2031) | 6.95 % |
| Fastest Growing Market | Asia Pacific |
| Largest Market | North America |
| Market Concentration | Medium |
Major Players
*Disclaimer: Major Players sorted in no particular order Image © Mordor Intelligence. Reuse requires attribution under CC BY 4.0. |
|
Omega 3-PUFA Market Analysis by Mordor Intelligence
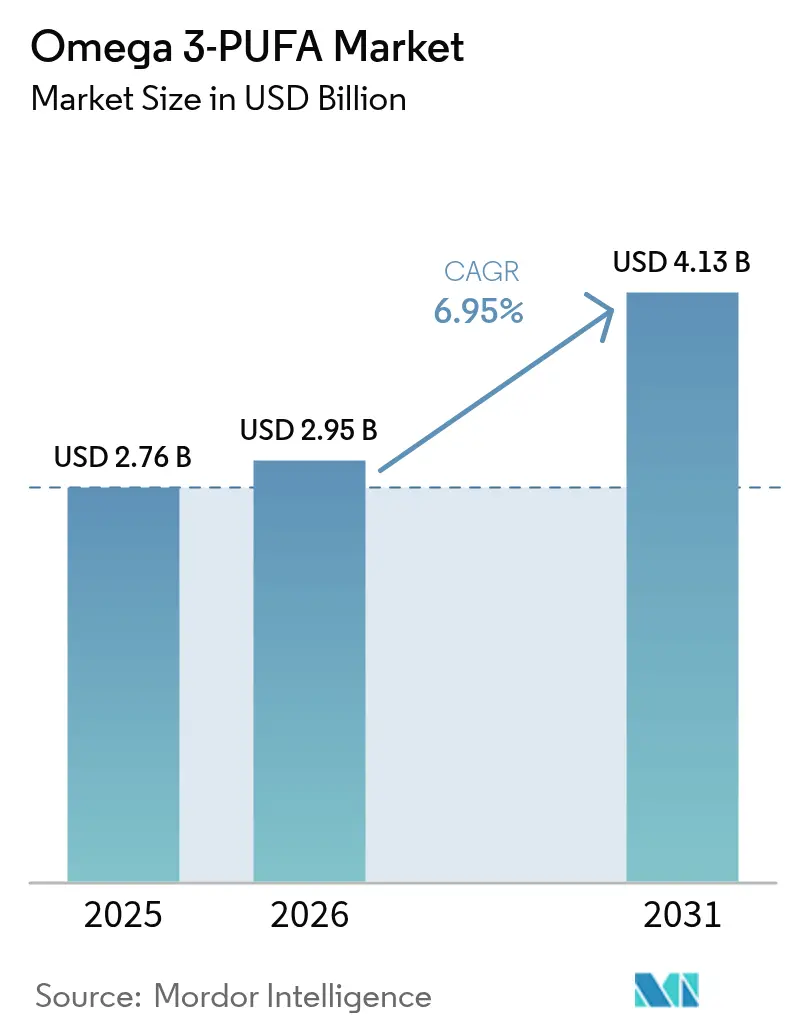
omega-3 PUFA market size in 2026 is estimated at USD 2.95 billion, growing from 2025 value of USD 2.76 billion with 2031 projections showing USD 4.13 billion, growing at 6.95% CAGR over 2026-2031. This growth is driven by increasing consumer awareness of the health benefits associated with omega-3 fatty acids, including their role in reducing inflammation and supporting overall well-being. Heightened concerns over cardiovascular and cognitive health, backed by expanding clinical evidence and favorable regulations, solidify consumer trust in omega-3 fortified products. While marine oils continue to dominate, there's a swift rise in plant-based alternatives, driven by sustainability considerations. Key economies, particularly China and the European Union, are modernizing regulations, hastening product development cycles and raising quality standards. Additionally, advancements in extraction technologies and the development of innovative delivery formats, such as gummies and soft gels, are further fueling market expansion.
Key Report Takeaways
- By product type, marine-derived ingredients led with 74.42% revenue share in 2025; plant-based sources are poised to expand at an 8.12% CAGR to 2031.
- By type, DHA accounted for 42.05% of the omega-3 PUFA market share in 2025, while the EPA segment is projected to grow at 7.82% CAGR through 2031.
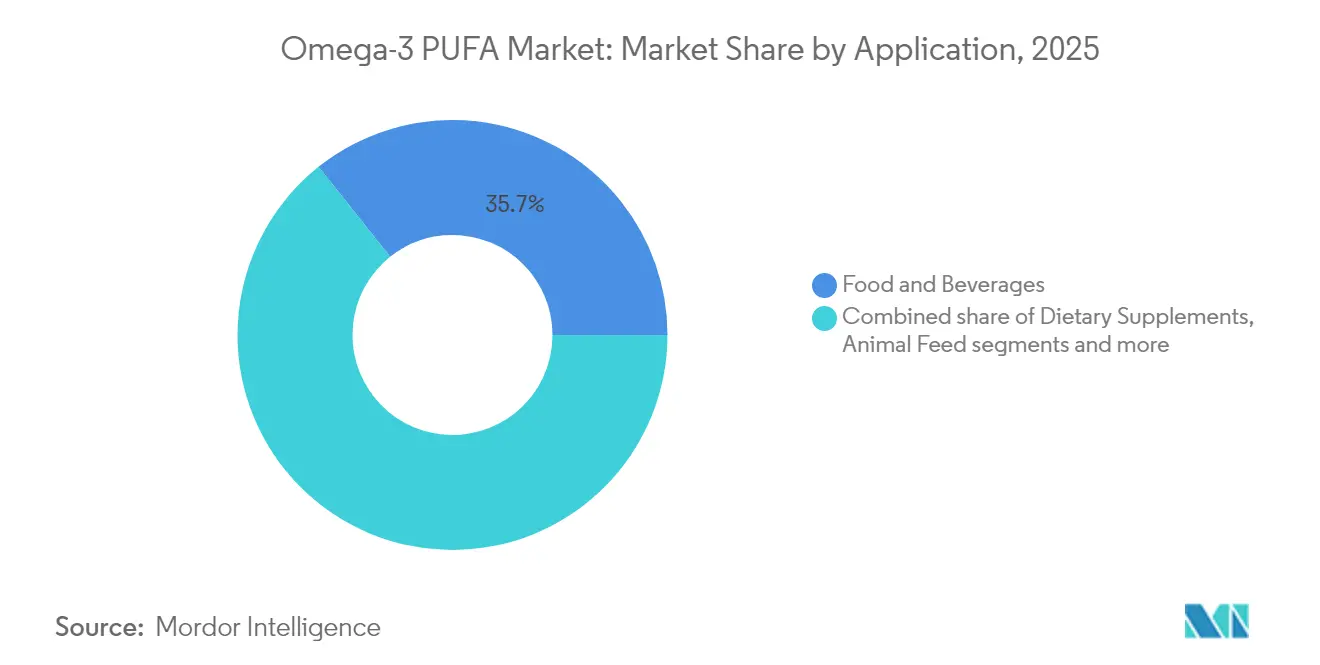
- By application, food and beverages contributed 35.71% of the omega-3 PUFA market size in 2025 and pharmaceuticals are advancing at a 7.65% CAGR.
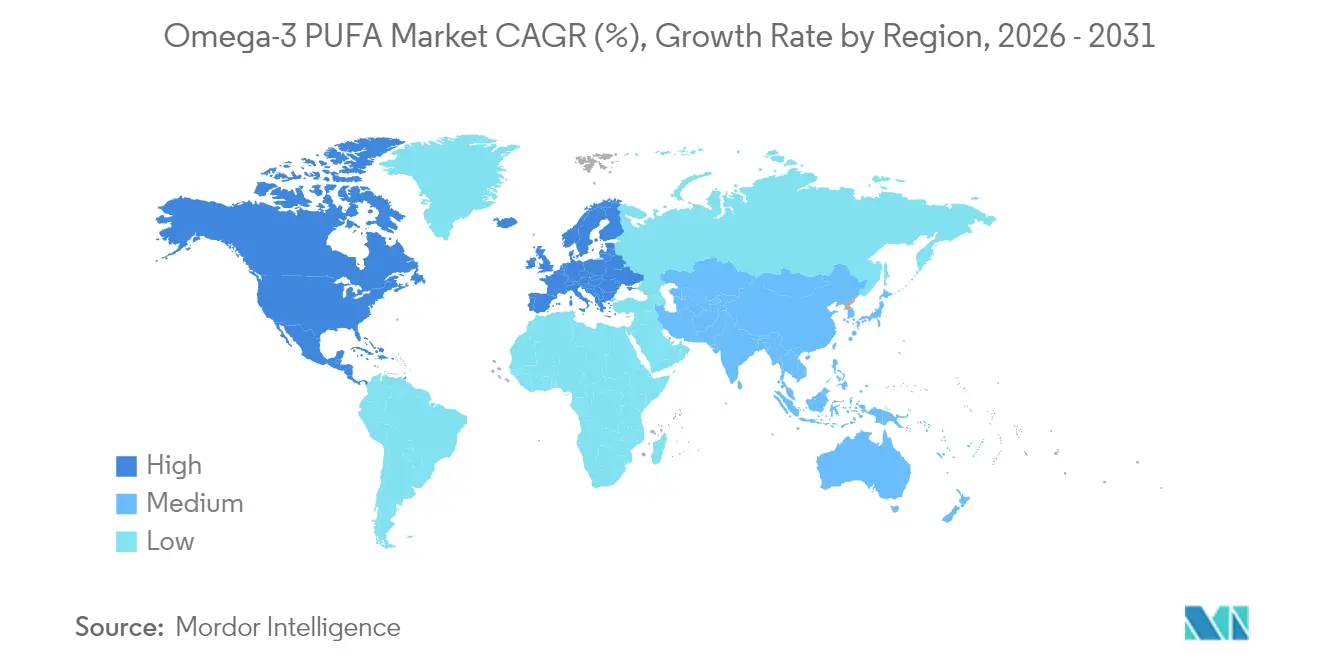
- By geography, North America captured 30.78% of the omega-3 PUFA market in 2025; Asia-Pacific is registering the fastest pace at 8.71% CAGR.
Note: Market size and forecast figures in this report are generated using Mordor Intelligence’s proprietary estimation framework, updated with the latest available data and insights as of 2026.
Market Trends and Insights
Drivers Impact Analysis of Omega 3-PUFA Market*
| Driver | (~) % Impact on CAGR Forecast | Geographic Relevance | Impact Timeline |
|---|---|---|---|
| Growth of Omega-3 Enriched Food and Beverage Products to Support Cardiovascular Health | +1.8% | Global, with early gains in North America, Europe | Medium term (2-4 years) |
| Rising Consumer shift Towards Preventive Healthcare | +1.5% | Global, particularly strong in Asia-Pacific, North America | Long term (≥ 4 years) |
| High Adoption in Dietary Supplements and Functional Nutrition | +1.2% | North America and Europe core, spill-over to Asia-Pacific | Short term (≤ 2 years) |
| Surge in Cognitive Health Supplement Among Aging Population | +1.0% | Global, concentrated in developed markets | Medium term (2-4 years) |
| Increased Application in Animal and Pet Feed | +0.8% | Global, with strong growth in Asia-Pacific aquaculture | Medium term (2-4 years) |
| Widespread Adoption in Functional Bakery and Dairy Products | +0.7% | Europe and North America, expanding to Asia-Pacific | Long term (≥ 4 years) |
| Source: Mordor Intelligence | |||
Growth of Omega-3 Enriched Food and Beverage Products to Support Cardiovascular Health
The increasing demand for omega-3-enriched food and beverage products is a significant driver of the global omega-3 PUFA market. These products are widely recognized for their role in supporting cardiovascular health, as omega-3 fatty acids help reduce triglyceride levels, lower blood pressure, and improve overall heart health. According to the American Heart Association (AHA), omega-3 fatty acids, particularly EPA and DHA, are essential for maintaining cardiovascular health and reducing the risk of heart disease[1]Source: American Heart Association, "Are you getting enough omega-3 fatty acids?", www.heart.org. Governments and health organizations worldwide are actively promoting the consumption of omega-3-rich diets. For instance, the Dietary Guidelines for Americans recommend regular consumption of seafood, a primary source of omega-3 fatty acids, to meet nutritional requirements. Furthermore, the European Food Safety Authority (EFSA) has approved health claims linking omega-3 fatty acids to heart health, further driving consumer awareness and demand for enriched products.
Rising Consumer Shift Towards Preventive Healthcare
Consumers are increasingly prioritizing preventive healthcare measures, which is fueling the market growth. Preventive healthcare focuses on maintaining health and preventing diseases rather than treating them after they occur. According to the World Health Organization (WHO), non-communicable diseases (NCDs), such as cardiovascular diseases and diabetes, account for 74% of all global deaths [2]Source: World Health Organization, "Noncommunicable diseases", www.who.int. This has led to a growing awareness among consumers about the importance of incorporating essential nutrients, like Omega-3 PUFAs, into their diets to reduce the risk of such conditions. Additionally, the U.S. Department of Health and Human Services highlights the role of Omega-3 fatty acids in supporting heart health and reducing inflammation, further encouraging their adoption. This shift in consumer behavior is expected to significantly contribute to the market's growth during the forecast period.
High Adoption in Dietary Supplements and Functional Nutrition
The market is experiencing significant growth, driven by the increasing adoption of dietary supplements and functional nutrition. Consumers are becoming more health-conscious, leading to a higher demand for omega-3 fatty acids, which are known for their numerous health benefits, including improved heart health, brain function, and reduced inflammation. According to the National Institutes of Health (NIH), omega-3 fatty acids are essential nutrients that play a crucial role in maintaining overall health. Additionally, the World Health Organization (WHO) emphasizes the importance of omega-3 intake in reducing the risk of chronic diseases. This growing awareness, coupled with the rising prevalence of lifestyle-related disorders such as cardiovascular diseases and obesity, is propelling the demand for omega-3 PUFA in dietary supplements and functional foods. These endorsements from credible organizations are encouraging consumers to incorporate omega-3 supplements and functional foods into their daily routines.
Surge in Cognitive Health Supplement Among Aging Population
The rising demand for cognitive health supplements among the aging population is a key driver of the market. With the global population aged 60 years and above projected to reach 2.1 billion by 2050, according to the World Health Organization [3]Source: World Health Organization, "Ageing and health", www.who.int, the need for products supporting brain health is increasing. Omega-3 PUFAs, particularly DHA (docosahexaenoic acid), are widely recognized for their role in maintaining cognitive function and reducing the risk of neurodegenerative diseases such as Alzheimer's. Furthermore, the National Institutes of Health (NIH) highlights the importance of Omega-3 fatty acids in supporting overall brain health, particularly in older adults. This growing awareness, coupled with the increasing prevalence of age-related cognitive decline, is driving the adoption of Omega-3 PUFA supplements. As the aging population continues to grow, the demand for cognitive health supplements, including Omega-3 PUFAs, is expected to rise significantly during the forecast period.
Restraints Impact Analysis of Omega 3-PUFA Market*
| Restraint | (~) % Impact on CAGR Forecast | Geographic Relevance | Impact Timeline |
|---|---|---|---|
| Unpleasant Odor and Taste in marine Derived Omega-3s | -1.2% | Global, particularly affecting consumer products | Short term (≤ 2 years) |
| Stringent Regulatory Approvals | -0.8% | Europe and North America, emerging in Asia-Pacific | Medium term (2-4 years) |
| Concern Regarding Overfishing and Marine Ecosystem Damage | -0.6% | Global, with regulatory focus in Europe and North America | Long term (≥ 4 years) |
| Complexity in Bioavailability and Absorption Among Different Types | -0.4% | Global, affecting all market segments | Medium term (2-4 years) |
| Source: Mordor Intelligence | |||
Unpleasant Odor and Taste in Marine Derived Omega-3s
The unpleasant odor and taste associated with marine-derived omega-3 products pose a significant challenge in the global omega-3 PUFA market. These sensory issues often result from the oxidation of omega-3 fatty acids, which can lead to a fishy smell and taste, making the products less appealing to consumers. This restraint impacts the adoption of omega-3 supplements, particularly among individuals sensitive to such sensory attributes. Manufacturers are investing in advanced encapsulation technologies and flavor-masking techniques to address this issue, but the challenge persists as a critical factor influencing consumer preferences and market growth. The taste and odor challenge creates market opportunities for algae-based alternatives, though marine sources maintain cost advantages and established supply chains that complicate rapid substitution across price-sensitive segments. Overcoming this restraint is essential for expanding the market penetration of marine-derived omega-3 products.
Stringent Regulatory Approvals
Stringent regulatory approvals act as a significant restraint in the market. The regulatory landscape for omega-3 PUFA products is becoming increasingly complex, with governments and regulatory bodies imposing rigorous standards to ensure product safety, efficacy, and quality. These regulations often require extensive clinical trials, detailed documentation, and compliance with strict labeling and manufacturing guidelines. Such requirements can lead to increased costs and extended timelines for product development and market entry, posing challenges for manufacturers. Furthermore, the approval process for omega-3 PUFA products varies significantly across regions, with each country or region having its own set of regulatory requirements. For instance, the European Union has stringent guidelines under the European Food Safety Authority (EFSA), while the United States Food and Drug Administration (FDA) mandates rigorous testing and approval processes. Overall, stringent regulatory approvals not only increase the operational burden on manufacturers but also create barriers to innovation and market expansion. These factors collectively hinder the growth potential of the omega-3 PUFA market during the forecast period.
*Our forecasts treat driver/restraint impacts as directional, not additive. The impact forecasts reflect baseline growth, mix effects, and variable interactions.
Omega 3-PUFA Market Segment Analysis
By Product Type:
Marine Dominance Faces Plant-Based DisruptionMarine-derived oils held a dominant 74.42% share of the omega-3 PUFA market in 2025. This dominance is attributed to their well-established supply chains, competitive cost structures, and high concentrations of EPA and DHA, which are critical for various health benefits. The market size for marine oils is expected to grow in line with the increasing global demand for omega-3 PUFAs. However, their relative market share is anticipated to decline as plant-based alternatives continue to gain traction, driven by shifting consumer preferences and sustainability concerns.
Plant-based omega-3 solutions are experiencing rapid growth, with a robust CAGR of 8.12%. This growth is fueled by the rising adoption of vegan lifestyles and increasing awareness of environmental sustainability. A notable development in this segment is DSM-Firmenich's introduction of life’sOMEGA, the first plant-based ingredient to deliver both EPA and DHA, effectively addressing a longstanding nutritional gap in the market. The innovation and expanding availability of plant-based alternatives are expected to significantly influence the competitive dynamics of the omega-3 PUFA market in the coming years.




By Type:
DHA Leadership Challenged by EPA’s Clinical MomentumIn 2025, DHA held a significant 42.05% share of the omega-3 PUFA market. This dominance is primarily driven by global mandates requiring the inclusion of DHA in infant formulas, which underscores its critical role in early childhood development. Decades of research have consistently highlighted DHA's importance in supporting cognitive health, particularly in brain and eye development. The increasing awareness of these benefits has led to a surge in demand for DHA-enriched products, not only in infant nutrition but also in dietary supplements and functional foods targeted at adults and the aging population.
EPA, on the other hand, is emerging as a key growth driver within the omega-3 PUFA market, registering an impressive CAGR of 7.82%. The rising prevalence of cardiovascular diseases globally has amplified the demand for EPA, as numerous randomized clinical trials have demonstrated its significant cardiovascular benefits, including reducing inflammation and improving heart health. EPA-focused products are increasingly gaining traction among health-conscious consumers, particularly those seeking targeted solutions for heart health and overall wellness. Additionally, the growing adoption of EPA in pharmaceutical formulations and its expanding applications in functional foods and beverages are expected to further drive its market growth.
By Application:
Food and Beverages Lead While Pharmaceuticals AccelerateIn 2025, food and beverage sales accounted for 35.71% of total sales, driven by manufacturers reformulating cereals, dairy products, and ready meals in response to the FDA's updated "healthy" definition. The reformulation efforts aim to align with consumer demand for healthier options, which has been further influenced by regulatory changes. This trend highlights the growing emphasis on nutritional value and transparency in the food and beverage market, positioning it as a significant contributor to the Omega-3 PUFA market's growth. Additionally, the incorporation of Omega-3 PUFA into functional foods and beverages, such as fortified juices, milk, and snacks, is gaining traction. This is driven by increasing consumer awareness of Omega-3's health benefits, including improved heart health, brain function, and overall wellness.
Meanwhile, the pharmaceutical sector is outpacing with a robust 7.65% CAGR. The sector's growth is fueled by the increasing adoption of Omega-3 PUFA in the development of drugs targeting cardiovascular health, mental well-being, and inflammatory conditions. The rising prevalence of chronic diseases, such as heart disease and arthritis, coupled with growing awareness of Omega-3's therapeutic benefits, is driving pharmaceutical manufacturers to integrate these fatty acids into their product portfolios. Furthermore, the pharmaceutical market is witnessing advancements in Omega-3 formulations, including prescription-grade products and innovative delivery systems, such as soft gels and capsules, to enhance bioavailability and patient compliance.
Geography Analysis
North America Omega 3-PUFA Market
In 2025, North America holds a dominant 30.78% share of the market, bolstered by its advanced regulatory frameworks, a well-entrenched culture of supplements, and a robust clinical research infrastructure that underscores the health benefits of omega-3s. The region enjoys a favorable market landscape, thanks to the FDA's progressive approach towards qualified health claims and its revised definition of "healthy" labeling, which now encompasses omega-3-rich foods. These regulatory advancements not only encourage product innovation but also enhance consumer confidence and adoption, creating a thriving environment for omega-3 products.
APAC Omega 3-PUFA Market
Meanwhile, the Asia-Pacific region is on a rapid ascent, projected to grow at a 8.71% CAGR through 2031. This surge is fueled by an uptick in health consciousness, a move towards regulatory harmonization, and a burgeoning middle class in pivotal markets. China's recent move to include DHA in its Health Food Raw Materials Directory, stipulating a daily intake limit of 200-1000mg for adults, underscores a maturing regulatory landscape that's poised to bolster market growth. Additionally, Japan and South Korea continue to lead with the highest global omega-3 index scores, reflecting their strong consumer awareness and established consumption patterns. In contrast, Chinese consumers are increasingly showing interest in fish oils, signaling a growing market potential despite their historically lower baseline consumption levels.
EMEA and South America Omega 3-PUFA Market
Europe is witnessing consistent growth, driven by initiatives centered on sustainability and the approval of novel foods. The EFSA's recent guidance updates have further smoothed the path for innovative omega-3 sources to enter the market. These measures align with the region's focus on environmental responsibility and consumer safety, ensuring steady market expansion. Meanwhile, South America and the Middle East and Africa are emerging as promising frontiers. In Brazil, ANVISA has rolled out updates to food supplement regulations, aimed at improving product standards and market accessibility. Similarly, Saudi Arabia is advancing its nutritional labeling standards, which could significantly enhance omega-3 market access and consumer awareness in the region. Both regions present untapped opportunities for growth, driven by evolving regulatory landscapes and increasing consumer interest in health and wellness products.

Regulatory Landscape
Regulatory oversight for omega-3 PUFA ingredients and finished products continues to depend on health-claim governance, safety assessments, and novel food pathways, with regional differences affecting commercialization timelines. In the United States, the FDA remains a central authority for dietary supplement and food compliance, including qualified health claims and labeling expectations that shape how EPA/DHA claims are presented in consumer-facing formats.
In Europe, the EU Novel Food framework under Regulation (EU) 2015/2283 is a primary route for authorizing algae-derived omega-3 ingredients, including oils from Schizochytrium sp. In January 2026, EFSA published updated scientific guidance for food additive submissions, raising the bar for dossier completeness and risk-assessment standardization. The UK continues to run a parallel, post-Brexit review process, including a February 2026 safety assessment covering a specification change for a Schizochytrium sp. oil rich in DHA and EPA. These changes support the need for dual-track regulatory strategies for suppliers operating across the EU and UK, and they increase emphasis on safety and quality documentation for novel and high-purity omega-3 inputs.
Value Chain Analysis
The omega-3 PUFA value chain covers raw-material origination (marine fisheries such as anchoveta, and microbial or algal fermentation, or oilseed-based feedstocks), primary processing (rendering, extraction, refining, concentration, deodorization), stability and quality management (oxidation control and contaminant monitoring), and downstream formulation into dietary supplements, functional foods, pharmaceuticals, and animal and pet feed. Brand owners and formulators differentiate through delivery formats (softgels, gummies, powders) and sensory performance, while global distribution typically depends on ingredient distributors and contract manufacturers that can meet documentation and traceability expectations.
Recent moves in the value chain focus on alternative sourcing and logistics to reduce volatility and expand route-to-market. Plant-based and algal pathways are being scaled through partnerships such as Nuseed Nutritional US Inc. working with KD Nutra (July 2024) and SourceOne Global Partners partnering with Qualitas Health (August 2024) to broaden access to microalgae-based omega-3 ingredients. Logistics and storage are also being professionalized for bulk algal oils, including Veramaris partnering with Merwetank B.V. to open a dedicated bulk storage facility in Dordrecht, Netherlands (November 2025). In parallel, regional commercialization continues through representation arrangements, including Sumitomo Corporation acting as exclusive agent in Japan for Huvepharma algae-derived DHA oil (January 2025).
Competitive Landscape
The omega-3 PUFA market is moderately fragmented, is characterized by a balanced dynamic created by established marine oil producers and emerging algae-based innovators. The market has witnessed significant strategic consolidations, which are reshaping its structure. For instance, Louis Dreyfus Company's acquisition of BASF's food and health ingredients business and KD Pharma Group's purchase of DSM-Firmenich's marine lipids operations, including the MEG-3 brand and production facilities in Peru and Canada, are notable examples. These acquisitions reflect a growing trend of vertical integration, enabling companies to secure control over their supply chains while expanding their geographic presence and technological capabilities.
Innovation plays a pivotal role in intensifying competition within the market. Companies are increasingly focusing on bioavailability enhancement technologies to improve the efficacy of omega-3 PUFA products. For example, advancements in microencapsulation techniques and emulsification processes are being adopted to enhance the absorption of omega-3 fatty acids in the human body. Additionally, sustainable sourcing initiatives are gaining traction, with companies exploring algae-based omega-3 production as an alternative to traditional fish oil. This shift not only addresses environmental concerns but also ensures a steady supply of raw materials, reducing dependency on marine resources.
Furthermore, the market is witnessing collaborations and partnerships aimed at driving innovation and expanding product portfolios. For instance, partnerships between biotechnology firms and omega-3 manufacturers are fostering the development of novel products tailored to specific consumer needs, such as vegan omega-3 supplements. The competitive landscape is also influenced by regional players who are leveraging local resources and expertise to cater to domestic demand. These dynamics collectively contribute to a vibrant and evolving market environment, where companies are striving to differentiate themselves through innovation, sustainability, and strategic growth initiatives.
Omega 3-PUFA Industry Leaders
-
Cargill, Incorporated
-
BASF SE
-
Archer Daniels Midland Company
-
DSM-Firmenich AG
-
Corbion N.V.
- *Disclaimer: Major Players sorted in no particular order

Omega 3-PUFA Market Companies Covered in this Report
- BASF SE
- DSM-Firmenich AG
- Cargill, Incorporated
- Archer Daniels Midland Company
- Corbion N.V.
- Croda International Plc
- Aker BioMarine AS
- Epax Norway AS
- KD Pharma Group
- Omega Protein Corporation
- Solutex GC
- Neptune Wellness Solutions Inc.
- Algarithm Ingredients Inc.
- Stepan Company
- Novotech Nutraceuticals
- Clover Corporation Limited
- Qualitas Health
- Nordic Naturals, Inc.
- Lonza Group
- Arista Industries, Inc.

Market Opportunities and Future Outlook
A key opportunity is scaling non-marine omega-3s (algal and other plant-based long-chain sources) to address sustainability concerns and reduce sensitivity to marine supply volatility, while still meeting sensory and formulation requirements across supplements, functional foods, and pet and animal nutrition. Investment activity also points to continued emphasis on higher-purity concentrates and tailored fatty-acid profiles. Naturmega launched a supercritical fluid fractionation facility in Barranquilla, Colombia (August 2025) to produce ultra-purified EPA and DHA concentrates, and Veramaris completed a USD 200 million algal oil production facility in Blair, Nebraska (May 2025), supporting larger land-based supply for fermented omega-3 oils.
Differentiation is also moving toward customized EPA:DHA ratios and higher-potency triglyceride formats that improve dosage efficiency and sensory performance across delivery systems. Examples include GC Rieber VivoMega launching Algae 1060 TG Premium (December 2025), a concentrated algal oil in natural triglyceride form with both EPA and DHA, and Veramaris introducing an algal oil product with a 1.5:1 EPA:DHA ratio (May 2026) to support aquafeed formulation targets. On the marine side, targeted fractionation and modification capacity remains a lever for value-added concentrates. Epax invested USD 10 million in Aalesund, Norway (February 2025) to add a synthesis plant for modifying marine oil fractions, supporting differentiated grades where regulatory and contaminant thresholds require tighter specifications.
Recent Industry Developments in Omega 3-PUFA Market
- April 2026: dsm-firmenich launched Veramaris O3 Max Pure at Petfood Forum 2026 as a fish oil replacement targeting pet food formulations. The introduction supports formulators seeking consistent omega-3 supply and improved sensory performance versus conventional marine oils, while reinforcing algae-based omega-3 as a scalable input for animal nutrition applications.
- August 2025: Naturmega launched a supercritical fluid fractionation facility in Barranquilla, Colombia to produce ultra-purified EPA and DHA concentrates. The commissioning expands regional capacity for high-purity omega-3 concentrates and strengthens supply options for markets requiring tighter contaminant control and higher potency inputs.
- December 2024: Louis Dreyfus Company completed the acquisition of BASF's food and health performance ingredients business. The deal broadened Louis Dreyfus Company's ingredient manufacturing and distribution footprint in nutrition-related portfolios, supporting wider access and integrated supply for omega-3 and adjacent health-ingredient value chains.


Omega 3-PUFA Market Report Scope and Research Methodology
Market Definition and Coverage
For this study, the omega-3 PUFA market is defined as the sales value of omega-3 polyunsaturated fatty acid ingredients and concentrates sold into end-use applications, regardless of whether they come from marine or plant sources.
Scope exclusions: We exclude retail value of finished consumer brands and count the ingredient value that flows into food and beverage, supplements, pharmaceuticals, animal feed, and other uses.
Segments Covered in This Report
-
By Product Type
- Plant
- Marine
-
By Type
- Docosahexanoic acid (DHA)
- Eicosapentanoic acid (EPA)
- Alpha-Linolenic Acid (ALA)
- Others
-
By Application
- Food and Beverages
- Dietary Supplements
- Pharmaceutical
- Animal Feed
- Others
-
By Geography
-
North America
- United States
- Canada
- Mexico
- Rest of North America
-
Europe
- Germany
- United Kingdom
- Italy
- France
- Spain
- Poland
- Rest of Europe
-
Asia-Pacific
- China
- India
- Japan
- Australia
- Rest of Asia-Pacific
-
South America
- Brazil
- Argentina
- Rest of South America
-
Middle East and Africa
- South Africa
- Saudi Arabia
- United Arab Emirates
- Rest of Middle East and Africa
-
North America
Data Sources, Market Sizing, and Validation
Desk Research
Desk work started with building a clean picture of supply and demand signals for omega-3 materials, including fishery output, oils and fats trade flows, and nutrition and health claims context. Public sources used as anchors included items such as FAO fisheries statistics, UN Comtrade trade codes for oils and fats, USDA food and nutrition references, EFSA opinions, and NIH Office of Dietary Supplements fact sheets.
To convert those signals into a usable market model, we also reviewed company annual reports, investor presentations, and product specification sheets for common omega-3 formats and concentration ranges. In a few places, paid subscriptions were used for company financials and intelligence, patent mapping, and shipment-level import and export checks when public reporting was not detailed enough. These desk sources are illustrative only, since many other references were used to collect data, validate assumptions, and clarify open questions during analysis.
Primary Interviews and Surveys
Primary work focused on interviews and surveys with ingredient suppliers, blenders, contract manufacturers, brand-side procurement, and application specialists across supplements, functional foods, pharma, and feed. Since pricing and concentration choices vary a lot by region and use case, we used these conversations to validate mix shifts (for example, EPA versus DHA focus) and to sanity check near-term pricing and availability assumptions across major consuming regions.
Distribution of primary research fieldwork respondents
| Company type | Respondent position | Region |
|---|---|---|
| Top tier: 28% | CXOs: 22% | APAC: 44% |
| Mid tier: 50% | Functional/Unit leaders: 27% | EMEA: 33% |
| Smaller Players: 22% | Managers: 51% | Americas: 23% |
Market-Sizing & Forecasting
Sizing was built using a top-down and bottom-up combination, where the demand pool was first reconstructed from application-level consumption patterns and then cross-checked with supply-side capacity and trade indicators. In practice, we started with end-use demand indicators such as supplement penetration, functional food fortification activity, infant nutrition usage, and aquafeed and pet nutrition inclusion rates, which are then translated into omega-3 ingredient demand using typical inclusion levels and concentration mixes.
To keep the numbers realistic, pricing was modeled using a blended ASP that reflects source mix (marine versus plant), concentration bands (high, medium, low), and the type mix across DHA, EPA, and ALA, with adjustments when primary feedback showed clear contract price resets. Bottom-up approximations were used selectively, such as rolling up a sampled set of supplier revenues, checking volume signals from import and export flows, and validating whether capacity utilization and input constraints could support the implied growth. When company-level disclosure was limited, gaps were handled by using peer ratios and application mix splits confirmed through interviews.
Forecasts were produced using scenario analysis, where base-case growth is linked to a small set of variables that experts could validate, including dietary supplement demand, regulatory acceptance of claims, fish oil supply stability, and relative pricing versus alternative oils. The scenarios were reviewed with industry participants to make sure short-term shocks and medium-term normalization paths were reflected in a simple, repeatable way.
Data Validation & Update Cycle
Estimates were checked using multiple passes, starting with range checks on volumes, ASPs, and implied per-capita intake by region, followed by variance checks across source, type, and application totals. If an outlier appeared, the assumption was traced back to the input, and clarifications were re-requested from relevant interviewees.
Before sign-off, the full model is reviewed by another analyst for logic consistency, unit integrity, and alignment with known market signals from trade and production data. Reports are refreshed annually, and interim updates are made when material events occur, such as sharp raw material price swings or major regulatory changes affecting claims. Right before delivery, a final pass is completed so clients receive the most current view available.
Mordor Intelligence's Omega 3 Pufa Market Sizing Compared With Other Published Estimates
Published market sizes for omega-3 PUFA do not always line up, even when the topic sounds identical, because studies often count different things and then apply different pricing and timing choices. The most common differences come from whether the number reflects ingredient-level sales or finished product retail value, how concentration and source mix are treated, and which year is used as the starting point for forecasts.
The table shows a wide spread between estimates, and in Mordor Intelligence's model the value is anchored to ingredient sales across food and beverage, dietary supplements, pharmaceuticals, animal feed, and other uses, with explicit type and concentration mixes applied instead of using a broad average price. When another publisher reports a smaller figure, it is often because the scope is closer to a narrower ingredient subset or a more conservative source set, and when a higher figure is shown it can come from mixing in downstream branded product value or applying different currency timing and price uplift assumptions.
Benchmark comparison
| Source | Market Size | Gaps in Research Methodology |
|---|---|---|
| Mordor Intelligence | USD 2.95 B (2026) | |
| Regional Consultancy A | USD 1.61 B (2024) | Uses a different base year and appears to apply a tighter definition of the addressable ingredient demand, which can undercount downstream pull from higher concentration products and some application channels. |
| Industry Bulletin B | USD 2.23 B (2024) | Focuses on an ingredients overview with mixed value and volume context, and differences in source coverage and price assumptions by year can shift the implied market value versus a concentration-mix based ASP approach. |
Across the three figures, the practical takeaway is that scope and price construction matter as much as growth rates. By tying totals to clear application demand drivers, concentration splits, and a blended ASP that can be rechecked, the resulting number stays easier to explain and update when new signals emerge.


Key Questions Answered in the Report
What is the projected size of the omega-3 PUFA market by 2031?
The omega-3 PUFA market is expected to reach USD 4.13 billion by 2031, supported by a 6.95% CAGR over 2026-2031.
Which product type currently dominates the omega-3 PUFA market?
Marine-derived oils lead with 74.42% share due to mature supply chains and high EPA/DHA concentrations.
Why are plant-based omega-3 sources growing faster than marine oils?
Plant sources offer sustainability advantages, meet vegan preferences, and alleviate overfishing concerns, resulting in an 8.12% CAGR through 2031.
Which region shows the highest growth rate for omega-3 products?
Asia-Pacific is expanding the fastest at 8.71% CAGR through 2031, driven by rising health awareness and supportive regulations.
What are the main restraints facing the omega-3 PUFA market?
Sensory issues with marine oils, stringent regulatory approvals, and ecosystem sustainability concerns are the key hurdles.
Page last updated on:


 Your data is secure and never sold or shared.


