Oman Fruits And Vegetables Market Size and Share
Oman Fruits And Vegetables Market Analysis by Mordor Intelligence
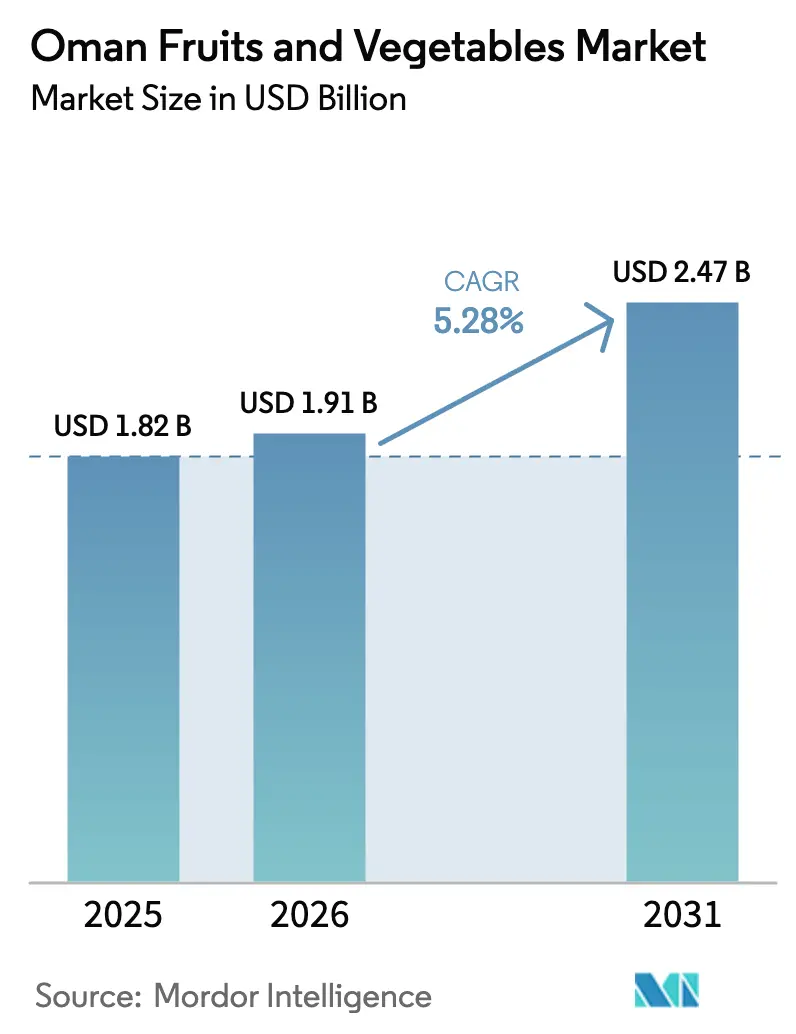
The Oman fruits and vegetables market was valued at USD 1.82 billion in 2025 and estimated to grow from USD 1.91 billion in 2026 to USD 2.47 billion by 2031, at a CAGR of 5.28% during the forecast period (2026-2031). Key drivers include policy initiatives under Vision 2040, the expansion of controlled-environment agriculture, and increasing export demand for residue-free produce. In 2024, a USD 950 million investment in greenhouse and cold-chain projects, led by Oman Food Investment Holding Company, is enhancing cost efficiency and ensuring year-round supply to modern retail channels. Advancements in digital crop monitoring, vertical farming, and cross-border e-commerce are improving yields, reducing order-to-delivery times, and increasing growers' profitability. However, challenges such as accelerating groundwater depletion, fluctuating fertilizer costs, and persistent gaps in cold-chain infrastructure remain significant, lowering the importance of margin management and water efficiency for industry stakeholders. Al Najd Agricultural City's masterplan allocates space for vertical farming, hydroponics, and aquaponics, with the first phase scheduled for completion in 2027. Driven by Vision 2040, greenhouse investments, and export demand, Oman’s agriculture sector is growing through digital innovation and vertical farming, despite groundwater depletion, fertilizer cost volatility, and challenges with cold-chain infrastructure.
Key Report Takeaways
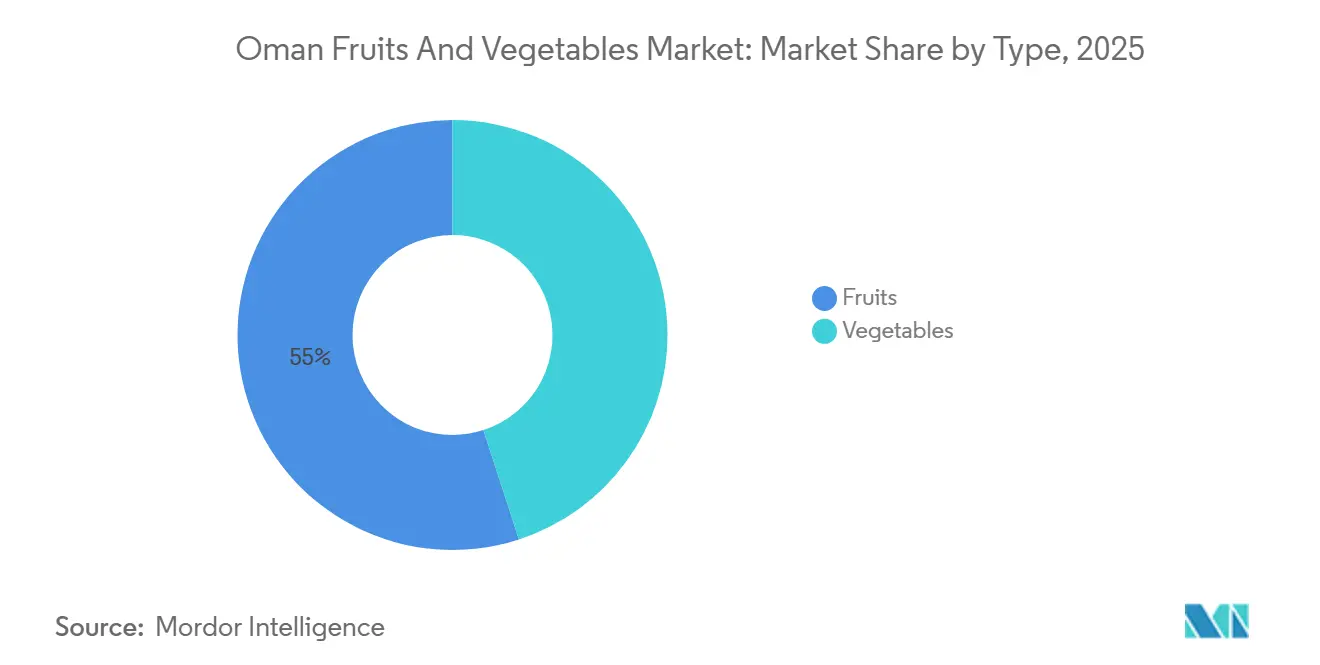
- By type, fruits led with a 55% value share of the Oman fruits and vegetables market in 2025, while vegetables are advancing at a 5.6% CAGR through 2031.
Note: Market size and forecast figures in this report are generated using Mordor Intelligence’s proprietary estimation framework, updated with the latest available data and insights as of January 2026.
Oman Fruits And Vegetables Market Trends and Insights
Drivers Impact Analysis*
| Driver | (~) % Impact on CAGR Forecast | Geographic Relevance | Impact Timeline |
|---|---|---|---|
| Government mandates to reach food-security targets by 2030 | +1.2% | Al Batinah, Dhofar, Musandam | Long term (≥ 4 years) |
| Rapid adoption of climate-controlled greenhouses and net-houses | +1.0% | Al Najd Agricultural City, OFIC clusters | Medium term (2-4 years) |
| Artificial-intelligence crop monitoring improving yield and quality | +0.6% | Early pilots in Muscat, Al Batinah, Dhofar | Medium term (2-4 years) |
| Rising demand for pesticide-free produce | +0.5% | National production for GCC (Gulf Cooperation Council) export markets | Short term (≤ 2 years) |
| Growth in cross-border electronic commerce for fresh commodities | +0.4% | Logistics hubs in Muscat and Salalah | Short term (≤ 2 years) |
| Investment inflows into vertical farming and hydroponics | +0.5% | Urban centers (Muscat, Salalah) | Medium term (2-4 years) |
| Source: Mordor Intelligence | |||
Government Mandates to Reach Food-Security Targets by 2030
Vision 2040 commits Oman to doubling horticulture output by 2030, a goal that calls for 15,000 additional cultivated hectares and a lift in average yields from 12 metric tons/hectare to 18 metric tons/hectare through precision irrigation and improved varieties. In 2025, the fund financed 13 projects worth OMR 2.4 million (USD 6.26 million) across various sectors, following a pattern of supporting high-value crops, greenhouse technologies, and sustainable practices in regions like Dhofar, which has seen a boost in local production[1]Source: Ministry of Agriculture, Fisheries and Water Resources, “Agricultural and Fisheries Development Fund Disbursements,” mafwr.gov.om. After decades of contraction, cultivated area edged up in 2024, driven by the installation of 1,200 net-house hectares in Al Batinah. Tariff subsidies within agri-clusters trim operating costs by up to 25%, allowing domestic tomatoes to finally price-match Indian imports. Yet, success depends on closing an annual deficit of 240 million cubic meters of groundwater that currently erodes half of the agronomic gains.
Rapid Adoption of Climate-Controlled Greenhouses and Net-Houses
In 2024, Oman Food Investment Holding Company has earmarked USD 950 million to roll out 200 hectares of sensor-rich greenhouses by 2028. Al Najd Agricultural City’s phase-one net-houses will ship 4,000 metric tons of capsicum, cherry tomatoes, and cucumbers to Lulu stores each year. Such systems stretch growing seasons by up to 120 days and cut water use by 40%, a critical factor given that irrigation already accounts for over 78% of national withdrawals. Gulf Mushroom Products Company showcased the model’s export potential, securing contracts with Carrefour UAE after adding 3 hectares of greenhouses in 2025. Low-interest agri-loans at the Development Bank and rising ISO 22000 adoption are drawing young entrepreneurs into 1-to-2-hectare ventures.
Artificial-Intelligence Crop Monitoring Improving Yield and Quality
The Million Date Trees program monitors stress in 21,000 palm trees across 15 governorates, identifying issues up to two weeks earlier than manual scouting. Sultan Qaboos University’s SAG (Smart Agriculture Cultivator)-1 platform lifted tomato yields by 12% and cut nitrogen 18% in 2025 trials. AI-guided shade-net deployment preserved 95% of date clusters during a 2025 heatwave, versus 70% in unmanaged groves. IoT (Internet of Things) rollouts on 50 demo farms provide dashboards for extension agents, though sensor costs of USD 1,200 per hectare still limit adoption to larger holdings. Early adopters recover investments within 18 months by combining water savings with premium pricing.
Rising Demand for Pesticide-Free Produce
Shoppers in GCC (Gulf Cooperation Council) countries are willing to pay 15-20% premiums for residue-free items, and organic dates now sell for USD 4.50 per kilogram in European specialty channels. Azadirachtin-based biopesticides, validated in 2024, give growers a locally produced option and lower chemical spending by 10%. Biological inputs grew 28% in 2025, while synthetic insecticide volumes fell 12%. Yet, three-year transition periods and annual audit costs of up to USD 5,000 put certification out of reach for many smallholders unless they join cooperatives.
Restraints Impact Analysis*
| Restraint | (~) % Impact on CAGR Forecast | Geographic Relevance | Impact Timeline |
|---|---|---|---|
| Chronic water scarcity leads to lower yield | −0.8% | National, acute in Al Batinah and Muscat | Long term (≥ 4 years) |
| Volatile energy and fertilizer prices pressuring farm margins | −0.5% | National, all commercial producers | Short term (≤ 2 years) |
| Trade disruptions and tariff swings in key import markets | −0.3% | Export-oriented date and pomegranate growers | Medium term (2-4 years) |
| Post-harvest losses caused by limited cold-chain | −0.6% | Rural Al Batinah, Dhofar, Musandam | Medium term (2-4 years) |
| Source: Mordor Intelligence | |||
Chronic water scarcity leads to lower yield
Groundwater levels are declining by 240 million cubic meters annually. In northern regions, 40% of farms use irrigation water with salinity levels exceeding 5 deciSiemens per meter, reducing tomato yields by up to 35%. Seawater intrusion has extended 2 km inland in Al Batinah, compelling farmers to shift to lower-value, salt-tolerant date crops. New farms are required to install drip irrigation systems and sensors, but the associated costs, ranging from USD 15,000 to 20,000 per hectare, exceed the budgets of 60% of farms smaller than 2 hectares. A desalination plant in Dhofar, with a capacity of 10,000 m³/day, produces water at USD 0.80 per m³, which is three times the cost of groundwater, restricting its use to high-value crops. Additionally, rising temperatures, projected to increase by 0.3 °C per decade, pose a threat to pollination as the frequency of days exceeding 45 °C continues to grow.
Volatile Energy and Fertilizer Prices Pressuring Farm Margins
Urea prices increased from USD 350 per metric ton in early 2024 to USD 480 per metric ton by the end of 2025, raising the share of fertilizer costs in greenhouse tomato production to over 20%. Agricultural electricity tariffs rose by 8% in 2025, adding USD 1,200 per hectare to climate-control costs. Diesel prices averaged USD 0.65 per liter in 2025, a 25% increase over the previous 2 years, placing additional financial pressure on open-field growers. Imported Indian tomatoes were priced at USD 0.45 per kilogram in 2025, undercutting domestic greenhouse tomatoes priced at USD 0.60 per kilogram, despite the latter benefiting from shorter supply chains. In response, growers adopted fertigation techniques, reducing nitrogen usage by 15%, and implemented solar-powered pumps, which lowered diesel costs by USD 2,500 annually but required an upfront investment of USD 8,000 per hectare. Access to these technological upgrades was primarily available to farms larger than 5 hectares or those participating in cooperative finance schemes.
*Our forecasts treat driver/restraint impacts as directional, not additive. The impact forecasts reflect baseline growth, mix effects, and variable interactions.
Segment Analysis
By Product Type: Fruits Anchor Value but Vegetables Accelerate
Fruits contributed 55% of the total value of the Oman fruits and vegetables market. Dates held a significant share, supported by the Million Date Trees initiative, which utilizes machine learning to optimize irrigation practices. Pomegranates experienced the highest growth driven by net-house cultivation in Al Najd and strong premium demand across the Gulf region. Bananas, primarily grown in Dhofar, ensured a year-round supply, while mangoes benefited from duty-free imports of its saplings. Other fruits, including lemons, watermelons, papayas, and grapes, completed the market portfolio, with hydroponic papaya pilot projects scaling up in 2025.
Vegetables are projected to reduce the gap by growing at a 5.6% CAGR through 2031, contributing to the overall growth of the Oman fruits and vegetables market. Tomatoes remain the leading vegetable, while capsicum is projected to grow rapidly as hotels increasingly sign annual greenhouse contracts. Onion volumes continue to rely heavily on imports, while cucumbers are gaining traction due to climate-controlled production in Al Najd. Cabbage is also growing in popularity, supported by the use of specialty substrate halls. The adoption of greenhouse technology, which enables multiple annual production cycles, positions vegetables as a key driver for enhancing domestic food security and diversifying exports.


Geography Analysis
In 2025, Al Batinah accounted for the highest share of the country's vegetable production, utilizing 15,000 hectares of irrigated land and benefiting from its proximity to Muscat's 1.6 million consumers. However, severe groundwater depletion of 120 million cubic meters annually and seawater intrusion have compelled 300 growers to either adopt salt-tolerant crop varieties or cease farming operations[3]Source: Ministry of Water Resources, “Desalination for Agriculture,” mwr.gov.om. This will help agricultural input providers, such as seed companies and crop protection chemical producers, deliver higher efficiency to farmers through new seed and crop protection products.
Dhofar is the country's province, mainly responsible for fruit shipments, supported by monsoon-driven moisture and a desalination plant with a capacity of 10,000 cubic metres/day, commissioned in 2025. This facility sustains 500 hectares of net-houses cultivating capsicum and pomegranates. Although Muscat represents only 10% of the nation's farm acreage, it hosts 60% of modern retail outlets and serves as the primary market for vertically farmed greens and organic dates.
Musandam and Al Buraimi experience post-harvest losses due to the lack of cold storage facilities. A USD 50 million fund is needed to establish new storage hubs by 2028, though financing terms remain unresolved. Al Najd Agricultural City, located 50 km south of Muscat, is set to add 200 hectares of greenhouses and vertical farms by 2027, reducing the capital's import dependency from 70% in 2025 to 50% by 2030. Additionally, 100,000 seedlings distributed nationwide in 2025 are being monitored by 15 research stations to assess survival rates and yield performance.
Moreover, in 2025, projects such as Al Buraimi’s 12 new agricultural projects and Oman’s Model Grape Farms Project in Ibra were launched and are anticipated to help the growth of the market by encouraging domestic and international players to be involved in cultivation of modern crops and grapes. These projects will help in the growth of cultivation of fruits and vegetables with new technology in the country and higher exports from Oman to other countries.
Competitive Landscape
The Oman fruits and vegetables market is fragmented, with the top five players projected to hold a major market share by 2025. Nakheel Oman leads the market by utilizing satellite-guided irrigation systems, achieving a 95% fruit-cluster survival rate during the 2025 heatwave. Lulu Group maintains a significant share due to its dual role as an importer and retailer, supported by its network of hypermarkets focused on fresh produce. Khazaen is another key player, leveraging its wholesale hub, though its limited regional distribution network restricts its reach.
Two distinct strategies are evident among market participants. Scale-focused companies, such as Gulf Mushroom Products, are expanding climate-controlled production capacity and securing export agreements within the GCC (Gulf Cooperation Council). Opportunities remain in areas such as organic certifications and last-mile logistics, as only 8% of farms are certified organic, and same-day delivery services are currently limited to Muscat and Salalah.
The market is anticipated to remain fragmented during the forecast period due to increasing investments in the fruits and vegetables industry. Numerous players are involved in cultivating and distributing various types of fruits and vegetables, driven by high export potential and significant domestic consumption. Players should also leverage the oman government's agricultural projects thant have been launched during 2025 to improve the cultivation area domestically and lower the dependence on the imports from other countries.
Recent Industry Developments
- September 2025: Oman’s Liwa market complements Al Buraimi’s 12 new agricultural projects on 287.9 acres, covering modern crop cultivation, livestock, and specialized ventures. By improving storage and distribution, Liwa helps reduce fruits and vegetables post-harvest losses and supports food security and efficient land use.
- April 2025: Oman’s Model Grape Farms Project in Ibra aims to boost local grape production to 250 metric tons annually across 72 acres, enhancing domestic supply and reducing import reliance. With modern irrigation, trellising, and quality seedlings, the initiative improves yield and fruit quality, opens new marketing channels, and supports rural livelihoods, contributing to the growth of Oman’s fresh fruits and vegetables market.
- December 2024: Oman strengthened its food security through initiatives boosting local production and storage, including large-scale facilities at Sohar Port and the Million Date Palm Plantation Project. These efforts improve year-round availability, stabilize prices, and enhance processing and distribution, directly supporting the fruits and vegetables market while reinforcing resilience against climate and global supply risks.


Oman Fruits And Vegetables Market Report Scope
The Oman Fruits and Vegetables Market Report is Segmented by Type (Fruits and Vegetables). The Report Includes Production (Volume), Consumption (Value and Volume), Import (Value and Volume), Export (Value and Volume), Wholesale Price Trend Analysis and Forecast, Seasonality Analysis, and End Use Applications and Industries. The Report Offers Market Size and Forecasts in Terms of Value (USD) and Volume (metric Tons).
| Fruits | Dates | Production Analysis | Production Volume | |
| Area Harvested & Yield | ||||
| Consumption Analysis (Value and Volume) | ||||
| Trade Analysis (Value and Volume) | Import Market Analysis | Import Value and Volume | ||
| Key Supplying Markets | ||||
| Export Market Analysis | Export Value and Volume | |||
| Key Destinations Markets | ||||
| Wholesale Price Trend Analysis and Forecast | ||||
| Seasonality Analysis | ||||
| Bananas | Production Analysis | Production Volume | ||
| Area Harvested & Yield | ||||
| Consumption Analysis (Value and Volume) | ||||
| Import Value and Volume | ||||
| Key Supplying Markets | ||||
| Export Value and Volume | ||||
| Key Destinations Markets | ||||
| Wholesale Price Trend Analysis and Forecast | ||||
| Seasonality Analysis | ||||
| Mangoes | Production Analysis | Production Volume | ||
| Area Harvested & Yield | ||||
| Consumption Analysis (Value and Volume) | ||||
| Import Value and Volume | ||||
| Key Supplying Markets | ||||
| Export Value and Volume | ||||
| Key Destinations Markets | ||||
| Wholesale Price Trend Analysis and Forecast | ||||
| Seasonality Analysis | ||||
| Watermelons | Production Analysis | Production Volume | ||
| Area Harvested & Yield | ||||
| Consumption Analysis (Value and Volume) | ||||
| Import Value and Volume | ||||
| Key Supplying Markets | ||||
| Export Value and Volume | ||||
| Key Destinations Markets | ||||
| Wholesale Price Trend Analysis and Forecast | ||||
| Seasonality Analysis | ||||
| Pomegranates | Production Analysis | Production Volume | ||
| Area Harvested & Yield | ||||
| Consumption Analysis (Value and Volume) | ||||
| Import Value and Volume | ||||
| Key Supplying Markets | ||||
| Export Value and Volume | ||||
| Key Destinations Markets | ||||
| Wholesale Price Trend Analysis and Forecast | ||||
| Seasonality Analysis | ||||
| Papaya | Production Analysis | Production Volume | ||
| Area Harvested & Yield | ||||
| Consumption Analysis (Value and Volume) | ||||
| Import Value and Volume | ||||
| Key Supplying Markets | ||||
| Export Value and Volume | ||||
| Key Destinations Markets | ||||
| Wholesale Price Trend Analysis and Forecast | ||||
| Seasonality Analysis | ||||
| Grapes | Production Analysis | Production Volume | ||
| Area Harvested & Yield | ||||
| Consumption Analysis (Value and Volume) | ||||
| Import Value and Volume | ||||
| Key Supplying Markets | ||||
| Export Value and Volume | ||||
| Key Destinations Markets | ||||
| Wholesale Price Trend Analysis and Forecast | ||||
| Seasonality Analysis | ||||
| Vegetables | Tomatoes | Production Analysis | Production Volume | |
| Area Harvested & Yield | ||||
| Consumption Analysis (Value and Volume) | ||||
| Import Value and Volume | ||||
| Key Supplying Markets | ||||
| Export Value and Volume | ||||
| Key Destinations Markets | ||||
| Wholesale Price Trend Analysis and Forecast | ||||
| Seasonality Analysis | ||||
| Cucumbers | Production Analysis | Production Volume | ||
| Area Harvested & Yield | ||||
| Consumption Analysis (Value and Volume) | ||||
| Import Value and Volume | ||||
| Key Supplying Markets | ||||
| Export Value and Volume | ||||
| Key Destinations Markets | ||||
| Wholesale Price Trend Analysis and Forecast | ||||
| Seasonality Analysis | ||||
| Eggplants | Production Analysis | Production Volume | ||
| Area Harvested & Yield | ||||
| Consumption Analysis (Value and Volume) | ||||
| Import Value and Volume | ||||
| Key Supplying Markets | ||||
| Export Value and Volume | ||||
| Key Destinations Markets | ||||
| Wholesale Price Trend Analysis and Forecast | ||||
| Seasonality Analysis | ||||
| Onions | Production Analysis | Production Volume | ||
| Area Harvested & Yield | ||||
| Consumption Analysis (Value and Volume) | ||||
| Import Value and Volume | ||||
| Key Supplying Markets | ||||
| Export Value and Volume | ||||
| Key Destinations Markets | ||||
| Wholesale Price Trend Analysis and Forecast | ||||
| Seasonality Analysis | ||||
| Potatoes | Production Analysis | Production Volume | ||
| Area Harvested & Yield | ||||
| Consumption Analysis (Value and Volume) | ||||
| Import Value and Volume | ||||
| Key Supplying Markets | ||||
| Export Value and Volume | ||||
| Key Destinations Markets | ||||
| Wholesale Price Trend Analysis and Forecast | ||||
| Seasonality Analysis | ||||
| Capsicum | Production Analysis | Production Volume | ||
| Area Harvested & Yield | ||||
| Consumption Analysis (Value and Volume) | ||||
| Import Value and Volume | ||||
| Key Supplying Markets | ||||
| Export Value and Volume | ||||
| Key Destinations Markets | ||||
| Wholesale Price Trend Analysis and Forecast | ||||
| Seasonality Analysis | ||||
| Cabbage | Production Analysis | Production Volume | ||
| Area Harvested & Yield | ||||
| Consumption Analysis (Value and Volume) | ||||
| Import Value and Volume | ||||
| Key Supplying Markets | ||||
| Export Value and Volume | ||||
| Key Destinations Markets | ||||
| Wholesale Price Trend Analysis and Forecast | ||||
| Seasonality Analysis | ||||
| Carrots | Production Analysis | Production Volume | ||
| Area Harvested & Yield | ||||
| Consumption Analysis (Value and Volume) | ||||
| Import Value and Volume | ||||
| Key Supplying Markets | ||||
| Export Value and Volume | ||||
| Key Destinations Markets | ||||
| Wholesale Price Trend Analysis and Forecast | ||||
| Seasonality Analysis | ||||
| By Type | Fruits | Dates | Production Analysis | Production Volume | |
| Area Harvested & Yield | |||||
| Consumption Analysis (Value and Volume) | |||||
| Trade Analysis (Value and Volume) | Import Market Analysis | Import Value and Volume | |||
| Key Supplying Markets | |||||
| Export Market Analysis | Export Value and Volume | ||||
| Key Destinations Markets | |||||
| Wholesale Price Trend Analysis and Forecast | |||||
| Seasonality Analysis | |||||
| Bananas | Production Analysis | Production Volume | |||
| Area Harvested & Yield | |||||
| Consumption Analysis (Value and Volume) | |||||
| Import Value and Volume | |||||
| Key Supplying Markets | |||||
| Export Value and Volume | |||||
| Key Destinations Markets | |||||
| Wholesale Price Trend Analysis and Forecast | |||||
| Seasonality Analysis | |||||
| Mangoes | Production Analysis | Production Volume | |||
| Area Harvested & Yield | |||||
| Consumption Analysis (Value and Volume) | |||||
| Import Value and Volume | |||||
| Key Supplying Markets | |||||
| Export Value and Volume | |||||
| Key Destinations Markets | |||||
| Wholesale Price Trend Analysis and Forecast | |||||
| Seasonality Analysis | |||||
| Watermelons | Production Analysis | Production Volume | |||
| Area Harvested & Yield | |||||
| Consumption Analysis (Value and Volume) | |||||
| Import Value and Volume | |||||
| Key Supplying Markets | |||||
| Export Value and Volume | |||||
| Key Destinations Markets | |||||
| Wholesale Price Trend Analysis and Forecast | |||||
| Seasonality Analysis | |||||
| Pomegranates | Production Analysis | Production Volume | |||
| Area Harvested & Yield | |||||
| Consumption Analysis (Value and Volume) | |||||
| Import Value and Volume | |||||
| Key Supplying Markets | |||||
| Export Value and Volume | |||||
| Key Destinations Markets | |||||
| Wholesale Price Trend Analysis and Forecast | |||||
| Seasonality Analysis | |||||
| Papaya | Production Analysis | Production Volume | |||
| Area Harvested & Yield | |||||
| Consumption Analysis (Value and Volume) | |||||
| Import Value and Volume | |||||
| Key Supplying Markets | |||||
| Export Value and Volume | |||||
| Key Destinations Markets | |||||
| Wholesale Price Trend Analysis and Forecast | |||||
| Seasonality Analysis | |||||
| Grapes | Production Analysis | Production Volume | |||
| Area Harvested & Yield | |||||
| Consumption Analysis (Value and Volume) | |||||
| Import Value and Volume | |||||
| Key Supplying Markets | |||||
| Export Value and Volume | |||||
| Key Destinations Markets | |||||
| Wholesale Price Trend Analysis and Forecast | |||||
| Seasonality Analysis | |||||
| Vegetables | Tomatoes | Production Analysis | Production Volume | ||
| Area Harvested & Yield | |||||
| Consumption Analysis (Value and Volume) | |||||
| Import Value and Volume | |||||
| Key Supplying Markets | |||||
| Export Value and Volume | |||||
| Key Destinations Markets | |||||
| Wholesale Price Trend Analysis and Forecast | |||||
| Seasonality Analysis | |||||
| Cucumbers | Production Analysis | Production Volume | |||
| Area Harvested & Yield | |||||
| Consumption Analysis (Value and Volume) | |||||
| Import Value and Volume | |||||
| Key Supplying Markets | |||||
| Export Value and Volume | |||||
| Key Destinations Markets | |||||
| Wholesale Price Trend Analysis and Forecast | |||||
| Seasonality Analysis | |||||
| Eggplants | Production Analysis | Production Volume | |||
| Area Harvested & Yield | |||||
| Consumption Analysis (Value and Volume) | |||||
| Import Value and Volume | |||||
| Key Supplying Markets | |||||
| Export Value and Volume | |||||
| Key Destinations Markets | |||||
| Wholesale Price Trend Analysis and Forecast | |||||
| Seasonality Analysis | |||||
| Onions | Production Analysis | Production Volume | |||
| Area Harvested & Yield | |||||
| Consumption Analysis (Value and Volume) | |||||
| Import Value and Volume | |||||
| Key Supplying Markets | |||||
| Export Value and Volume | |||||
| Key Destinations Markets | |||||
| Wholesale Price Trend Analysis and Forecast | |||||
| Seasonality Analysis | |||||
| Potatoes | Production Analysis | Production Volume | |||
| Area Harvested & Yield | |||||
| Consumption Analysis (Value and Volume) | |||||
| Import Value and Volume | |||||
| Key Supplying Markets | |||||
| Export Value and Volume | |||||
| Key Destinations Markets | |||||
| Wholesale Price Trend Analysis and Forecast | |||||
| Seasonality Analysis | |||||
| Capsicum | Production Analysis | Production Volume | |||
| Area Harvested & Yield | |||||
| Consumption Analysis (Value and Volume) | |||||
| Import Value and Volume | |||||
| Key Supplying Markets | |||||
| Export Value and Volume | |||||
| Key Destinations Markets | |||||
| Wholesale Price Trend Analysis and Forecast | |||||
| Seasonality Analysis | |||||
| Cabbage | Production Analysis | Production Volume | |||
| Area Harvested & Yield | |||||
| Consumption Analysis (Value and Volume) | |||||
| Import Value and Volume | |||||
| Key Supplying Markets | |||||
| Export Value and Volume | |||||
| Key Destinations Markets | |||||
| Wholesale Price Trend Analysis and Forecast | |||||
| Seasonality Analysis | |||||
| Carrots | Production Analysis | Production Volume | |||
| Area Harvested & Yield | |||||
| Consumption Analysis (Value and Volume) | |||||
| Import Value and Volume | |||||
| Key Supplying Markets | |||||
| Export Value and Volume | |||||
| Key Destinations Markets | |||||
| Wholesale Price Trend Analysis and Forecast | |||||
| Seasonality Analysis | |||||


Key Questions Answered in the Report
How big is the Oman fruits and vegetables market in 2026?
The market is valued just above USD 1.9 billion in 2026 and is tracking a 5.2% CAGR toward USD 2.47 billion by 2031.
Which vegetable segment is growing fastest?
Capsicum leads vegetables with a projected 6.8% CAGR due to greenhouse expansion and steady hotel demand.
What share do dates hold within fruits?
Dates account for 32.4% of fruit revenue, underpinned by the Million Date Trees initiative.
Why is cold-chain investment critical now?
Post-harvest losses near 30% because only one-quarter of shipments use reefers, new hubs could cut waste and lift margins.
Which technology offers the quickest payback for growers?
Solar-powered irrigation pumps save about USD 2,500 per year, recovering costs in three years for medium-size farms.
Page last updated on:


