Market Overview
| Study Period | 2020 - 2031 |
|---|---|
| Market Size (2026) | USD 3.26 Billion |
| Market Size (2031) | USD 4.16 Billion |
| Growth Rate (2026 - 2031) | 5.04% CAGR |
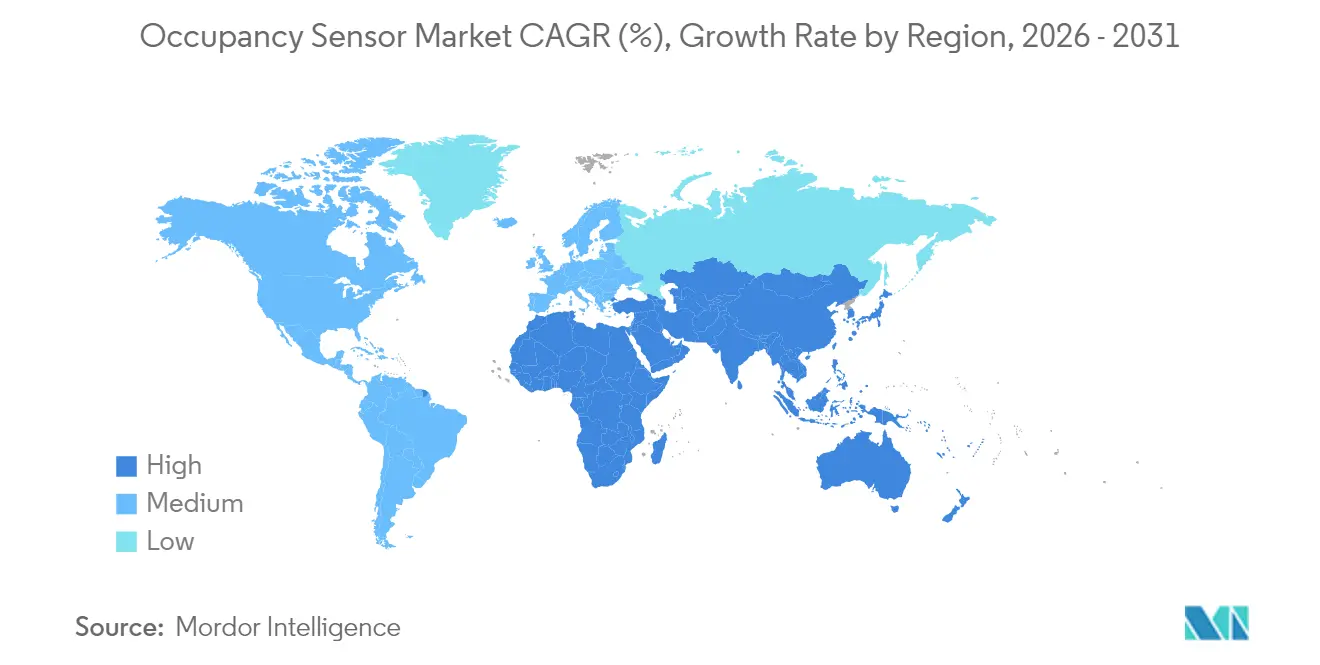
| Fastest Growing Market | Asia Pacific |
| Largest Market | North America |
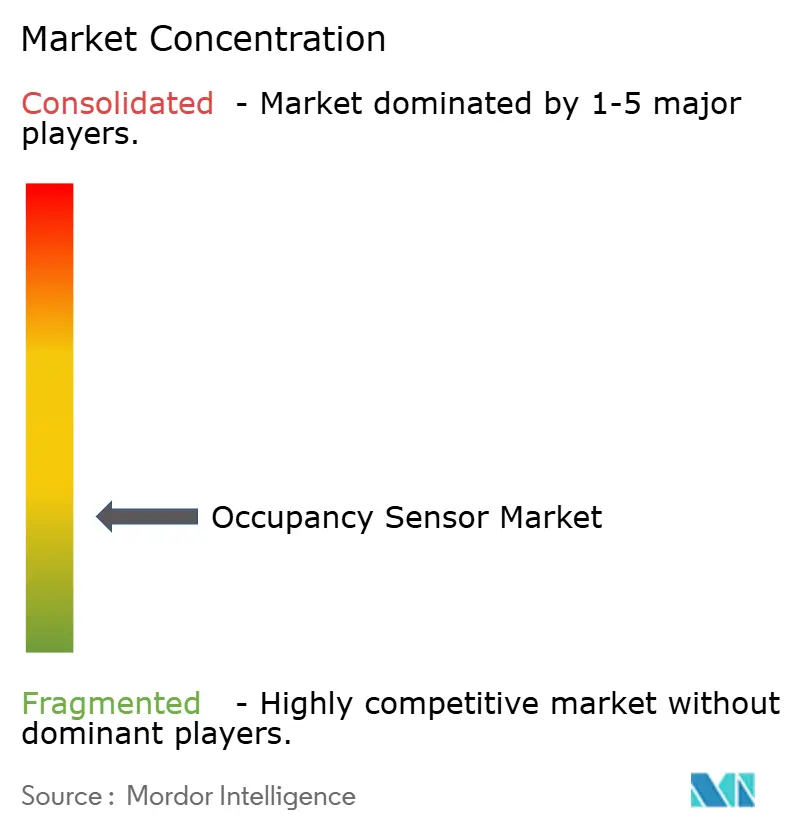
| Market Concentration | Low |
Major Players *Disclaimer: Major Players sorted in no particular order Image © Mordor Intelligence. Reuse requires attribution under CC BY 4.0. | |
Occupancy Sensor Market Analysis by Mordor Intelligence
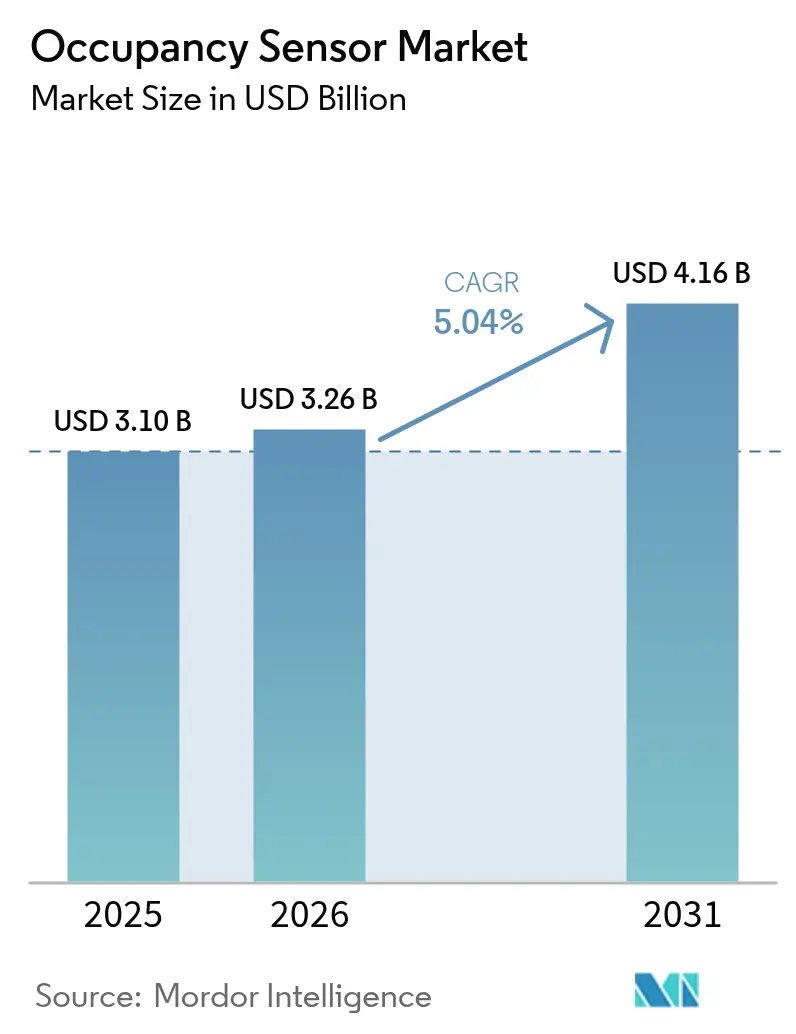
The Occupancy Sensor Market size was valued at USD 3.10 billion in 2025 and estimated to grow from USD 3.26 billion in 2026 to reach USD 4.16 billion by 2031, at a CAGR of 5.04% during the forecast period (2026-2031).
Stricter net-zero building codes in the United States and European Union, China’s dual-carbon roadmap, and expanding healthcare compliance programs are turning occupancy detection from a discretionary energy-savings measure into a legal requirement f-t.com. Corporate demand has shifted from trial deployments to systematic roll-outs that integrate sensors with building management platforms. Commercial property owners now prioritize data analytics that optimize space utilization and HVAC loads, while residential adoption gains pace as smart homes become mainstream. Technology convergence is visible: wired networks still command 62% of deployments for reliability, yet wireless nodes are advancing at a 12.4% CAGR as mesh protocols mature.
Key Report Takeaways
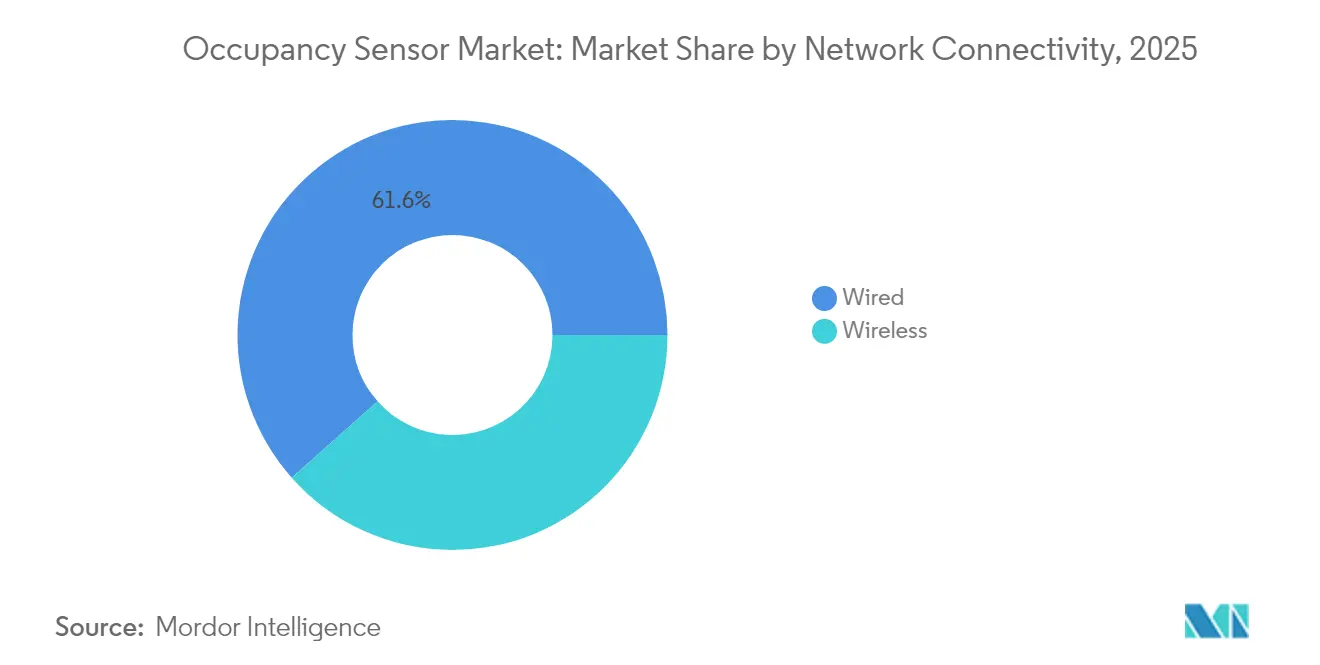
- By network connectivity, the wired segment led with 61.55% of the occupancy sensor market share in 2025, whereas wireless nodes are set to expand at a 12.18% CAGR through 2031.
- By technology, passive infrared retained 49.72% revenue share in 2025; dual/multi-technology sensors are forecast to post a 13.12% CAGR to 2031.
- By mounting type, ceiling-mounted units captured 44.55% of the occupancy sensor market size in 2025, while desk-integrated designs record the fastest 14.58% CAGR to 2031.
- By installation, retrofits accounted for 54.35% of deployments in 2025; new construction grows at 12.93% CAGR through 2031.
- By building type, commercial facilities held 59.25% of the occupancy sensor market share in 2025, while residential demand rises at 12.55% CAGR to 2031.
- By application, lighting control dominated with 45.40% share in 2025; HVAC and ventilation control advance at 13.88% CAGR.
- Johnson Controls, Signify, Honeywell, and Schneider Electric collectively controlled about 29.45% of 2025 global revenues, reflecting a moderately concentrated field.
Note: Market size and forecast figures in this report are generated using Mordor Intelligence’s proprietary estimation framework, updated with the latest available data and insights as of 2026.
Global Occupancy Sensor Market Trends and Insights
Drivers Impact Analysis*
| DRIVER | (~) % IMPACT ON CAGR FORECAST | GEOGRAPHIC RELEVANCE | IMPACT TIMELINE |
|---|---|---|---|
| Stricter Net-Zero Building Codes in U.S./EU Mandating Occupancy‐Based Shut-off | +1.2% | North America & EU | Medium term (2-4 years) |
| China "Dual-Carbon" Roadmap Boosting Smart Lighting IoT | +0.8% | APAC core, spill-over to MEA | Long term (≥ 4 years) |
| IoT-Driven Space Utilization Analytics Upselling Sensors | +0.7% | Global | Short term (≤ 2 years) |
| Healthcare Bed-Occupancy Programs Under CMS & MDR | +0.5% | North America & EU | Medium term (2-4 years) |
| Multi-Sensor Chipset Cost Decline Opening HVAC OEM Channel | +0.6% | Global | Short term (≤ 2 years) |
| AI-Enhanced Sensor Integration for Predictive Building Analytics | +0.4% | Global | Long term (≥ 4 years) |
| Source: Mordor Intelligence | |||
Stricter net-zero building codes in U.S./EU mandating occupancy-based shut-off
California’s Title 24 now requires occupancy sensing for receptacle and ventilation shut-off within 20 minutes of vacancy, while the 2021 International Energy Conservation Code mandates automatic controls in enclosed spaces. European renovation programs targeting 35 million buildings by 2030 echo these rules, making compliance rather than energy savings the primary adoption trigger. Commercial owners therefore embed sensors in construction documents rather than adding them post-build. This dynamic lifts baseline demand across the occupancy sensor market.[1] Energy Code Ace, “SECTION 120.1 – Requirements for Ventilation and Indoor Air Quality,” energycodeace.com
China dual-carbon roadmap boosting smart lighting IoT
China’s goal of a 2030 carbon peak and 2060 neutrality propels smart building retrofits that favor sensor-based automation. Case studies in public institutions show energy savings above 20% after IoT lighting overhauls that rely on motion detection. Provincial disparity means turnkey packages that combine hardware and software succeed better than component sales, especially in tier-1 cities where budgets and technical skills align.[2]MDPI, “Digital Intelligence Transformation of Energy Conservation Management in China's Public Institutions,” mdpi.com
IoT-driven space utilization analytics upselling sensors
Vendors now position detectors as data endpoints that feed dashboards for real-time occupancy analytics. Schneider Electric’s SpaceLogic Touchscreen Room Controller couples sensor data with AI algorithms, cutting HVAC energy by up to 35% and maintenance costs by 25%. Hybrid work trends make granular seat-level data valuable for rightsizing corporate real estate portfolios, adding a revenue motivation that accelerates refresh cycles within the occupancy sensor market.
Healthcare bed-occupancy programs under CMS & MDR
The U.S. Acute Hospital Care at Home program, covering 328 hospitals and 23,000 discharges by April 2024, incentivizes remote patient monitoring with integrated bed-occupancy detection. European MDR alignment standardizes performance thresholds, lowering procurement risk for hospital administrators and opening a new vertical beyond lighting and HVAC automation.
Restraints Impact Analysis*
| RESTRAINTS | (~) % IMPACT ON CAGR FORECAST | GEOGRAPHIC RELEVANCE | IMPACT TIMELINE |
|---|---|---|---|
| RF congestion & battery drain in 2.4 GHz mesh networks | -0.4% | Global | Short term (≤ 2 years) |
| False-positive events in high-heat data centers | -0.3% | Global | Medium term (2-4 years) |
| Fragmented wireless standards hindering EU retrofits | -0.2% | Europe | Medium term (2-4 years) |
| GDPR/CCPA compliance cost for AI people analytics | -0.3% | North America & EU | Long term (≥ 4 years) |
| Source: Mordor Intelligence | |||
RF congestion & battery drain in 2.4 GHz mesh networks
Zigbee networks carrying 192 nodes keep sub-200 ms latency under clean radio conditions, yet packet loss rises sharply when Wi-Fi channels overlap. Frequent retransmits shorten coin-cell lifespan, raising maintenance costs for battery-powered devices. Building owners therefore hesitate to shift critical loads to wireless unless spectrum planning tools are in place.
False-positive events in high-heat data centers
Equipment heat signatures mislead passive infrared detectors, causing unnecessary HVAC cycling in AI compute halls. mmWave radar offers higher precision but faces reflections from metallic racks, forcing multi-sensor fusion that lifts bill-of-materials costs. For operators focused on power usage effectiveness, these false positives dampen the business case.
*Our forecasts treat driver/restraint impacts as directional, not additive. The impact forecasts reflect baseline growth, mix effects, and variable interactions.
Segment Analysis
By Network Connectivity: Reliability Sustains Wired Dominance
The wired category accounted for 61.55% of global 2025 revenues, confirming its central role in core building systems within the occupancy sensor market. Facility managers value immunity to radio interference and easier power delivery, so Ethernet-based digital addressable networks anchor lighting and HVAC controls in new commercial construction. Retrofit environments with limited conduit space lean toward wireless nodes that reduce installation labor, which explains the 12.18% CAGR forecast for mesh-based products through 2031. Hybrid designs are emerging: a wired backbone feeds PoE luminaires while Thread or Zigbee sensors populate the periphery, balancing reliability and flexibility.
Wireless growth is driven by protocol convergence. Matter-over-Thread eliminates prior vendor lock-in, and vendors like Aqara released presence sensors that self-commission across Apple, Amazon, and Google ecosystems. Philips Hue demonstrated a software update that lets light bulbs double as motion sensors, hinting at an architecture where every luminaire becomes a data node. This blurs the lines between connectivity classes and broadens addressable installations for the


By Technology: Sensor Fusion Elevates Accuracy
Passive infrared achieved a 49.72% share in 2025, reinforcing its cost advantage inside the occupancy sensor market. Demand for higher fidelity propels dual-technology modules at a 13.12% CAGR, combining PIR with ultrasonic or mmWave radar to catch minor movements and stationary occupants. Texas Instruments’ AWRL6844 radar lowers per-node cost by USD 20, expanding adoption beyond premium installations.
AI-enabled edge processing reduces nuisance alarms by learning site-specific occupancy patterns. Bosch Sensortec targets 10 billion intelligent sensors by 2030, with 90% embedding AI engines that distill raw waveforms on-chip. These developments increase bill-of-material value and reinforce platform stickiness inside the occupancy sensor market.
By Mounting Type: Aesthetics and Coverage Shape Decisions
Ceiling installations held 44.55% share in 2025 because they deliver 360-degree coverage while blending with luminaires, a critical factor for specifiers focused on interior design. Ceiling nodes also simplify wiring by piggybacking on lighting circuits. Desk-level sensors are gaining traction at a 14.58% CAGR as companies seek seat-level occupancy analytics to manage hybrid work. Wall-mounted devices stay common in retrofits that lack plenum access, whereas in-fixture models grow through partnerships between lighting OEMs and sensor vendors.
Lutron’s embedded fixture platform removes control wiring, lowering copper use while enabling distributed wireless control that aligns with sustainability goals. Acuity Brands’ RESENSE Move ceiling sensor merges motion detection with Bluetooth beacons for workplace services, widening revenue opportunities beyond energy savings
By Installation Type: Retrofit Volume Meets New-Build Sophistication
Retrofit projects supplied 54.35% of 2025 revenues, reflecting the vast existing stock of inefficient buildings the occupancy sensor market must address. However, these projects contend with asbestos ceilings, mixed voltage, and outdated BMS protocols, often limiting sensor density. New construction is set to grow 12.93% CAGR thanks to codes that mandate smart controls during design phases. Builders pre-wire PoE networks, allowing higher sensor counts that feed digital twins and AI analytics from day one.
California’s Title 24 treats sensors as baseline features, integrating them into spec schedules rather than change orders. European developers also embed sensors early to claim green building certifications, reducing lifecycle cost and boosting the occupancy sensor market size for new projects.
By Building Type: Commercial Core, Residential Upswing
Commercial properties generated 59.25% of 2025 demand. Office owners pursue net-zero targets and employee wellness, justifying upgrades to AI-driven sensing suites. Warehouses adopt mmWave arrays for safety interlocks and forklift navigation. The residential segment, while smaller, is climbing at a 12.55% CAGR as smart speakers normalize connected-home expectations. Healthcare facilities add a new pull, driven by CMS reimbursements for remote monitoring.
Mixed-use towers now combine hotel, retail, and apartments, requiring scalable platforms that tailor sensing logic per zone. Vendors that supply API-centric solutions can therefore capture multiple verticals with a single SKU, enlarging their total addressable occupancy sensor market.

By Application: Lighting Control Cedes Growth to HVAC Intelligence
Lighting control still commanded 45.40% of 2025 revenue because payback remains visible and near-term. HVAC and ventilation, however, grow at 13.88% CAGR because CO₂-aware occupancies unlock deeper energy savings. Cisco and Schneider Electric co-created a system that ingests live occupancy counts to trim air-handling loads, showing 35% energy reduction in pilot sites.
People-count analytics now sit atop raw detection data to inform cleaning schedules and lease planning. Security integration is also expanding as access control firms ingest occupancy streams to refine threat detection. The application hierarchy is shifting from single-purpose motion triggers to multiservice data layers, a trend that keeps expanding the occupancy sensor market.
Geography Analysis
North America held the largest revenue share in 2025. The United States anchors demand with Title 24 and the 2021 IECC requiring automated shut-off across commercial spaces. Canada follows similar patterns and shows strong interest in occupancy-based heating due to long heating seasons. Ongoing retrofits contend with dense 2.4 GHz spectrum in urban cores, driving hybrid deployments that mix wired backbones and sub-GHz wireless.
Europe registers solid growth under the Renovation Wave program that targets 35 million buildings by 2030. Germany, the United Kingdom, and France institute national building codes that embed occupancy-triggered lighting and ventilation cut-offs. GDPR compliance adds cost and slows AI analytics roll-outs, yet platform vendors that offer on-premise data processing mitigate these barriers. Fragmented wireless protocols force integrators to rely on multiprotocol gateways, elevating system complexity but also boosting services revenue inside the occupancy sensor market.
Asia-Pacific records the fastest CAGR to 2031. China’s dual-carbon policy accelerates smart building mandates, especially in tier-1 metros where public-sector projects showcase 20% energy reduction after sensor installations. Japan and South Korea emphasize premium solutions that pair mmWave with AI for comfort optimization. In India and Southeast Asia, cost-efficient PIR nodes dominate, yet commercial office parks in Bengaluru and Singapore adopt platform architectures that align with global corporate ESG goals. This heterogeneity offers multi-tiered entry points for vendors across the occupancy sensor market.

Competitive Landscape
Competition remains moderate. Signify leverages its Interact platform, bundling sensor-equipped luminaires for plug-and-play retrofits. Schneider Electric’s portfolio integrates SpaceLogic controllers with EcoStruxure software, offering end-to-end coverage from sensor to cloud. Honeywell excels in large-campus deployments by combining security, HVAC, and lighting under the Honeywell Forge analytics layer. Johnson Controls capitalizes on a USD 12.6 billion backlog, integrating sensors with the OpenBlue digital twin to offer predictive maintenance and visitor analytics.
Emerging players target specialized use cases. Origin Wireless AI uses Wi-Fi signal perturbations to deliver 99.9% detection accuracy without dedicated hardware, lowering BOM cost. Butlr Technologies employs thermal-pixel sensors for anonymous people tracking and secured funding via Ricoh to scale its workplace analytics service. Semiconductor suppliers such as Infineon and NXP push reference designs that accelerate time-to-market for OEMs, tightening timeframes for competitive differentiation.
Strategic themes center on AI, cybersecurity, and open APIs. Vendors that can combine heterogeneous sensor data streams, secure them under SOC 2 frameworks, and expose analytics via RESTful services are winning multi-year master service agreements. The occupancy sensor market therefore rewards platform depth and ecosystem partnerships rather than standalone hardware price wars.
Occupancy Sensor Industry Leaders
Signify (Philips Lighting)
Honeywell International
Schneider Electric
Johnson Controls
Acuity Brands, Inc.
- *Disclaimer: Major Players sorted in no particular order

Recent Industry Developments
- April 2025: Johnson Controls announced IQ Panel 4 family support by PowerManage service management platform, simplifying installation and data management for smart home security systems with advanced Bluetooth disarming capabilities and enhanced cybersecurity through localized data storage.
- February 2025: Schneider Electric launched SpaceLogic Touchscreen Room Controller with AI-driven HVAC optimization, achieving energy savings up to 35% and maintenance cost reductions of 25% through integrated occupancy sensing and environmental controls.
- January 2025: Texas Instruments introduced AWRL6844 60GHz mmWave radar sensor for automotive in-cabin sensing, achieving 98% occupancy detection accuracy and reducing implementation costs by USD 20 per vehicle while meeting 2025 Euro NCAP safety requirements.
- January 2025: Ricoh and Butlr Technologies formed capital and business alliance through RICOH Innovation Fund to enhance workplace experiences using scalable people-sensing data infrastructure that utilizes body heat for human presence detection.


Global Occupancy Sensor Market Report Scope
The scope of the report covers the segments such as network type (Wired and Wireless), technology (Ultrasonic, Passive Infrared, and Microwave), building type (residential and Commercial), and application (Lighting Control, HVAC, and Security and Surveillance), and geography. An occupancy sensor is used to save energy, comply with building codes, provide automatic control, and various other such applications. One of the most widely used technologies among the occupancy sensors is passive infrared, which detects occupancy within a specific field and activates lighting, and is extremely useful in small spaces.
Moreover, the advent of advanced occupancy sensors, such as micro-phonics, intelligent occupancy sensors, image processing occupancy sensors, and the new vision-based intelligent occupancy sensor, for HVAC systems is fueling the growth of the occupancy sensor market.
By Network Connectivity
| Wired | |
| Wireless | Wi-Fi |
| Zigbee | |
| Z-Wave |
By Technology
| Passive Infrared (PIR) |
| Ultrasonic |
| Microwave |
| Dual / Multi-Technology (PIR + mmWave, etc.) |
| mmWave / FMCW Radar |
By Mounting Type
| Ceiling-Mounted |
| Wall-Mounted |
| Desk / Furniture-Integrated |
| In-Fixture / Embedded Luminaire |
By Installation Type
| Retrofit |
| New Construction |
By Building Type
| Residential |
| Commercial |
| Industrial and Warehousing |
| Healthcare and Assisted Living |
| Government and Education |
By Application
| Lighting Control |
| HVAC and Ventilation |
| Security and Surveillance |
| People Counting and Space Utilization |
| Bed / Restroom Occupancy Monitoring |
By Geography
| North America | United States |
| Canada | |
| Mexico | |
| South America | Brazil |
| Argentina | |
| Rest of South America | |
| Europe | United Kingdom |
| Germany | |
| France | |
| Italy | |
| Nordics (Sweden, Norway, Denmark, Finland) | |
| Rest of Europe | |
| Middle East | Saudi Arabia |
| UAE | |
| Turkey | |
| Rest of Middle East | |
| Africa | South Africa |
| Nigeria | |
| Rest of Africa | |
| Asia-Pacific | China |
| Japan | |
| India | |
| South Korea | |
| Australia | |
| Rest of Asia-Pacific |
| By Network Connectivity | Wired | |
| Wireless | Wi-Fi | |
| Zigbee | ||
| Z-Wave | ||
| By Technology | Passive Infrared (PIR) | |
| Ultrasonic | ||
| Microwave | ||
| Dual / Multi-Technology (PIR + mmWave, etc.) | ||
| mmWave / FMCW Radar | ||
| By Mounting Type | Ceiling-Mounted | |
| Wall-Mounted | ||
| Desk / Furniture-Integrated | ||
| In-Fixture / Embedded Luminaire | ||
| By Installation Type | Retrofit | |
| New Construction | ||
| By Building Type | Residential | |
| Commercial | ||
| Industrial and Warehousing | ||
| Healthcare and Assisted Living | ||
| Government and Education | ||
| By Application | Lighting Control | |
| HVAC and Ventilation | ||
| Security and Surveillance | ||
| People Counting and Space Utilization | ||
| Bed / Restroom Occupancy Monitoring | ||
| By Geography | North America | United States |
| Canada | ||
| Mexico | ||
| South America | Brazil | |
| Argentina | ||
| Rest of South America | ||
| Europe | United Kingdom | |
| Germany | ||
| France | ||
| Italy | ||
| Nordics (Sweden, Norway, Denmark, Finland) | ||
| Rest of Europe | ||
| Middle East | Saudi Arabia | |
| UAE | ||
| Turkey | ||
| Rest of Middle East | ||
| Africa | South Africa | |
| Nigeria | ||
| Rest of Africa | ||
| Asia-Pacific | China | |
| Japan | ||
| India | ||
| South Korea | ||
| Australia | ||
| Rest of Asia-Pacific | ||


Key Questions Answered in the Report
What is the current size of the occupancy sensor market?
The Occupancy Sensor Market stood at USD 3.26 billion in 2026 and is forecast to reach USD 4.16 billion by 2031 at a 5.04% CAGR.
Which connectivity segment leads the occupancy sensor market?
Wired solutions lead with 61.55% share in 2025 thanks to their reliability, although wireless nodes are growing at a 12.18% CAGR.
What application area is growing fastest?
HVAC and ventilation control shows the highest growth at a 13.88% CAGR as building owners widen focus from lighting to full environmental optimization.
Why is healthcare an emerging opportunity?
CMS and MDR regulations reward hospitals that deploy bed-occupancy monitoring, expanding sensor adoption beyond traditional lighting and HVAC uses.
Which regions will drive future demand?
Asia-Pacific exhibits the fastest CAGR to 2031 due to China’s dual-carbon targets and rapid urbanization, while Europe and North America maintain strong baseline demand through regulatory mandates.
How fragmented is the competitive landscape?
The top five players hold about 29.45% share in 2025, indicating moderate consolidation yet persistent entry opportunities for AI-driven startups.
Page last updated on:


