
Market Overview
| Study Period | 2020 - 2031 |
|---|---|
| Forecast Data Period | 2026 - 2031 |
| Historical Data Period | 2020 - 2024 |
| Growth Rate | 5.72 % |
| Market Concentration | High |
Major Players *Disclaimer: Major Players sorted in no particular order Image © Mordor Intelligence. Reuse requires attribution under CC BY 4.0. | |
North America Waterborne Adhesives Market Analysis by Mordor Intelligence
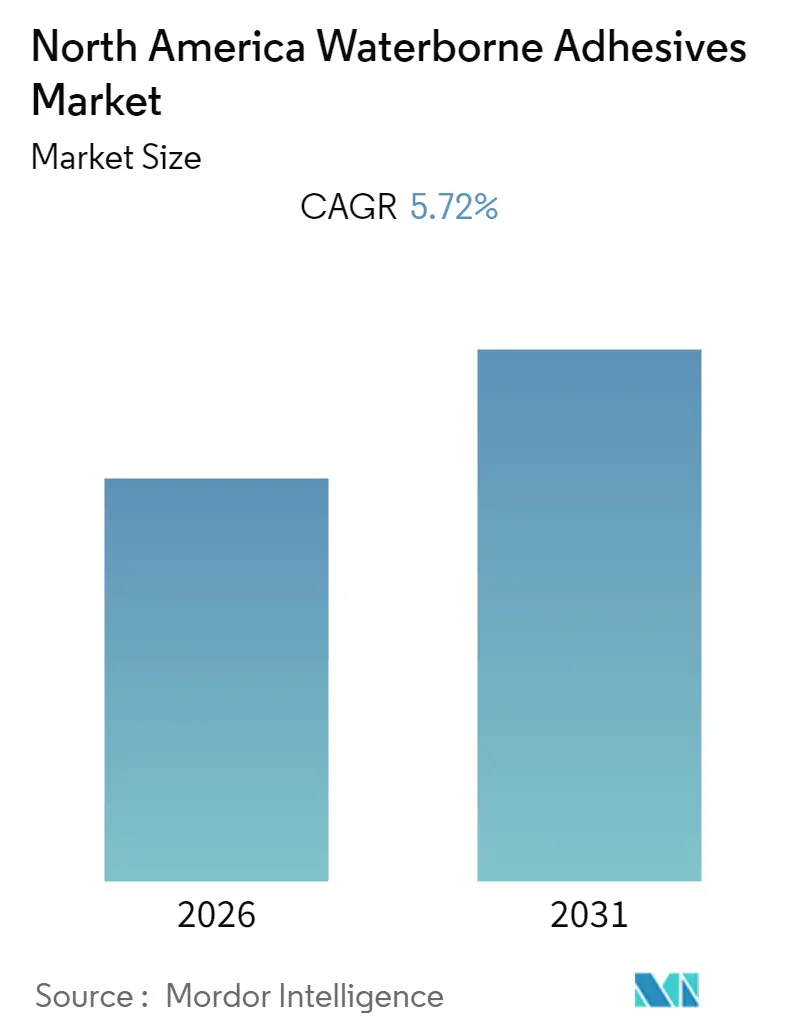
The North America Waterborne Adhesives Market size is expected to register a CAGR of 5.72% during the forecast period (2026-2031).
- Growing advancements in food packaging and safety industry is expected to provide a major growth opportunity for the market studied.
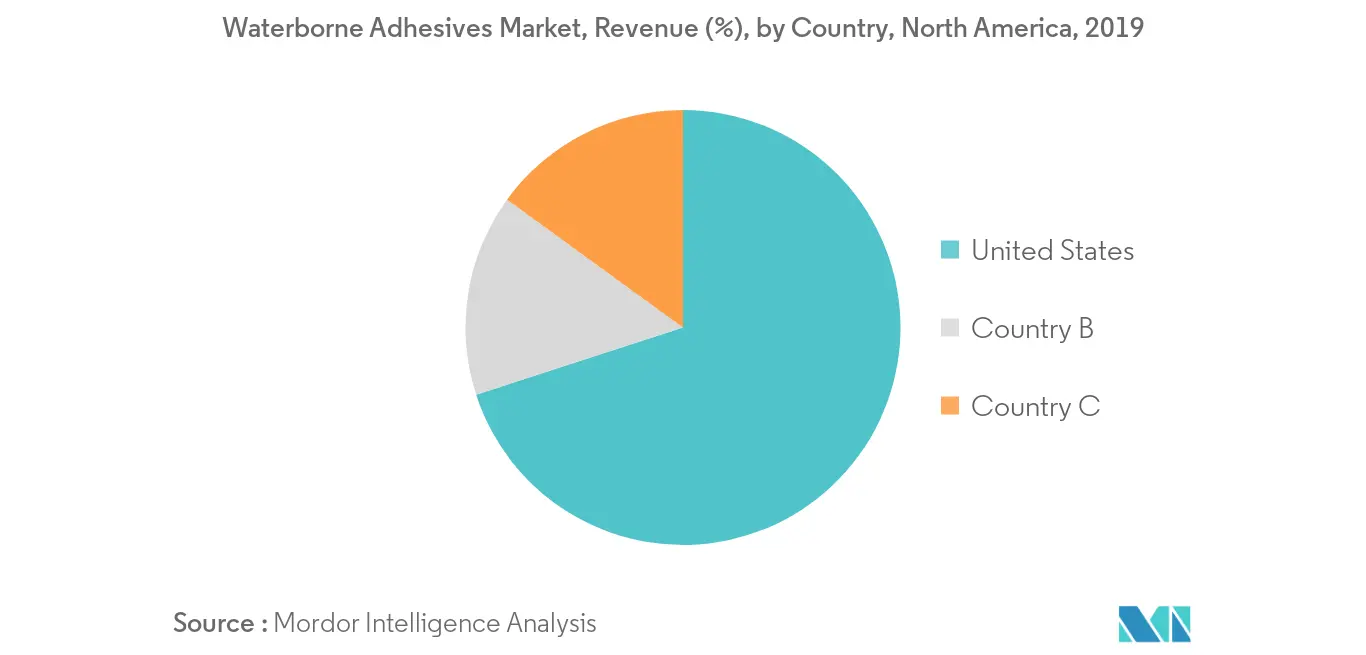
- United States accounted for the highest share of the market and is likely to continue dominating the market during the forecast period.
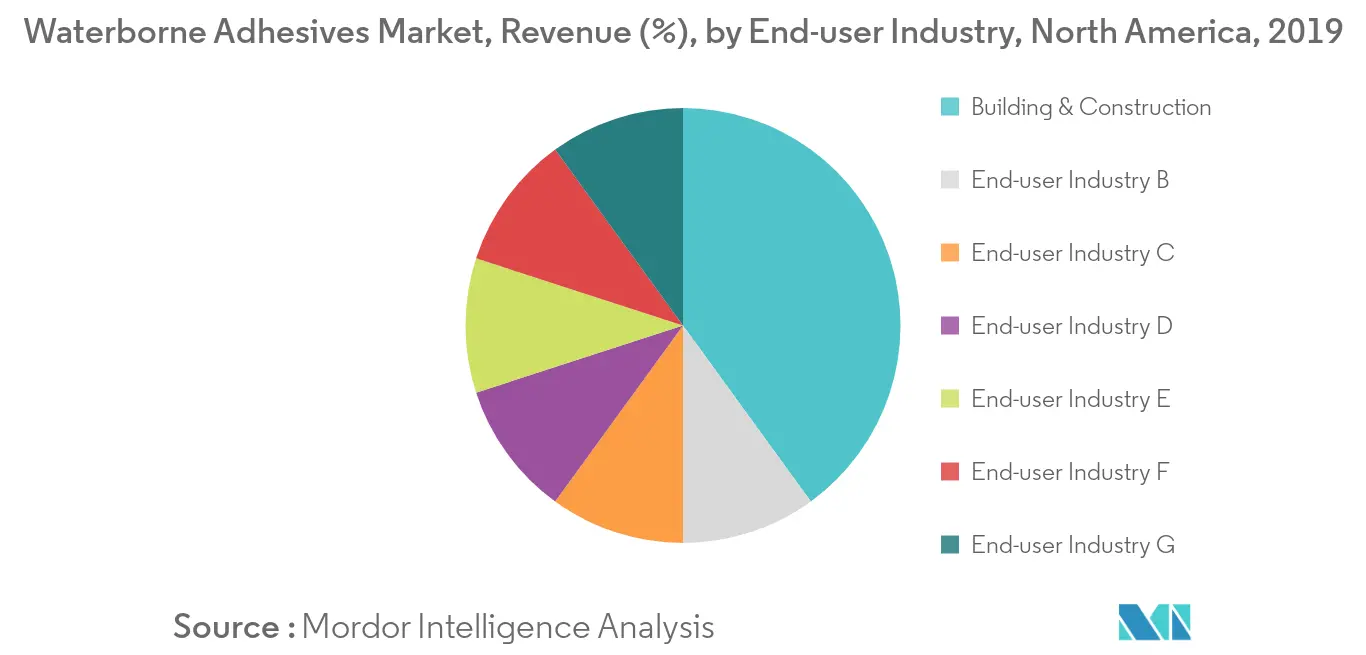
- Among the end-user industries, building & construction is expected to dominate the market during the forecast period.
Note: Market size and forecast figures in this report are generated using Mordor Intelligence’s proprietary estimation framework, updated with the latest available data and insights as of 2026.
North America Waterborne Adhesives Market Trends and Insights
Construction Industry to Dominate the Market
- In the construction sector, adhesives are used in concrete, ceramic tiles, carpet laying, flooring underlayment, drywall lamination, joint cement, manufactured housing, pre-finished panels, resilient flooring, roofing, and wall covering.
- Various types of adhesives are used depending on the purposes they serve. The growth in green building construction, coupled with the rising concern about the quality of construction, is accelerating the demand for water-borneadhesives.
- Water-borne adhesives are produced from either soluble synthetic polymers or natural polymers. Water-borne adhesives use water as a carrier or diluting medium to disperse a resin.
- Water-borne adhesives are increasingly becoming an integral part of construction chemicals, owing to their eco-friendly and low-toxic nature, high solid content, and high initial adhesion properties.
- Hence, owing to the above-mentioned reasons, the building & construction industry is likely to dominate the market studied


United States to Dominate the Market
- United States accounts for the largest market by volume for waterborne adhesives market in North America currently.
- Rise in the construction of green buildings in the country is driving the demand for waterborne adhesives in the country.
- United States also observes the highest adoption rate for waterborne adhesives in various industries, like construction, footwear, woodwork, aerospace, transportation, and medical among other.
- Hence, owing to the above-mentioned reasons, United States is likely to dominate the market studied during the forecast period.
Regulatory Landscape
In North America, waterborne adhesive demand is influenced by VOC-control frameworks that favor lower-emitting formulations. In the United States, the US EPA Control Techniques Guidelines (CTG) for miscellaneous industrial adhesives offers a reference benchmark that many state and local air agencies use when setting VOC content limits, which has supported a shift toward waterborne and other low-VOC options. A frequently referenced example is Californias South Coast Air Quality Management District (SCAQMD) Rule 1168, which sets VOC limits by adhesive category.
In Canada, federal rules set VOC concentration limits for adhesives and sealants under the Volatile Organic Compound (VOC) Concentration Limits for Certain Products Regulations (SOR/2021-268), requiring suppliers to manage VOC content calculations and labeling against product-category thresholds. Canada also tightened restrictions relevant to adjacent sealant chemistries through the Certain Products Containing Toxic Substances Regulations (SOR/2025-36), published in March 2025, with prohibitions taking effect across manufacturing and import (October 2025) and sales (December 2025) for coal tar based sealants and high-PAH sealants. This adds another compliance driver that pushes suppliers toward low-toxicity, lower-emission product portfolios.
Competitive Landscape
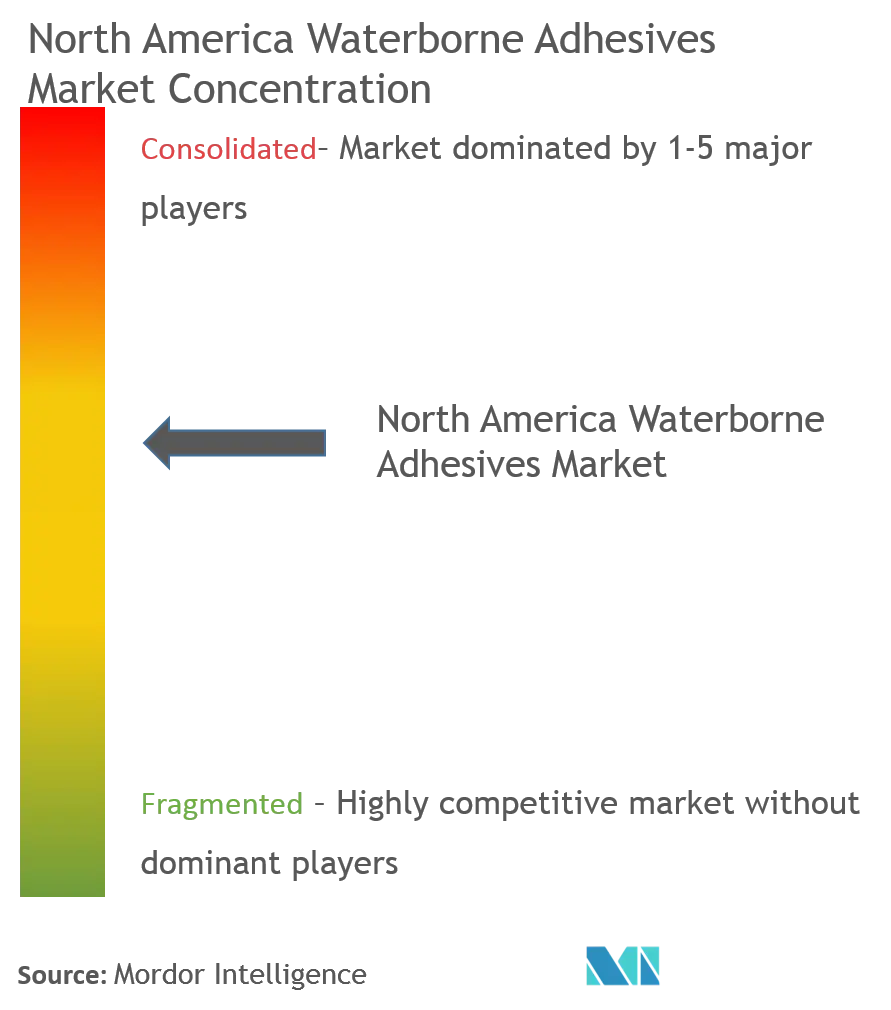
The North America waterborne adhesives market is moderately consolidated as the market of the market share is divided among a few players. Some of the key players in the market include 3M, Arkema Group, Dow, Henkel AG & KGaA, and Sika AG, amongst others.
North America Waterborne Adhesives Industry Leaders
3M
Arkema Group
Dow
Henkel AG & Co. KGaA
Sika AG
- *Disclaimer: Major Players sorted in no particular order

Market Opportunities and Future Outlook
Food packaging, building and construction, and other safety-sensitive end uses continue to create demand for waterborne systems that combine low VOC profiles with performance on modern substrates, including films, coated papers, composites, and engineered wood. In parallel, manufacturers have been committing capital to expand adhesives and sealants capacity in the United States, which supports supply continuity and can shorten customer qualification cycles. Sonoco announced a USD 30 million investment in July 2025 to expand adhesives and sealants capacity across three facilities, and QEP unveiled a next-generation Roberts adhesive plant in Dalton, Georgia in July 2025 that doubled output to 18,000 gallons per single shift, aligning with construction and flooring installation demand.
There is also room for formulation and feedstock differentiation as sustainability requirements rise and brand owners and converters seek bio-attributed and renewable-content chemistries without shifting to solvent-based systems. Arkema expanded its North American offering through ISCC PLUS certification of its St. Charles, Louisiana waterborne acrylic resin manufacturing site (announced June 2025), enabling mass-balance bio-attributed inputs for downstream adhesive formulations. Bostik invested USD 27 million at its Middleton, Massachusetts plant (completed May 2025) to scale high molecular weight polyester production used in durable goods and related adhesive applications. Together, these actions reinforce product development opportunities in packaging laminations and other performance segments as customers tighten VOC and sustainability requirements.
Recent Industry Developments
- March 2026: Environment and Climate Change Canada issued a compliance guide to support implementation of the Certain Products Containing Toxic Substances Regulations covering coal tar based sealants and PAH limits. The guidance helps manufacturers and importers translate the requirements into product stewardship and documentation practices, shaping how suppliers position low-toxicity, compliant adhesive and sealant portfolios in Canada.
- June 2025: Arkema obtained ISCC PLUS certification for its waterborne acrylic resin manufacturing facility in St. Charles, Louisiana to support bio-attributed, mass-balance resins. The certification improves access to certified waterborne resin inputs for adhesive formulators serving customers that require sustainability credentials alongside VOC constraints.
- October 2024: 3M launched Fastbond Pressure Sensitive Adhesive 1049, a water-based, solventless, non-flammable adhesive delivered via the portable PowerCore cylinder system. The product and delivery format expand application options for customers replacing solvent-based pressure-sensitive systems while simplifying onsite handling and reducing emissions.


Research Methodology Framework and Report Scope
Market Definition and Coverage
For this study, the market is defined as the value of waterborne adhesives sold in North America across major end-use industries, counted at the point of sale by manufacturers and distributors, and reported in USD for the covered period.
Scope exclusions: This sizing does not count solvent-borne, hot-melt, or reactive adhesive technologies, even when they serve the same applications.
Segmentation Overview
- Resin Type
- Acrylics
- Polyvinyl Acetate (PVA) Emulsion
- Ethylene Vinyl Acetate (EVA) Emulsion
- Polyurethane Dispersions and CR (Chloroprene Rubber) Latex
- Other Resin Types
- End-user Industry
- Building & Construction
- Paper, Board, and Packaging
- Woodworking & Joinery
- Transportation
- Healthcare
- Electrical & Electronics
- Other End-user Industries
- Geography
- United States
- Canada
- Mexico
Data Sources, Market Sizing, and Validation
Desk Research
Desk research was used to set the demand context and to keep assumptions grounded in observable activity across the United States, Canada, and Mexico. We reviewed public sources such as US Census Bureau construction and manufacturing indicators, USITC trade statistics for relevant chemical and polymer categories, Environment and Climate Change Canada publications for regulatory context, and industry bodies such as the Adhesive and Sealant Council for technology and application direction.
To translate context into inputs, we also leaned on company filings, investor presentations, technical datasheets, and credible press coverage to understand product mix shifts like low-VOC adoption and packaging demand cycles. Where available, paid subscriptions for company financials and patent databases were used to validate supplier presence, product claims, and change points in resin technology. The desk research sources listed above are illustrative, and many additional public and paid references were used for data collection, cross-checks, and clarification.
Primary Interviews and Surveys
Primary work focused on interviews and structured surveys with raw material participants, adhesive formulators, distributors, and downstream users in packaging, construction, woodworking, transportation, and healthcare. We used these discussions to confirm waterborne share by application, understand how pricing moves with contract resets and pass-through timing, and identify where substitution to other technologies was actually occurring across North America.
Distribution of primary research fieldwork respondents
| Company type | Respondent position |
|---|---|
| Top tier: 36% | CXOs: 12% |
| Mid tier: 50% | Functional/Unit leaders: 36% |
| Smaller Players: 14% | Managers: 52% |
Market-Sizing & Forecasting
Sizing starts with a top-down build where regional adhesives demand is reconstructed through end-use activity and technology penetration, and then narrowed to waterborne share by resin and application. The model is anchored to market fingerprints such as construction starts and remodeling activity, packaging output trends, furniture and joinery production signals, and changes in VOC-driven formulation choices, which all influence consumption volumes and mix.
Those totals are then checked using selective bottom-up approximations, including supplier and distributor channel checks and sampled price-per-kilogram ranges multiplied by implied volumes for key end uses. Where a gap appears because smaller private suppliers do not disclose financials, the missing portion is handled through share allocation informed by interview-based capacity and channel presence, and then it is re-tested against the total demand pool.
For forecasting, scenario analysis was applied so macro drivers and end-use cycles could be reflected without overfitting limited public data. Inputs such as housing and infrastructure outlook, packaging growth expectations, resin availability, and expected price progression were adjusted based on what practitioners said is realistic for contract resets and raw material pass-through timing.
Data Validation & Update Cycle
Validation is done through multiple checks that compare modeled results with independent signals, such as trade movement for relevant feedstocks, end-use production indices, and observed pricing ranges shared during interviews. Outliers are reviewed, assumptions are revisited, and follow-up calls are triggered when variance cannot be explained by mix or timing.
Before sign-off, the work is reviewed in steps so calculations, units, and currency handling are consistent across the time series. Reports are refreshed annually, and interim updates are made when material events occur, such as sharp raw material swings or regulatory changes affecting technology choice. Right before delivery, a final analyst pass is completed so clients receive the most current view available.
Mordor Intelligence's North America Waterborne Adhesives Market Size Compared Against Other Published Estimates
Published market sizes for North America waterborne adhesives can differ even when the titles look similar, because boundaries and counting logic are not the same. The largest gaps usually come from what is included as waterborne, how prices are treated across resin systems, and whether the estimate is built from end-use demand or from a broader chemical revenue pool.
By tracking end-use demand indicators, checking technology penetration by application, and refreshing price assumptions with expert inputs, Mordor Intelligence keeps the total tied to waterborne-only volumes sold into North American industries, rather than mixing in wider adhesives categories or non-comparable price points.
Benchmark comparison
| Source | Market Size | Gaps in Research Methodology |
|---|---|---|
| Mordor Intelligence | USD 0.00 B (2024) | |
| Global Consultancy A | USD 19.17 B (2024) | This estimate appears to use a broader revenue pool for adhesives that can over-include adjacent technologies and applications, which can inflate totals when the waterborne boundary is not consistently enforced. |
| Industry Publisher B | USD 7.49 B (2024) | This estimate likely applies a narrower application set or conservative penetration and price progression, which can undercount waterborne demand in packaging and construction when coverage is limited. |
The spread across sources is mainly explained by scope control and by how demand and pricing are connected to end-use activity. Using a repeatable chain from industry indicators to waterborne penetration and then to realistic pricing checks helps keep the final number understandable and easier to audit year to year.


Key Questions Answered in the Report
What is the current North America Waterborne Adhesives Market size?
The North America Waterborne Adhesives Market is projected to register a CAGR of 5.72% during the forecast period (2026-2031)
Who are the key players in North America Waterborne Adhesives Market?
3M, Arkema Group, Dow, Henkel AG & Co. KGaA and Sika AG are the major companies operating in the North America Waterborne Adhesives Market.
What years does this North America Waterborne Adhesives Market cover?
The report covers the North America Waterborne Adhesives Market historical market size for years: 2019, 2020, 2021, 2022, 2023, 2024 and 2025. The report also forecasts the North America Waterborne Adhesives Market size for years: 2026, 2027, 2028, 2029, 2030 and 2031.
Page last updated on:


 Your data is secure and never sold or shared.


