
Functional Proteins Market Size and Share
Market Overview
| Study Period | 2021 - 2031 |
|---|---|
| Market Size (2026) | USD 10.1 Billion |
| Market Size (2031) | USD 14.62 Billion |
| Growth Rate (2026 - 2031) | 7.70 % |
| Fastest Growing Market | Middle East and Africa |
| Largest Market | Asia Pacific |
| Market Concentration | Medium |
Major Players
*Disclaimer: Major Players sorted in no particular order Image © Mordor Intelligence. Reuse requires attribution under CC BY 4.0. |
|
Functional Proteins Market Analysis by Mordor Intelligence
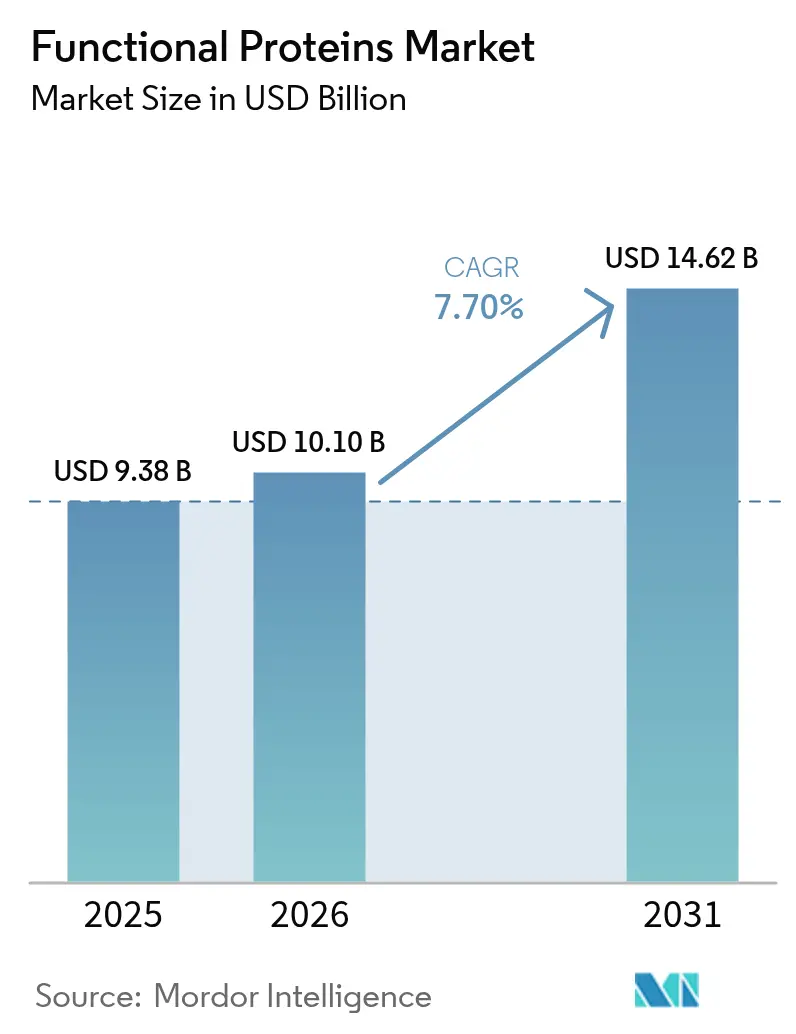
The functional proteins market size is expected to grow from USD 9.38 billion in 2025 to USD 10.1 billion in 2026 and is forecast to reach USD 14.62 billion by 2031 at 7.70% CAGR over 2026-2031. The functional protein market growth reflects the intersection of health-conscious consumer behavior, regulatory modernization, and technological advancements in protein extraction and processing. The market demonstrates stability through its diverse applications across food and beverages, supplements, animal nutrition, and cosmetics sectors. Key developments in the functional proteins industry include the regulatory approval of precision fermentation technologies, exemplified by Perfect Day's collaboration with Zydus Lifesciences to establish fermentation facilities in India. The FDA's elimination of the self-affirmed GRAS pathway indicates increased regulatory oversight, requiring manufacturers to pursue formal approval processes. The increasing demand for plant-based and alternative protein sources has accelerated research and development initiatives in the functional protein space.
Key Report Takeaways
- By source, animal-based proteins held 62.52% of the functional proteins market share in 2025, while microbial proteins are projected to grow at an 8.22% CAGR to 2031.
- By application, supplements captured 8.98% CAGR growth potential, compared with food and beverages retaining 55.10% revenue share of the functional proteins market in 2025.
- By category, conventional accounted for 84.85% of the functional proteins market size in 2025, whereas organic is expected to expand at a 9.86% CAGR through 2031.
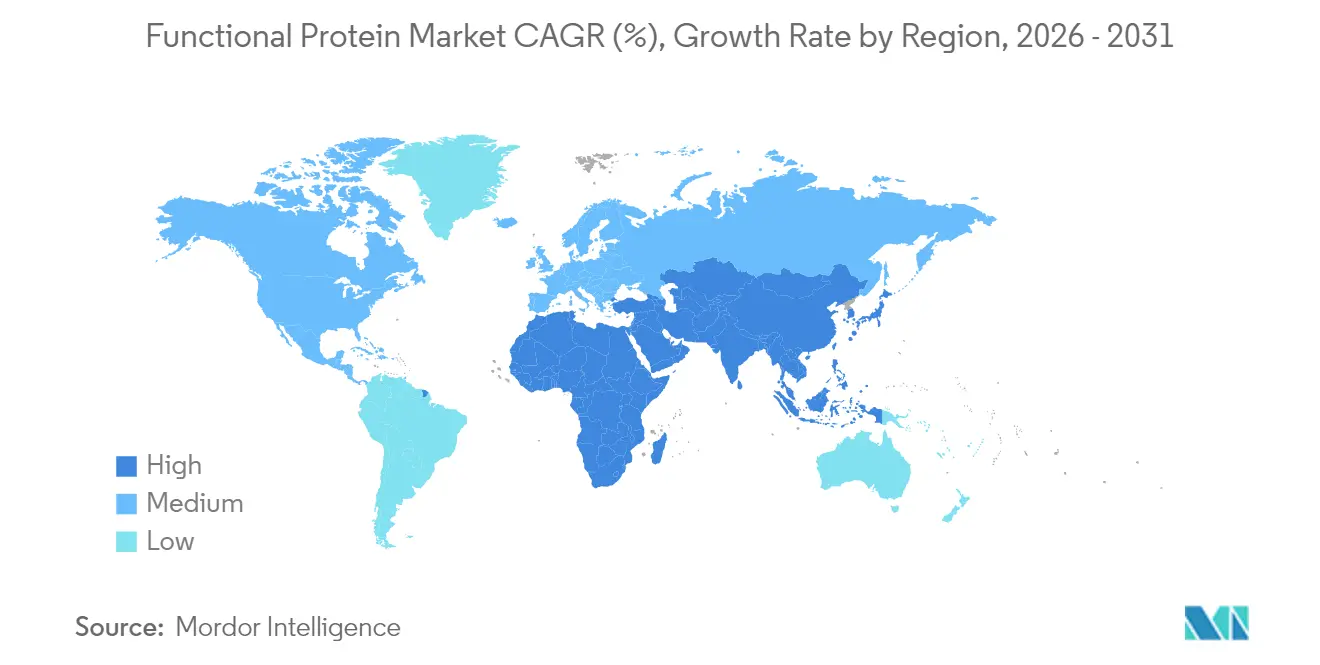
- By geography, Asia-Pacific led with a 36.15% contribution to overall revenue in 2025; the Middle East and Africa are forecast to achieve the fastest 9.27% CAGR to 2031.
Note: Market size and forecast figures in this report are generated using Mordor Intelligence’s proprietary estimation framework, updated with the latest available data and insights as of 2026.
Market Trends and Insights
Drivers Impact Analysis of Functional Proteins Market*
| Driver | (~) % Impact on CAGR Forecast | Geographic Relevance | Impact Timeline |
|---|---|---|---|
| Rising Demand for protein-eriched functional food and beverages | +1.8% | Global, with strong momentum in North America and European Union | Medium term (2-4 years) |
| Rapid adoption of plant-based protein | +1.5% | Asia-Pacific core, spill-over to North America and European Union | Long term (≥ 4 years) |
| Advancements in protein extraction and processing technologies | +1.2% | Global, led by North America and European Uniona innovation hubs | Long term (≥ 4 years) |
| Growing demand for sports and performance nutrition | +1.0% | North America and European Union primary, expanding to Asia-Pacific | Medium term (2-4 years) |
| Expanding aging population with specific dietary needs | +0.9% | Global, concentrated in developed markets | Long term (≥ 4 years) |
| Inclusion in pet food and animal nutrition | +0.6% | Global, with strong growth in North America and European Union | Medium term (2-4 years) |
| Source: Mordor Intelligence | |||
Rising demand for protein-enriched functional food and beverages
Consumer preferences are shifting toward protein-enriched food products across various categories, with 64% of consumers actively incorporating additional protein into their diets, according to Danone. This shift extends beyond traditional protein supplements into mainstream food products, as evidenced by Kellogg's introduction of High Protein Bites cereal, containing 21% plant-based protein, in the United Kingdom market. The increasing health consciousness among consumers and growing awareness of protein's role in maintaining overall wellness are key factors driving this trend. Arla Foods' development of ISO.Clear whey protein isolate enables protein fortification in beverages without affecting clarity, targeting the USD 125 billion fortified drinks market, which is expected to grow at a 5.1% CAGR. The functional beverage segment is experiencing advancement through precision fermentation proteins, exemplified by EVERY Co.'s launch of animal-free protein formulations for coffee products. Additionally, manufacturers are investing in research and development to create innovative protein-enriched products that meet consumer demands for taste, convenience, and nutritional value.
Rapid adoption of plant-based protein
Plant-based protein adoption increases as technological improvements address traditional taste and texture limitations, with manufacturers prioritizing quality enhancement over new protein source development. Roquette Frères S.A.'s NUTRALYS Fava S900M, containing 90% protein content, exemplifies the industry's shift toward higher-purity plant proteins. The FDA's GRAS certification for Axiom Foods' Oryzatein rice protein enables its use in mainstream food applications, providing an alternative to conventional soy and whey proteins. Hybrid protein formulations attract global consumers seeking nutritional balance and environmental sustainability, as manufacturers develop blended solutions that preserve familiar taste profiles while reducing ecological impact. The market also benefits from increasing consumer awareness of protein's role in maintaining health and wellness, driving demand across various applications. Additionally, ongoing research and development in protein extraction and processing technologies continue to improve product functionality and cost-effectiveness.
Expanding aging population with specific dietary needs
Demographic shifts necessitate specialized protein formulations to address age-related muscle loss and digestive challenges, prompting companies to develop targeted medical nutrition solutions. Arla Food Amb's Lacprodan DI-3092 whey protein hydrolysate provides 10g protein per 100ml, surpassing typical market offerings of 6-7g while improving compliance in elderly nutrition. Lactalis Ingredients focuses on beverage concepts for healthy aging demographics, indicating increased industry focus on this growing segment. Regulatory developments support market expansion, with China implementing new Food for Special Medical Purposes (FSMP) infant formula standards by March 2027, establishing guidelines for specialized medical nutrition products. For aging populations, protein quality measurement evolves from traditional protein efficiency ratios to digestible indispensable amino acid scores (DIAAS). The global functional protein market experiences significant growth due to increasing consumer awareness of preventive healthcare and wellness. Medical professionals increasingly recommend specialized protein formulations for post-surgery recovery and chronic disease management, further driving market expansion.
Inclusion in pet food and animal nutrition
Pet food protein innovation accelerates through novel ingredients addressing sustainability and allergenicity concerns, with MicroHarvest's microbial protein dog treats demonstrating consumer acceptance of fermentation-derived proteins[1]Pet Food Industry, "MicroHarvest, VEGDOG launch pet treat with microbial protein", petfoodindustry.com. Calysta's FeedKind Pet protein achieves European market entry, providing non-GMO, animal-free protein with complete amino acid profiles for pet applications. The segment benefits from precision fermentation scaling, with Calysseo's 20,000-ton annual capacity supporting commercial pet food launches like Marsapet's MicroBell dry kibble. Aquaculture applications expand through partnerships like Enifer's collaboration with Brazilian ethanol giant FS to produce mycoprotein from corn ethanol byproducts. Regulatory approvals facilitate market expansion, with Calysta achieving GRAS status for salmon feed applications and pursuing similar approvals for pet food
Restraints Impact Analysis of Functional Proteins Market*
| Restraint | (~) % Impact on CAGR Forecast | Geographic Relevance | Impact Timeline |
|---|---|---|---|
| Taste and sensory challenges in food formulations | -2.3% | Global, particularly acute in North America and Europe | Medium term (2-4 years) |
| Competition from other alternative proteins | -2.0% | North America and Europe core, expanding to Asia-Pacific | Long term (≥ 4 years) |
| High Research and Development and production setup costs | -1.8% | Global, with higher impact in emerging markets | Short term (≤ 2 years) |
| Limited consumer awareness and acceptance | -1.5% | Asia-Pacific and MEA core, moderate impact in developed markets | Medium term (2-4 years) |
| Source: Mordor Intelligence | |||
Allergen concerns with animal and soy proteins
Allergen concerns with animal and soy proteins significantly restrict the functional protein market's growth by limiting consumer adoption due to widespread allergic reactions to dairy, egg, or soy. This forces manufacturers to invest in costly reformulations using alternative proteins like pea or rice, which can compromise functionality and raise production costs. Heightened demand for allergen-free products also pushes companies to prioritize safety and comply with strict labeling regulations, slowing innovation. Moreover, the need for extensive allergen testing and certification adds to operational complexities and expenses. Consumer apprehension about cross-contamination risks further dampens market confidence, reducing demand for products containing these proteins. Lastly, the limited availability of scalable, cost-effective hypoallergenic protein sources hinders the market's ability to meet growing demand for functional foods.
Taste, solubility and texture challenges
Plant-based protein adoption faces ongoing sensory limitations despite technological progress, with companies like HiFood developing micronized proteins to achieve high neutrality and minimal sensory impact. Wageningen University addresses texture optimization through AI model development for meat and dairy alternatives. Solubility issues affect beverage applications, leading Arla to engineer ISO.Clear technology for preventing cloudiness in juice fortification. The industry now focuses on hybrid solutions that combine plant and animal proteins, as global consumers show preference for blended formulations over pure plant alternatives. Research and development investments continue to target improved protein functionality and taste profiles to overcome these challenges. Manufacturers are also exploring novel processing techniques and ingredient combinations to enhance the overall performance of plant-based proteins in various food applications.
*Our forecasts treat driver/restraint impacts as directional, not additive. The impact forecasts reflect baseline growth, mix effects, and variable interactions.
Functional Proteins Market Segment Analysis
By Source:
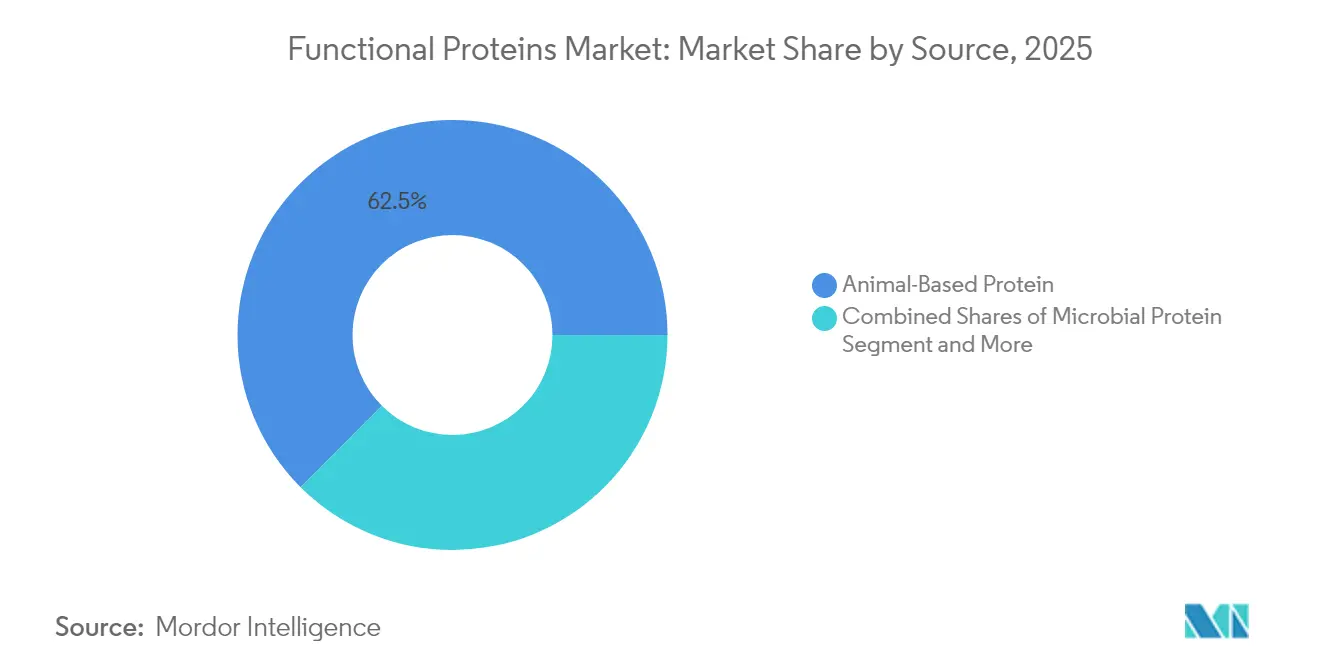
Microbial Proteins Drive InnovationAnimal-based proteins commanded 62.52% market share in 2025, anchored by dairy proteins' superior functional properties and established supply chains. This growth is supported by Arla Foods Amba's FDA approval for whey protein hydrolysates in infant formula . Microbial proteins emerge as the fastest-growing source segment at 8.22% CAGR through 2031, driven by scalability breakthroughs and regulatory approvals. Plant-based proteins maintain steady growth through improved extraction technologies and hybrid formulations addressing taste limitations.
MicroHarvest's achievement of 15,000-ton annual production capacity by 2026 demonstrates microbial protein commercialization potential, with the company overcoming traditional scaling challenges through process stability optimization. Precision fermentation platforms enable animal-identical protein production without traditional agriculture constraints, as evidenced by Perfect Day's partnership with Zydus Lifesciences to establish Indian manufacturing capabilities. Animal-based proteins benefit from processing innovations like Arla's ultra-filtered milk technologies, which concentrate protein content while maintaining functionality. Plant-based sources gain momentum through novel extraction methods and sustainable sourcing, with the EU's approval of Lemna protein concentrate representing regulatory acceptance of aquatic plant proteins



By Application:
Food and Beverage Breadth Versus Supplement VelocityFood and beverages contributed 55.10% of turnover in 2025, illustrating the ubiquity of protein fortification across bakery, confectionery, dairy alternatives, and beverage concentrates. Bread, bars, and dairy analogues rely on proteins for emulsification, foam stability, and mouthfeel, ensuring steady volume uptake. Supplements, encompassing ready-to-mix powders, tablets, and gummies, are poised to advance at a 8.98% CAGR to 2031, driven by e-commerce accessibility and personalized nutrition plans. Brand owners diversify formats, from single-serve sachets to collagen-infused shots, extending penetration among lifestyle users beyond elite athletes.
Functional attributes such as muscle recovery, satiety enhancement, and weight-management underpin sustained demand in both domains. Manufacturers harness data insights to fine-tune amino acid ratios and optimize serving sizes, strengthening repeat purchase propensity. As consumers converge on snackification and proactive wellness, the protein market size allocated to indulgent yet purposeful formats such as high-protein cookies or fortified plant milks is forecast to propel category breadth. Supplements meanwhile attract adoption through minimal preparation time and transparent dosage information, reshaping perception from niche to mainstream.
By Category:
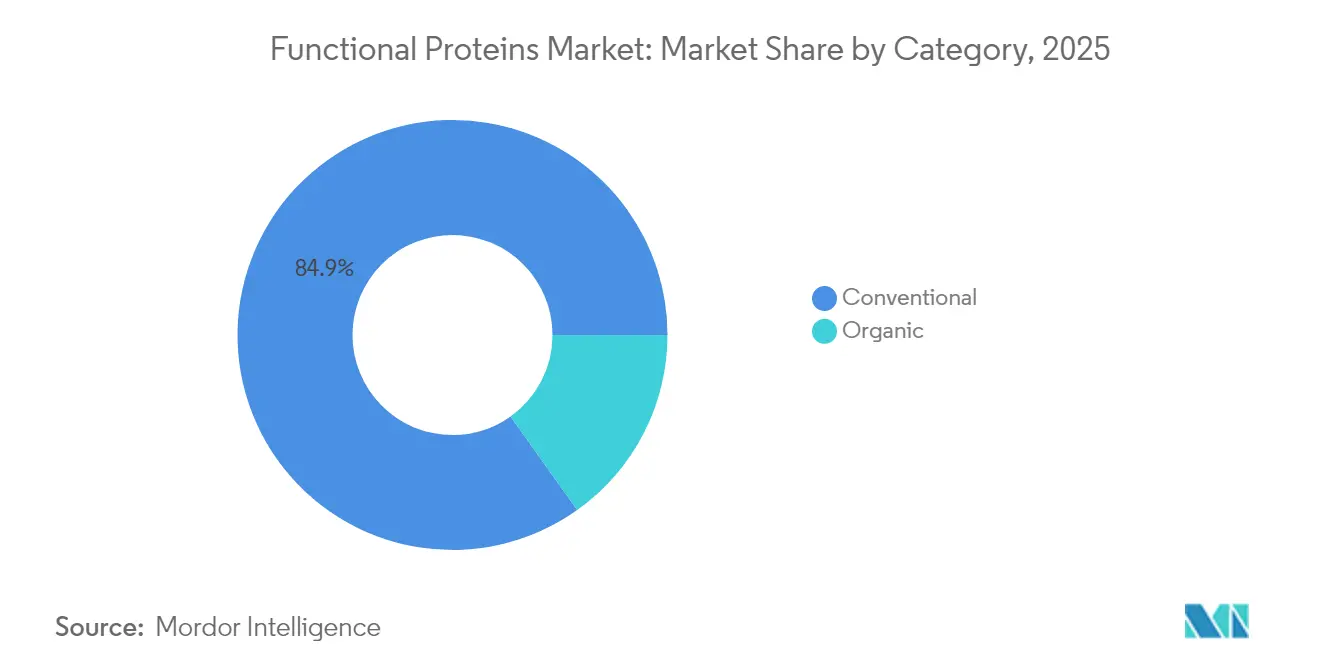
Conventional Scale and Organic MomentumConventional processing channels including standard solvent extraction, heat treatments, and enzymatic clarifications accounted for 84.85% of global turnover in 2025. Consistent raw material availability, standardized functional parameters, and favorable pricing support widespread use in mass-market snacks, cereals, and pet nutrition. Organic protein, while representing a smaller base, is projected to record a 9.86% CAGR to 2031 as stricter pesticide residue thresholds and regenerative agriculture narratives resonate with premium shoppers. Certification bodies demand traceability from farm to fork, spurring investments in dedicated supply chains. Retailers position organic stock-keeping units in health-focused aisles, commanding price premiums that partially offset lower extraction yields.
Within the conventional channel, continuous process innovation narrows the sustainability gap through energy recovery, membrane filtration, and by-product valorization. Simultaneously, organic suppliers experiment with high-protein heritage grains to stand out. The protein market size for organic offerings is expected to benefit from growing institutional procurement by hospitals and schools that prioritize chemical-free ingredients. Conventional players counter through non-GMO claims and transparent farm partnerships, ensuring that both categories progress in tandem rather than cannibalize each other.
Geography Analysis
APAC and North America Functional Proteins Market
Asia-Pacific captured 36.15% revenue in 2025, reflecting large populations, rising middle-class incomes, and higher urbanization. Plant proteins sourced from soy, rice, and pea resonate with traditional cuisines, facilitating homegrown product development. Government programs promoting food security and value addition encourage investments in modern fractionation lines, supporting local supply sufficiency. Dairy-derived ingredients such as whey permeate also gain ground in sports powders sold via cross-border e-commerce, illustrating import complementarities. The protein market share attributed to North America is bolstered by dedicated distribution infrastructure, enabling rapid rollouts across health food stores, gyms, and mainstream retailers.
EMEA Functional Proteins Market
Europe exhibits strong momentum in organic and sustainable offerings, underpinned by stringent labeling regulations and institutional commitments to greenhouse-gas reduction. Retailers prioritize products featuring cleaner ingredient decks, supporting premiumization. The Middle East and Africa, while currently representing a smaller portion of global sales, is forecast to register the highest regional CAGR of 9.27% between 2026 and 2031. Demographic youth bulges, rising fitness club memberships, and expatriate influence favor sports powders and ready-to-drink shakes. Investments in aquaculture feed also heighten protein ingredient demand, with local governments encouraging private-sector participation.
North America Functional Proteins Market
North America’s functional protein market reflects a mature consumer base with high awareness of performance nutrition, clean labels, and personalized wellness. Demand is anchored by strong penetration of whey, collagen, and plant-based blends, supported by established contract manufacturing and cold-chain capabilities that ease nationwide distribution. Fitness culture, active aging trends, and the expansion of lifestyle nutrition brands through gyms, specialty retailers, and direct-to-consumer channels deepen category visibility. Regulatory clarity around ingredient safety and permissible claims further enables innovation, while sustained interest in high-protein snacks and fortified beverages broadens usage beyond sports nutrition into mainstream daily consumption. Overall, each region contributes distinct growth vectors that reinforce the diversified outlook for the protein market.

Regulatory Landscape
Regulation in the functional proteins market is shaped by pre-market safety pathways for novel sources (precision fermentation, biomass fermentation, aquatic plants, and mycelium) and by claim and labeling compliance for fortified foods, supplements, and special medical nutrition. In the United States, the FDA GRAS Notice program continues to act as a key gate for commercialization of novel functional proteins, with multiple 2025 GRAS “no questions” letters for precision-fermented beta-lactoglobulin (e.g., GRN 1247 and GRN 1241) supporting broader use in mainstream food categories beyond niche alternatives.
In Europe and the United Kingdom, market entry for novel proteins is more dossier-driven under the Novel Food framework. The European Commission updated the Union list via amendments published in 2026, and the UK Food Standards Agency issued supplementary guidance in March 2026 for novel foods produced by precision or biomass fermentation. The guidance clarifies expectations for bioinformatics, protein characterization, and digestibility assays, which raises the bar on analytical evidence for fermentation-derived proteins and affects time-to-market, documentation practices, and supplier selection for global brands running multi-region launches.
Competitive Landscape
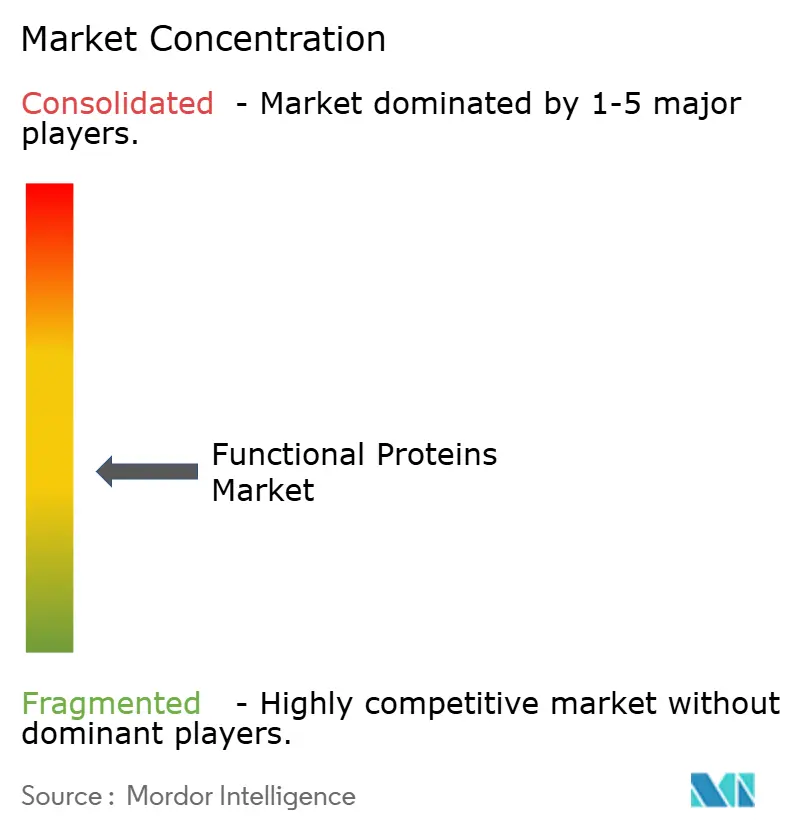
The functional proteins market exhibits moderate fragmentation.The competitive landscape comprises a blend of multinational ingredient suppliers, specialized extractors, and emergent fermentation start-ups. Kerry Group plc, Archer Daniels Midland, and Cargill, Incorporated deploy integrated value chains covering sourcing, processing, and application support. Their broad product portfolios enable cross-selling opportunities into dairy alternatives, bakery, and sports nutrition, safeguarding customer retention. Strategic consolidation accelerates through acquisitions like Arla Foods Amaba's purchase of Volac's whey nutrition business and Tate & Lyle's USD 1.8 billion acquisition of CP Kelco [3]Tata & Lyle, "Proposed acquisition of CP Kelco", tateandlyle.com.FrieslandCampina and Fonterra utilize coop-based milk pools to secure raw material consistency, while Glanbia capitalizes on whey derivatives for performance nutrition formulations.
Texture and flavor optimization serve as key differentiation levers. This has led players like Roquette Frères S.A. and DuPont to invest in proprietary texturizing systems, enhancing the palatability of plant proteins. These systems are designed to address the challenges of replicating the sensory experience of traditional animal-based proteins, which is a critical factor in driving consumer acceptance. By strategically collaborating with flavor houses, these companies can shorten development cycles, enabling them to swiftly adapt to changing consumer preferences and deliver products that align with evolving taste profiles. Furthermore, through mergers and minority stakes in precision-fermentation firms, these incumbents gain access to disruptive intellectual property, sidestepping the full brunt of research and development risks. This approach allows them to integrate cutting-edge technologies into their portfolios without bearing the high costs and uncertainties associated with in-house innovation.
Niche suppliers such as Omega Protein, AMCO Proteins, and Hilmar Cheese focus on marine or derivative fractions. They cater to specific applications, including pet nutrition and medical foods, where specialized protein solutions are required to meet stringent functional and nutritional demands. While competitive pricing is achieved through scale, it's the functional pedigree and technical service that play pivotal roles in securing contracts. These suppliers often differentiate themselves by offering tailored solutions and robust support to their clients, ensuring optimal performance in end-use applications. The overall market structure indicates a trend of moderate consolidation in established segments, juxtaposed with increased fragmentation in emerging alternatives, ensuring that innovation remains vibrant across the protein landscape. This dynamic environment fosters continuous development, as companies strive to address diverse consumer needs and capitalize on growth opportunities in both traditional and alternative protein markets.
Functional Proteins Industry Leaders
-
Kerry Group plc.
-
Sensient Technologies Corporation
-
DSM-Firmenich
-
Corbion
-
Cargill, Incorporated.
- *Disclaimer: Major Players sorted in no particular order
Functional Proteins Market Companies Covered in this Report
- Kerry Group plc.
- Sensient Technologies Corporation
- DSM-Firmenich
- Corbion
- Cargill, Incorporated.
- Agthia Group PJSC
- Glanbia, plc
- FrieslandCampina Ingredients
- Fonterra Co-Operative Group Limited
- International Flavors and Fragrances, Inc.
- Lallemand Inc.
- AngelYeast Co., Ltd.
- Sensient Technologies Corporation
- Alver World SA
- Enifer
- Zilor (Biorigin)
- Secil (Allmicroalgae)
- Sophie’s Bionutrients
- NovoNutrients.
- Roquette Frères S.A.

Market Opportunities and Future Outlook
Commercial whitespace is expanding where regulatory clearance overlaps with formulation performance, especially for fermentation-derived dairy proteins (lactoferrin, whey fractions) and for new plant proteins positioned as functional, allergen-aware alternatives to soy and egg. In 2026, the FDA’s “no questions” conclusion for Plantible’s Lemna-derived RuBisCO ingredient (Rubi Protein) provides a concrete pathway for functional proteins targeting emulsification, foaming, and binding in baked goods, beverages, and dairy alternatives. That should support faster iteration for formulators looking for egg-like functionality without animal inputs.
A second opportunity area is broader supply and application coverage across early-life nutrition, medical and healthy aging nutrition, and protein fortification in beverages and snacks, supported by visible scale-up signals and public support. Examples include Nestle partnering with Helaina in 2026 to scale bioidentical human lactoferrin for infant nutrition, and Vivici receiving a EUR 12.5 million European Innovation Council Accelerator grant (June 2026) to support scale-up of precision-fermented dairy proteins. In parallel, EU-level novel food authorizations in 2026, including Fermotein mycoprotein by The Protein Brewery and approvals enabling additional novel plant inputs, expand the eligible ingredient set for food and beverage manufacturers reformulating for taste neutrality, solubility, and clean-label positioning.
Recent Industry Developments in Functional Proteins Market
- June 2026: The Protein Brewery received EU authorization for Fermotein, a mycoprotein ingredient for use across food and beverage categories. The approval provides a clearer commercialization route for mycelium-derived functional proteins in Europe and supports broader product development beyond early adopter segments.
- June 2025: Barentz announced the acquisition of China-based Fengli Group to strengthen its position in the Chinese nutraceuticals market, with completion targeted by late 2025. The deal expands Barentz’s local distribution and supplier network, improving route-to-market for protein-based nutraceutical ingredients and related functional formulations in China.
- August 2024: Zydus Lifesciences acquired a 50% stake in Sterling Biotech in a move tied to partnering with Perfect Day to enter fermentation-based protein production. The joint venture strategy supports the build-out of animal-free protein manufacturing capability in India, adding potential regional supply options for precision-fermented functional proteins.


Functional Proteins Market Report Scope and Research Methodology
Market Definition and Coverage
For this methodology, the functional proteins market covers protein ingredients that are processed and positioned for added benefits beyond basic nutrition. These ingredients are sold for formulated uses across food, beverages, dietary supplements, animal nutrition, and cosmetics.
Scope exclusions: We exclude commoditized bulk proteins used only as basic texturizers or gelatin replacements with no functional benefit claim or positioning.
Segments Covered in This Report
-
By Source
-
Animal-Based Protein
-
Dairy
- Milk
- Whey
- Casein and Caseinates
- Egg Protein
- Others
-
Dairy
-
Plant-Based Protein
- Soy
- Pea
- Oat
- Rice
- Wheat
- Others
- Microbial Protein
-
Animal-Based Protein
-
By Application
-
Food and Beverages
- Bakery and Confectionery
- Infant Formula
- Beverages
- Dairy and Dairy Alternatives
- Meat Analogues
-
Supplements
- Sport/Performance Nutrition
- Elderly Nutrition and Medical Nutrition
- Animal Feed and Pet Nutrition
- Cosmetics and Personal Care
-
Food and Beverages
-
By Category
- Conventional
- Organic
-
Geography
-
North America
- United States
- Canada
- Mexico
- Rest of North America
-
Europe
- Germany
- United Kingdom
- Italy
- France
- Spain
- Netherlands
- Poland
- Belgium
- Sweden
- Rest of Europe
-
Asia-Pacific
- China
- India
- Japan
- Australia
- Indonesia
- South Korea
- Thailand
- Singapore
- Rest of Asia-Pacific
-
South America
- Brazil
- Argentina
- Colombia
- Chile
- Peru
- Rest of South America
-
Middle East and Africa
- South Africa
- Saudi Arabia
- United Arab Emirates
- Nigeria
- Egypt
- Morocco
- Turkey
- Rest of Middle East and Africa
-
North America
Data Sources, Market Sizing, and Validation
Desk Research
Desk research was used to set the factual base for the model, especially on protein ingredient supply, trade flows, and how end uses are defined in public statistics. We relied on sources such as USDA data, US FDA public materials (including GRAS related guidance), FAO databases, and UN Comtrade to understand trade direction and product movement signals.
To keep assumptions realistic, we also reviewed public company annual reports and investor presentations, association and standards body publications, and reputable press coverage on new capacity and technology shifts, including precision fermentation. Where available, we used paid subscriptions for company financials and intelligence, patent databases, and an import-export shipment-level database to cross-check timelines and scale indicators. This list is not exhaustive, and many other public sources were also reviewed for data collection, validation, and clarification.
Primary Interviews and Surveys
Primary work focused on validating which protein types are being bought as functional ingredients, how pricing moves by source and form, and how demand varies by end use across regions. We spoke with ingredient suppliers, contract manufacturers, and brand and procurement teams, plus industry experts, then used follow-up checks to close gaps found in desk research. The input also helped confirm adoption signals across APAC, EMEA, and the Americas.
Distribution of primary research fieldwork respondents
| Company type | Respondent position | Region |
|---|---|---|
| Top tier: 28% | CXOs: 14% | APAC: 41% |
| Mid tier: 53% | Functional/Unit leaders: 32% | EMEA: 35% |
| Smaller Players: 19% | Managers: 54% | Americas: 24% |
Market-Sizing & Forecasting
Market sizing starts with a top-down build where protein ingredient demand pools are reconstructed from end-use consumption signals, trade and production indicators, and the share of proteins sold with functional positioning, before converting the total into value. To keep the outcome grounded, we use selective bottom-up approximations to test totals, including sampled supplier and channel checks and simple volume times average selling price comparisons for key protein families.
Inputs that matter in this market include the mix shift across animal, plant, and microbial sources, the balance of dry versus liquid formats, and the split of demand across food and beverage, supplements, animal nutrition, and cosmetics. Pricing and value are also influenced by isolate versus concentrate use, hydrolysate penetration in higher value formulations, and region-level import reliance that can change landed cost. When data is missing for smaller countries, gap handling uses proxy indicators such as packaged nutrition output, dairy and plant protein processing intensity, and trade direction patterns, then adjusts them using interview feedback.
For forecasting, we rely on multivariate regression supported by scenario checks. Adoption in key applications and expected price progression are the main drivers. Assumptions are reviewed with experts so the forward view reflects realistic ramp rates rather than a single straight-line growth curve.
Data Validation & Update Cycle
Validation is done through triangulation across model outputs, desk signals, and what was captured in interviews, with follow-up on the largest variances before sign-off. We run checks on year-to-year movements, regional share stability, and implied pricing to ensure the numbers do not conflict with known trade and production trends.
If a material mismatch appears, analysts re-contact sources to determine whether it reflects a real market shift or a definition issue, then correct assumptions and re-test the build. Reports are refreshed annually, and interim updates are made when major events occur, including regulation changes, large capacity additions, or unusual commodity movements. Before delivery, a final pass is completed so clients receive the latest updated view.
Mordor Intelligence's Functional Proteins Market Size Versus Other Published Estimates
Published market sizes for functional proteins often do not match, even when the topic name looks the same, because the counted products and end uses vary across studies. Differences also come from how each publisher treats pricing, currency timing, and how frequently the base year is refreshed.
The largest gaps usually show up when some estimates include broad protein ingredients used mainly for texture or as general replacements, or when adjacent enzyme revenues are included without a clear functional protein filter. Another driver is the growth curve. Some forecasts assume fast adoption across multiple end uses, while others track closer to observed penetration in food, supplements, and animal nutrition. They also differ in ASP treatment, with some models applying more conservative step-ups and region-level mix adjustments, which is the approach applied by Mordor Intelligence.
Benchmark comparison
| Source | Market Size | Gaps in Research Methodology |
|---|---|---|
| Mordor Intelligence | USD 10.10 B (2026) | |
| Industry Publisher A | USD 6.97 B (2024) | Uses an earlier base year and a narrower demand lens focused mainly on food and beverage usage, which can leave out parts of supplements, animal nutrition, and cosmetics that buy functional protein ingredients. |
| Industry Publisher B | USD 12.17 B (2026) | Applies a faster growth and value build that appears to include a broader ingredient basket, including adjacent categories like enzymes and wider protein ingredient revenues, which can inflate the counted pool versus a functional-positioning filter. |
The spread in the table is mainly explained by what gets counted as functional, which end uses are fully included, and how quickly price and adoption are allowed to rise in the model. When the scope is kept consistent and checked against trade, production, and application-level demand signals, the resulting total is easier to trace back to clear inputs and to replicate each year.


Key Questions Answered in the Report
What is the projected size of the protein market by 2031?
The protein market is expected to reach USD 14.62 billion by 2031, advancing at a 7.70% CAGR from 2026.
Which application segment is forecast to grow the fastest?
Supplements are projected to record the highest CAGR at 8.98% between 2026 and 2031, outpacing food and beverage applications.
Why does Asia-Pacific lead in protein consumption?
High population density, increasing disposable income, and supportive government policies toward value-added processing have positioned Asia-Pacific as the largest regional contributor with 36.15% revenue share in 2025.
What is driving demand for plant-based protein sources?
Environmental concerns, dietary shifts among flexitarians and vegans, and technological improvements in flavor and texture are accelerating the adoption of plant-based proteins.
Page last updated on:


 Your data is secure and never sold or shared.


