Market Overview
| Study Period | 2021 - 2031 |
|---|---|
| Forecast Data Period | 2026 - 2031 |
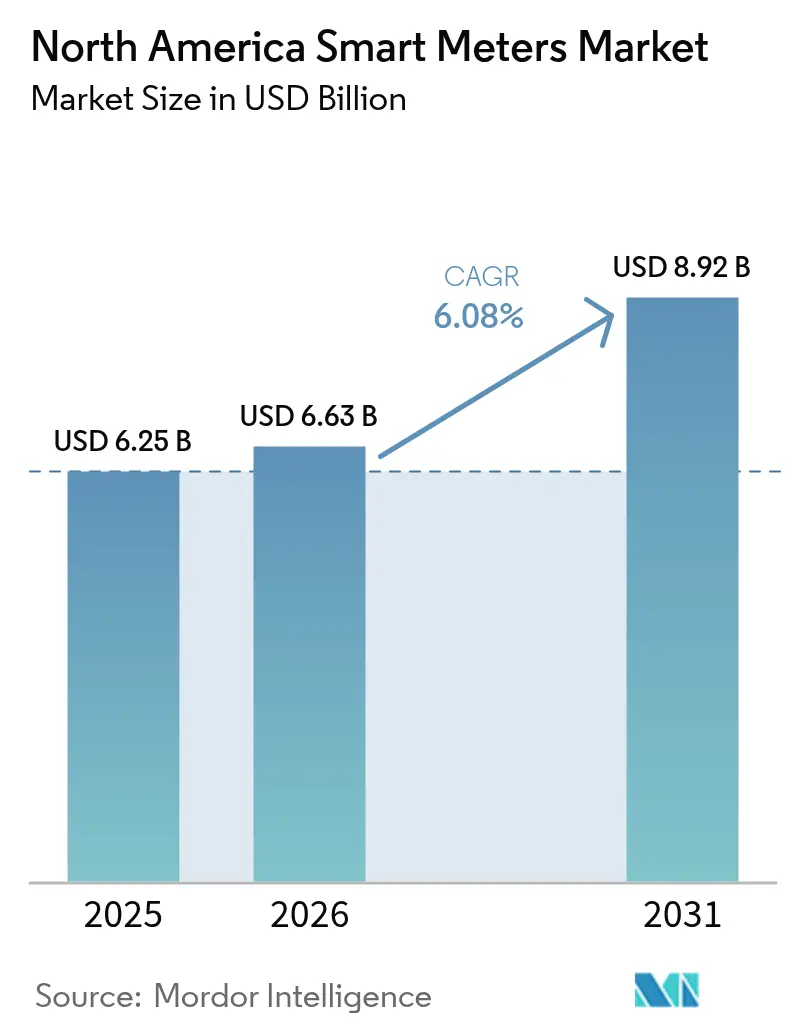
| Base Year Market Size (2025) | USD 6.25 Billion |
| Market Size (2026) | USD 6.63 Billion |
| Market Size (2031) | USD 8.92 Billion |
| Growth Rate (2026 - 2031) | 6.08% CAGR |
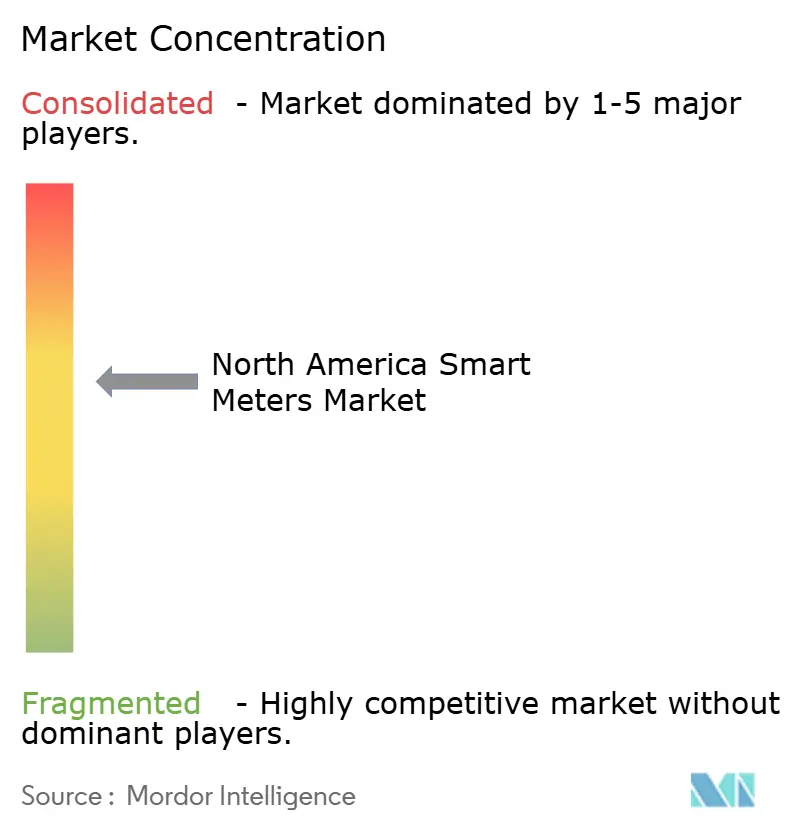
| Market Concentration | Medium |
Major Players *Disclaimer: Major Players sorted in no particular order Image © Mordor Intelligence. Reuse requires attribution under CC BY 4.0. | |
North America Smart Meters Market Analysis by Mordor Intelligence
The North America Smart Meters Market size is expected to grow from USD 6.25 billion in 2025 to USD 6.63 billion in 2026 and is forecast to reach USD 8.92 billion by 2031 at 6.08% CAGR over 2026-2031.
Continued modernization of transmission and distribution assets, direct federal appropriations for advanced metering infrastructure, and widening conservation mandates keep the upgrade wave intact across electric, water, and gas utilities. Smart meter penetration has already surpassed 80%, so the next growth leg pivots from first-wave roll-outs to AMI 2.0 replacements that embed edge computing, voltage optimization, and bidirectional measurement of distributed energy resources. Utility demand is further buoyed by real-time billing accuracy, shrinking truck rolls, and the need for granular consumption data that underpins dynamic pricing programs and customer engagement portals. Semiconductor supply-chain pressures have moderated since late 2024, yet component risk remains a gating factor that utilities manage through multi-year procurement contracts, strengthened vendor diversification, and higher safety inventories, sustaining purchasing momentum in the North America Smart Meters market.
Key Report Takeaways
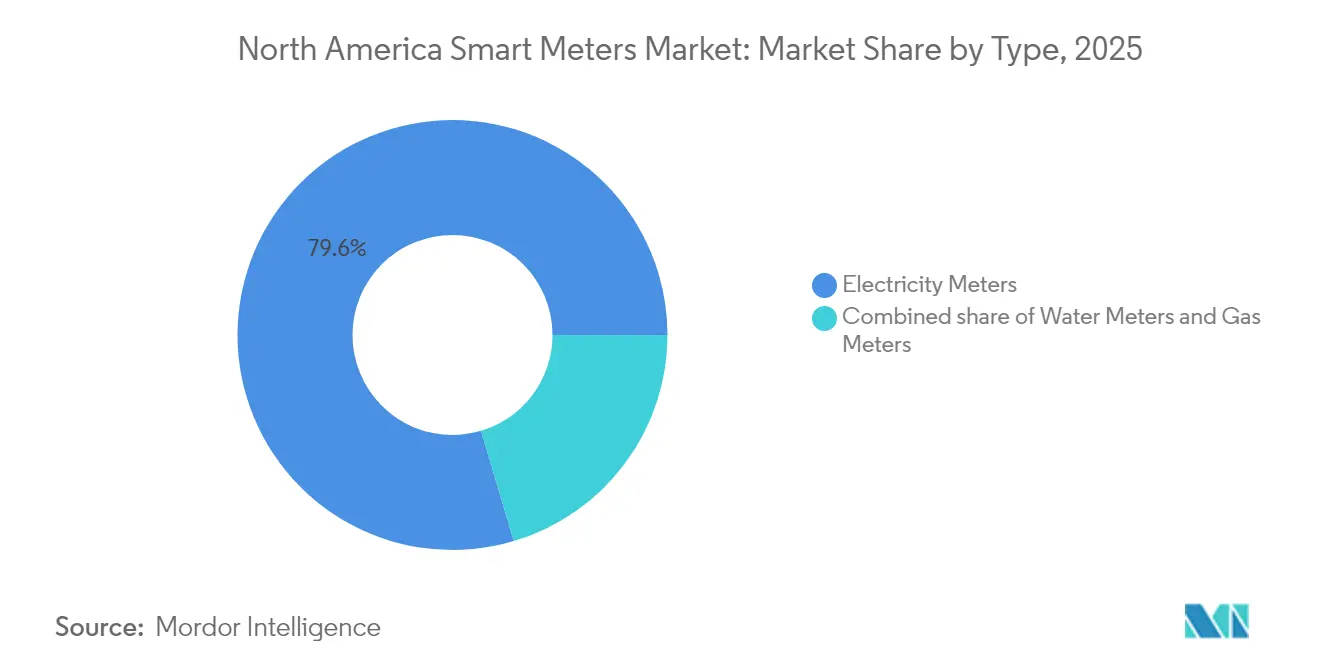
- By type, electricity meters held 79.60% of the North America Smart Meters market share in 2025, while water meters are projected to expand at a 7.20% CAGR through 2031.
- By communication technology, RF Mesh accounted for 47.20% of the North America Smart Meters market size in 2025, while cellular connectivity is advancing at a 6.80% CAGR to 2031.
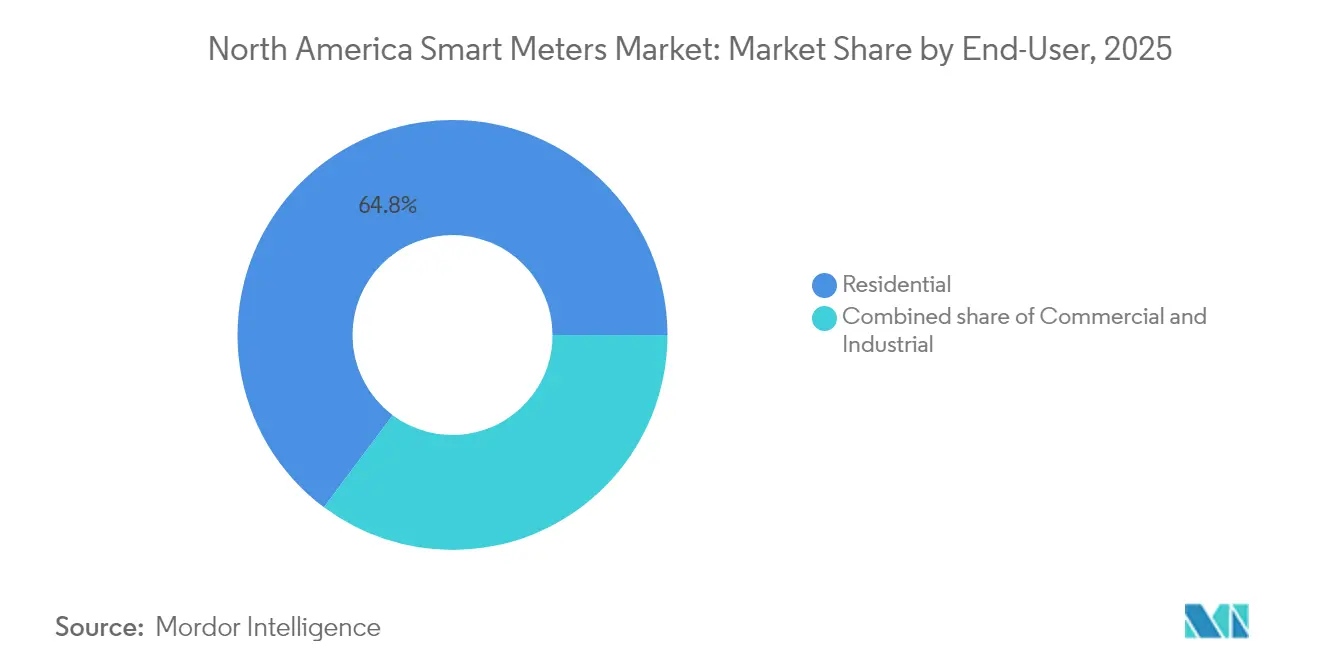
- By end-user, residential applications commanded 64.80% revenue in 2025; commercial deployments are rising at a 6.75% CAGR between 2026-2031.
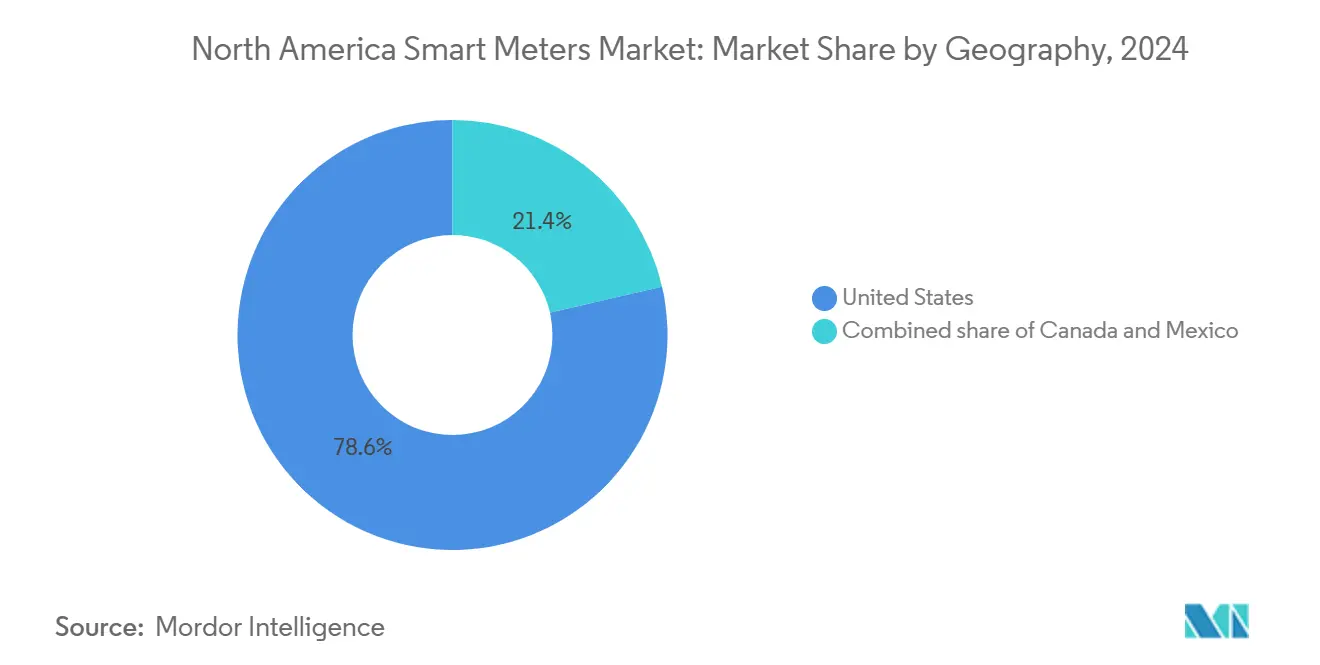
- Geographically, the United States controlled 78.00% of 2025 revenues, while Canada is set to expand at a 6.55% CAGR over the forecast horizon.
- Landis+Gyr and Itron shipped a combined 35-40% of annual units in 2024, underscoring a moderately concentrated supplier base.
Note: Market size and forecast figures in this report are generated using Mordor Intelligence’s proprietary estimation framework, updated with the latest available data and insights as of 2026.
North America Smart Meters Market Trends and Insights
Drivers Impact Analysis*
| Driver | (~) % Impact on CAGR Forecast | Geographic Relevance | Impact Timeline |
|---|---|---|---|
| Regulatory mandates for nationwide smart-electric meter roll-outs | +1.6% | United States, Canada | Medium term (2-4 years) |
| Utility-led grid-modernization programs | +1.4% | North America | Long term (≥ 4 years) |
| Federal and state funding for infrastructure upgrades | +1.1% | United States primarily | Short term (≤ 2 years) |
| Demand for real-time consumption data & accurate billing | +0.9% | North America | Medium term (2-4 years) |
| Bi-directional metering to integrate distributed energy resources | +0.8% | United States, Canada | Long term (≥ 4 years) |
| Water-utility time-of-use tariffs amid drought management | +0.6% | Western United States | Medium term (2-4 years) |
| Source: Mordor Intelligence | |||
Regulatory Mandates for Nationwide Smart-Electric Meter Roll-outs
Obligatory installation rules have transformed advanced metering from a discretionary technology into grid infrastructure. Ontario’s early directive, which has driven 90% time-of-use rate adoption, showed regulators across North America how tariff reform and smart-meter penetration can move in lockstep.[1]Energy Regulation Quarterly, “Time of Use Rates: An International Perspective,” energyregulationquarterly.ca California’s Assembly Bill 2572 applies parallel pressure in the water sector by requiring smart water meters at every home by 2025. New York’s Senate Bill S1550 adds a health-impact reporting layer, signaling expanded oversight while still keeping deployment engines running. Predictable compliance timelines give suppliers confidence to scale production capacity, locking in multi-year contracts that sustain volume for the North America Smart Meters market.
Utility-led Grid-Modernization Programs
Utilities are bundling AMI with distribution automation, voltage control, and outage management investments. The U.S. Department of Energy’s Smart Grid Investment Grant funded 99 projects valued at USD 8 billion, embedding advanced meters as the sensor backbone of modern grids.[2]U.S. Department of Energy, “Recovery Act: Smart Grid Investment Grant Program,” energy.gov Public Service Company of New Mexico alone earmarked USD 188 million for meter upgrades inside a broader USD 344 million modernization road map. Most firms now specify AMI 2.0 endpoints with extra processing power and memory, enabling on-board analytics that detect voltage anomalies and DER back-feed in real time, thus improving grid visibility while creating incremental revenue opportunities for analytics software providers.
Federal and State Funding for Infrastructure Upgrades
Direct appropriations, low-interest loans, and 50-50 cost-sharing agreements lower the capital hurdle for midsize municipal and cooperative utilities. The Biden-Harris administration’s USD 728 million Upper Colorado River Basin package embeds smart meters as explicit line items for drought resilience. Natural Resources Canada dedicates up to USD 100 million toward grid projects that must include AMI to qualify. El Paso Water Utilities leveraged a USD 5 million federal allocation to shave 36% off a 60,000-meter project’s cost base, accelerating installation by eighteen months. Funding dynamics, therefore, turn episodic procurement windows into a continuing pipeline for manufacturers serving the North America Smart Meters market.
Demand for Real-time Consumption Data & Accurate Billing
Consumers, commercial customers, and regulators share an expectation of transparent, high-frequency usage data. Time-of-use adoption has risen steadily, covering 8.7% of U.S. households in 2021, underpinned by a 69% residential smart-meter footprint. Pilots such as Snohomish PUD’s FlexEnergy shifted up to one-third of peak load, generating USD 25-40 annual savings per participant. In parallel, San Jose Water cut leak-duration times by 38% through automated alerts. These cases illustrate how real-time data unlocks conservation, billing equity, and customer-engagement metrics that reinforce the investment case for utilities while adding a durable pull factor for the North America Smart Meters market.
Restraints Impact Analysis*
| Restraint | (~) % Impact on CAGR Forecast | Geographic Relevance | Impact Timeline |
|---|---|---|---|
| High upfront meter & installation costs | -1.0% | North America | Short term (≤ 2 years) |
| Cyber-security and data-privacy concerns | -0.7% | United States, Canada | Medium term (2-4 years) |
| Semiconductor supply-chain volatility | -0.5% | North America | Short term (≤ 2 years) |
| Local pushback over RF-emission health fears | -0.3% | United States primarily | Medium term (2-4 years) |
| Source: Mordor Intelligence | |||
High Upfront Meter & Installation Costs
Smart meters cost five to seven times more than legacy analog devices once field labor, communications modules, and back-office integration are included. San Jose Water’s USD 100 million outlay for 230,000 units equates to roughly USD 435 per endpoint. BC Hydro’s province-wide program required CAD 2 billion (USD 1.5 billion) but promises CAD 520 million (USD 390 million) in net present value by 2033. Rate cases often allow recovery through tariff adders, yet smaller cooperatives with limited borrowing power sometimes stretch deployments over eight to ten years, dampening near-term installation volumes and injecting episodic demand variance into the North America Smart Meters market.
Cyber-security and Data-privacy Concerns
Penetration testing has shown that compromised meters can relay false data or even disconnect service remotely.[3]IEEE Access, “Experimental Evaluation of Smart Electric Meters’ Resilience Under Cyber Security Attacks,” ieeexplore.ieee.org The U.S. Department of Energy warns that a coordinated cyberattack could produce cascading outages if endpoint security is weak. Privacy advocates note that 15-minute interval data can infer household occupancy patterns, prompting several commissions to allow opt-outs or line-item surcharges to cover anonymization expenses. Such requirements raise compliance costs, elongate deployment timelines, and modestly temper customer acceptance rates within the North America Smart Meters market.
*Our forecasts treat driver/restraint impacts as directional, not additive. The impact forecasts reflect baseline growth, mix effects, and variable interactions.
Segment Analysis
By Type: Electricity Infrastructure Meets Water Conservation Urgency
Electricity meters generated 79.60% of 2025 revenue, underscoring their anchor role in the North America Smart Meters market. Mandatory replacement schedules and 111 million deployed endpoints across the United States ensure a steady AMI 2.0 refresh cycle. Utilities value voltage analytics, outage detection, and service disconnection features that help recoup theft losses and reduce O&M spending.
Water meters, though only 13.10% of 2025 revenue, are outpacing every other device category at a 7.20% CAGR. Conservation mandates, leak-reduction targets, and state-funded drought resilience programs drive growth, with utilities like San Francisco rolling out 180,000 units under a USD 56 million budget. American Water has already surpassed 1 million installations, reporting 38% leak-duration reductions and a double-digit cut in non-revenue water.
Gas meters comprise the remaining share. Their modest unit growth is buoyed by safety regulations that mandate remote shut-off and methane-leak detection. Several utilities bundle electric, gas, and water installations to maximize truck-roll efficiency, a practice that further increases total addressable volume for the North America Smart Meters market.


By Communication Technology: Proven Reliability Versus Emerging Connectivity
RF Mesh retained a 47.20% share in 2025, reflecting decades of utility familiarity and self-healing network characteristics. Landis+Gyr alone supports more than 300 million mesh-connected endpoints globally. Though often proprietary, mesh architectures deliver predictable latency and use unlicensed spectrum, keeping recurring fees low.
Cellular connectivity, however, is advancing at a 6.80% CAGR. Honeywell’s integration of Verizon 5G modules illustrates utility interest in carrier-grade uptime and the ability to bypass network-maintenance obligations. Cellular IoT modules also simplify rural roll-outs where low meter density undermines mesh economics. As spectrum licensing costs drop and data plans become utility-grade affordable, analysts expect cellular share to converge with RF Mesh by the early 2030s, reshaping technology preferences in the North America Smart Meters market.
By End-User: Residential Scale Drives Commercial Innovation
Residential deployments accounted for 64.80% of 2025 unit volume. Broad-based mandates in Massachusetts, California, and Texas underpin multi-million-unit roll-out schedules. Eversource, for instance, will cover every Massachusetts household by 2028 under a three-year, two-phase program starting in 2025. Staging large-scale residential programs slashes per-unit install costs and accelerates payback for software-as-a-service analytics that overlay usage insights.
Commercial customers represent 26% of volume but generate higher average selling prices because meters must often interface with building-management systems and third-party energy dashboards. Businesses are under mounting pressure to disclose Scope 2 emissions, boosting demand for 15-minute interval data and automated load-shifting algorithms. Time-of-use tariffs tailored to commercial operations can shave peak-period bills by 12-18%, strengthening the cost-benefit case for networked metering.
Industrial sites are a smaller slice yet attract specialized offerings like harmonic detection and power-quality analytics. While their low meter count translates into modest volume impact, they yield premium margins and allow vendors to upsell bundled software. Across all customer types, the pivot from simple billing to data-rich services is central to value creation in the North America Smart Meters industry.
Geography Analysis
The United States dominates the landscape, generating 78.00% of 2025 revenue. Federal provisions in the Infrastructure Investment and Jobs Act direct USD 3 billion toward utilities lacking AMI, which accelerates catch-up deployments. California’s water meter mandate, Texas’s retail competition, and New York’s cybersecurity reporting rules together show that regulatory diversity does not impede meter adoption; instead, it widens functionality requirements that suppliers must meet. An installed base of 97.7 million smart meters creates a sizable replacement pool, ensuring long-run stability in the North America Smart Meters market.
Canada, while smaller in absolute terms, posts the highest forecast growth at 6.55% CAGR. Natural Resources Canada’s USD 100 million Smart Grid Program ties funding eligibility to AMI functionality, prompting utilities in Alberta and Manitoba to follow Ontario’s earlier lead. Provinces leverage lessons from British Columbia’s full deployment, compressing planning timelines and focusing on cybersecurity from project inception. Provincial carbon-pricing regimes further incentivize the adoption of interval data to validate greenhouse-gas reporting.
Mexico remains nascent but critical for regional expansion. Comisión Federal de Electricidad’s commitment to replace 910,399 meters under a USD 492 million tender is the latest milestone in a modernization strategy covering its 48.8 million-customer footprint. Creation of the National Energy Commission streamlines approvals, and the federal emphasis on loss reduction positions AMI as a core tool for tackling 11% non-technical losses. International vendors view Mexico as a volume bridge once U.S. penetration peaks, adding fresh demand contours to the North America Smart Meters market.
Competitive Landscape
Supplier power is moderate. Landis+Gyr and Itron collectively shipped between 35% and 40% of units in 2024, allowing them to wield scale in component sourcing and lifecycle services contracts. Still, a healthy ecosystem of niche specialists in water metering, communications modules, and security software keeps switching costs in check. Itron’s revenue rose 9.71% in Q3 2024, with net income climbing 95.59%, partly due to software that upsells analytics on top of hardware. Landis+Gyr garners 58% of its sales from the Americas, underscoring regional dependence and focus on localized partnerships.
Strategic alliances are multiplying. Itron’s tri-party pact with Schneider Electric and Microsoft fuses distributed intelligence, SCADA integration, and cloud analytics, letting utilities map every transformer-to-meter relationship in real time. Landis+Gyr’s collaboration with SPAN enables circuit-level visibility, critical for electrification upgrades and EV charger planning. ABB’s acquisition of Lumin opens a pathway to residential load-control hardware that pairs naturally with its meter portfolio.[6]ABB, “ABB Expands Residential Energy Management with Lumin Acquisition,” abb.com
North America Smart Meters Industry Leaders
Landis+Gyr
Itron
Xylem (Sensus)
Schneider Electric
Honeywell International
- *Disclaimer: Major Players sorted in no particular order

Recent Industry Developments
- May 2025: Eversource announced the kick-off of the installation of its inaugural smart meters at residences and businesses across Western Massachusetts, with the rollout extending into the subsequent months.
- March 2025: Itron, Schneider Electric, and Microsoft unveiled an edge-to-cloud platform that embeds transformer mapping and volt-VAR optimization in a single interface, slated for release by year-end.
- March 2025: Itron and CHINT Global launched the first DLMS GCP-compliant residential meter, promising lower integration costs for utilities standardizing on Version 2.0 AMI.
- January 2025: ABB closed its purchase of Lumin, widening its residential energy-management offering and positioning to serve 48 million U.S. homes needing panel upgrades.


North America Smart Meters Market Report Scope
The scope of the North American smart meters market report includes:
By Type
| Electricity Meters |
| Water Meters |
| Gas Meters |
By Communication Technology
| RF Mesh |
| Power-Line Communication (PLC) |
| Cellular |
| Other Short-Range (Wi-Fi, Zigbee, BLE) |
By End-User
| Residential |
| Commercial |
| Industrial |
By Geography
| United States |
| Canada |
| Mexico |
| By Type | Electricity Meters |
| Water Meters | |
| Gas Meters | |
| By Communication Technology | RF Mesh |
| Power-Line Communication (PLC) | |
| Cellular | |
| Other Short-Range (Wi-Fi, Zigbee, BLE) | |
| By End-User | Residential |
| Commercial | |
| Industrial | |
| By Geography | United States |
| Canada | |
| Mexico |


Key Questions Answered in the Report
How large is the North America Smart Meters market in 2026?
It is valued at USD 6.63 billion and is projected to reach USD 8.92 billion by 2031, reflecting a 6.08% CAGR.
Which device category leads installations?
Electricity meters account for 79.60% of 2025 revenue, underlining their central role in grid operations.
Why are water meters growing faster than other segments?
Drought mandates and conservation targets in western states push utilities toward interval-data water meters, driving a 7.20% CAGR.
What share do RF Mesh networks still hold?
RF Mesh represents 47.20% of installed communications links, although cellular is closing the gap with a 6.80% CAGR.
Which country is expanding most quickly?
Canada shows the fastest growth at a 6.55% CAGR, supported by federal funding and provincial modernization plans.
Who are the leading suppliers?
Landis+Gyr and Itron together shipped 35-40% of units in 2024, with ABB, Honeywell, and Kamstrup among notable challengers.
Page last updated on:


