
Market Overview
| Study Period | 2020 - 2031 |
|---|---|
| Market Size (2026) | USD 591.48 Billion |
| Market Size (2031) | USD 772.38 Billion |
| Growth Rate (2026 - 2031) | 5.47 % |
| Fastest Growing Market | Asia Pacific |
| Largest Market | Europe |
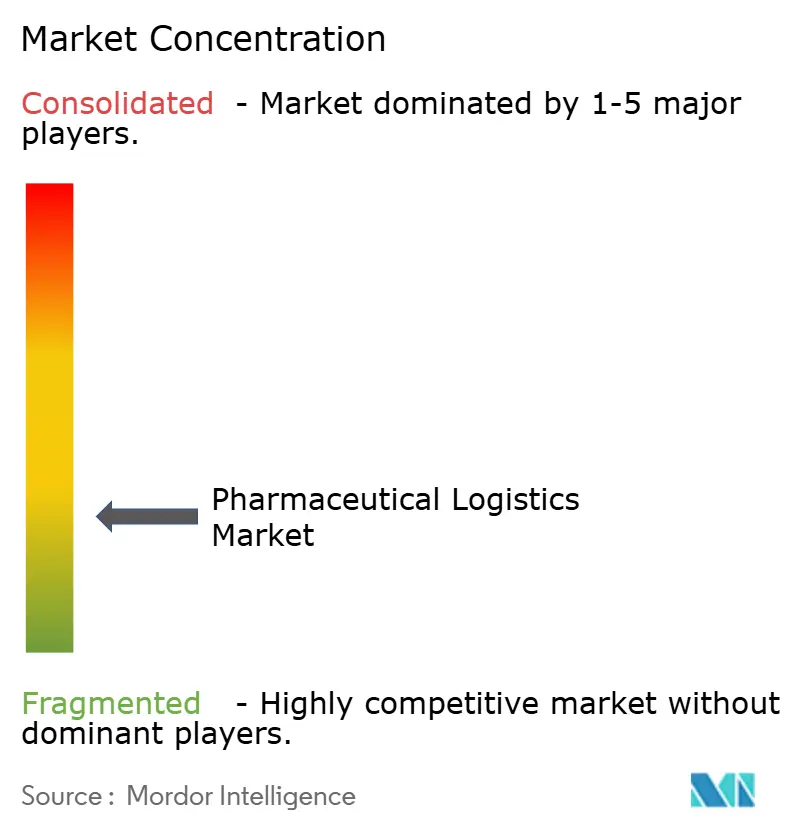
| Market Concentration | Low |
Major Players *Disclaimer: Major Players sorted in no particular order Image © Mordor Intelligence. Reuse requires attribution under CC BY 4.0. | |
Pharmaceutical Logistics Market Analysis by Mordor Intelligence
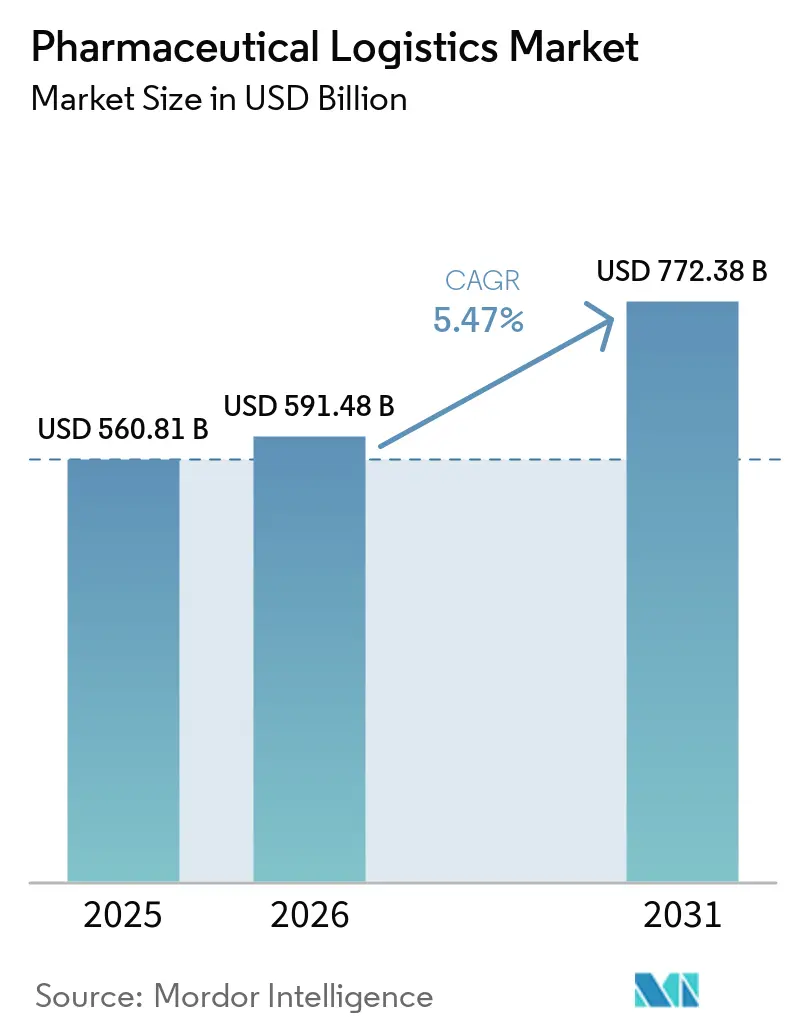
The Pharmaceutical Logistics Market size was valued at USD 560.81 billion in 2025 and estimated to grow from USD 591.48 billion in 2026 to reach USD 772.38 billion by 2031, at a CAGR of 5.47% during the forecast period (2026-2031).
Robust growth stems from biologics proliferation, rigorous serialization mandates, and the pivot toward direct-to-patient delivery models that require precision distribution capacities. Strong capital spending by global integrators, sustained e-pharmacy adoption, and expanding temperature-controlled infrastructure continue to intensify competition while enlarging addressable demand for end-to-end, compliant supply-chain solutions. Technology deployment—particularly IoT sensors, blockchain traceability, and AI-driven network optimization—has accelerated as stakeholders guard against temperature excursions and counterfeit risk. At the same time, sustainability commitments are redirecting capacity toward intermodal and ocean transportation to curb emissions, opening new service niches for specialty providers. Price pressures linked to cold-chain energy costs and multi-jurisdictional compliance remain headwinds, yet they also spur investment in low-carbon packaging, regionalized inventories, and alternative fuels that ultimately expand the pharmaceutical logistics market.
Key Report Takeaways
- By service type, transportation services held 51.40% of the pharmaceutical logistics market share in 2025, while value-added services are forecast to grow at a 4.42% CAGR to 2031.
- By mode of operation, non-cold-chain logistics accounted for 64.20% of the pharmaceutical logistics market size in 2025, whereas cold-chain logistics is poised to advance at a 5.57% CAGR through 2031.
- By product type, prescription drugs secured a 30.60% revenue share of the pharmaceutical logistics market size in 2025; cell & gene therapies are projected to expand at a 6.12% CAGR to 2031.
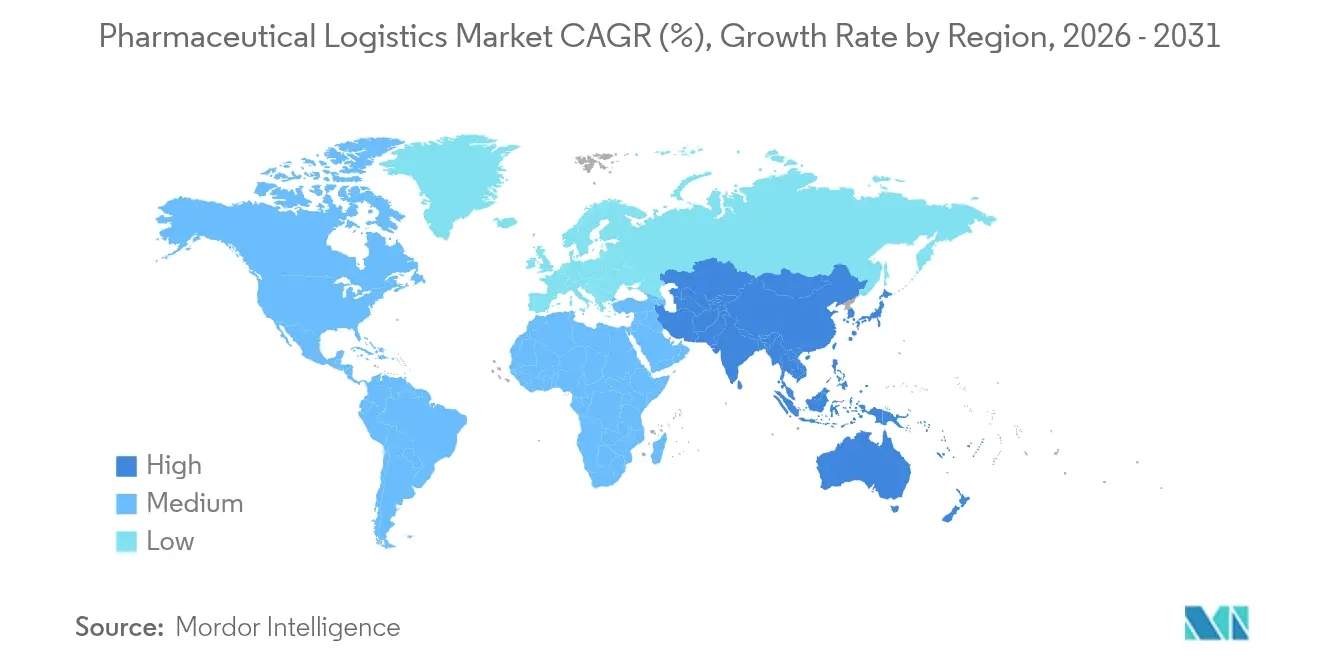
- By geography, Europe led with 31.70% of the pharmaceutical logistics market share in 2025, while Asia-Pacific is expanding at a 5.02% CAGR through 2031.
Note: Market size and forecast figures in this report are generated using Mordor Intelligence’s proprietary estimation framework, updated with the latest available data and insights as of 2026.
Market Trends and Insights
Drivers Impact Analysis of Pharmaceutical Logistics Market*
| Driver | (~) % Impact on CAGR Forecast | Geographic Relevance | Impact Timeline |
|---|---|---|---|
| Expansion of online pharmacies | +0.8% | Global, with early gains in North America, Europe, Asia-Pacific | Medium term (2-4 years) |
| Rising OTC-medicine demand & chronic-disease burden | +0.6% | Global, concentrated in aging populations across developed markets | Long term (≥ 4 years) |
| Acceleration of biologics & vaccine cold-chain needs | +1.2% | Global, with emphasis on North America, Europe manufacturing hubs | Short term (≤ 2 years) |
| Outsourcing surge to 3PL/4PL specialists | +0.9% | Global, particularly strong in Asia-Pacific and North America | Medium term (2-4 years) |
| Mandatory end-to-end IoT / blockchain track-and-trace | +0.7% | North America & EU regulatory leadership, spillover to APAC | Medium term (2-4 years) |
| Net-zero logistics investments driving infrastructure renewal | +0.5% | Global, with EU and North America leading sustainability mandates | Long term (≥ 4 years) |
| Source: Mordor Intelligence | |||
Expansion of Online Pharmacies
Nearly half of consumers now prefer ordering medicines online, compelling carriers to engineer door-step delivery networks that secure 2 °C–8 °C conditions for sensitive products. Providers in Asia-Pacific leverage digital payments and telehealth platforms to scale ambient and refrigerated parcel services, while U.S. integrators enhance last-mile visibility through IoT-enabled pack-out solutions. Regulators have responded by extending serialization and track-and-trace to the single-unit level, raising compliance hurdles but also differentiating operators that offer real-time temperature and location data. As e-pharmacy volumes climb, network redesign toward micro-fulfillment hubs tightens lead-times, improving medication adherence and fueling incremental demand across the pharmaceutical logistics market.
Rising OTC-Medicine Demand & Chronic-Disease Burden
OTC formulations carry less-stringent handling rules than prescription drugs, enabling blended transport lanes that cut storage costs for integrated distributors. However, the rising prevalence of diabetes and cardiovascular disease forces continual replenishment cycles that intensify throughput requirements for time-critical inventory. Logistics partners exploit automation, such as robotic pick-and-pack and smart blister packaging, to combine OTC and chronic-care medications within unified flows that reduce dwell time. Hybrid models improve asset utilization and sustain profitability within the pharmaceutical logistics market while enhancing service quality for pharmacies and clinics.
Acceleration of Biologics & Vaccine Cold-Chain Needs
Sixty percent of new drug approvals anticipated by 2030 involve biologics or gene therapies that require 2 °C–8 °C or even −196 °C cryogenic preservation. DHL earmarked EUR 2 billion (USD 2.08 billion) to enlarge GDP-certified hubs and liquid-nitrogen capabilities, underscoring investment urgency. Advanced therapy medicinal products also demand synchronized pickup and patient infusion, driving real-time control-tower solutions that triangulate manufacturing slots, flight availability, and clinical appointments. These rigorously timed moves create premium-yield lanes that reinforce overall expansion of the pharmaceutical logistics market.
Outsourcing Surge to 3PL/4PL Specialists
Temperature-controlled warehousing, global trade compliance, and specialty packaging now require expertise beyond the scope of most drug manufacturers. Pharmaceutical firms, therefore, award multi-year contracts to integrators and specialty forwarders that bundle regulatory know-how with worldwide infrastructure. Fourth-party logistics orchestrators aggregate multiple providers and furnish a single visibility layer, lowering complexity for brand owners and strengthening market stickiness for service partners[1]“Direct To Patient, Clinical Trial Supply Chain,” World Courier, worldcourier.com. The shift elevates recurring revenues and supports sustained capital deployment across the pharmaceutical logistics market.
Restraints Impact Analysis of Pharmaceutical Logistics Market*
| Restraint | (~) % Impact on CAGR Forecast | Geographic Relevance | Impact Timeline |
|---|---|---|---|
| High cost of temperature-controlled distribution | -0.9% | Global, with acute impact in emerging markets lacking infrastructure | Short term (≤ 2 years) |
| Complex & divergent global compliance standards | -0.6% | Global, with particular complexity in cross-border operations | Medium term (2-4 years) |
| Shortage of advanced phase-change packaging materials | -0.4% | Global, with supply constraints affecting specialized cold-chain applications | Short term (≤ 2 years) |
| Last-mile biologic delivery bottlenecks in emerging markets | -0.3% | APAC, MEA, Latin America with infrastructure limitations | Medium term (2-4 years) |
| Source: Mordor Intelligence | |||
High Cost of Temperature-Controlled Distribution
Cold-chain failures cost drug makers an estimated USD 35 billion each year, reflecting write-offs, repackaging, and penalty shipments. Passive packaging with phase-change materials can extend protection to 96 hours but often doubles per-parcel expenses, placing strain on emerging-market programs where funding is scarce. The need for redundant monitoring equipment and qualified staff compounds overhead, limiting profit margins for smaller carriers within the pharmaceutical logistics market. Innovation in low-carbon refrigerants and reusable totes aims to reduce cost per shipment, yet wide deployment remains constrained by initial capital outlay.
Complex & Divergent Global Compliance Standards
EU GDP, U.S. DSCSA, and a patchwork of Asia-Pacific rules force operators to maintain multiple label formats, validation documents, and data-exchange protocols. Serialization interoperability challenges persist, especially when blockchain pilots operate alongside linear barcode systems, creating duplication and risk of data mismatch[2]“GMP Update 2024/2025,” ECA Academy, gmp-journal.com. Brexit-driven license splitting and new Latin American import rules further strain resources, leading some mid-sized forwarders to exit certain corridors. Harmonization efforts progress slowly, keeping compliance costs elevated across the pharmaceutical logistics market.
*Our forecasts treat driver/restraint impacts as directional, not additive. The impact forecasts reflect baseline growth, mix effects, and variable interactions.
Pharmaceutical Logistics Market Segment Analysis
By Service Type:
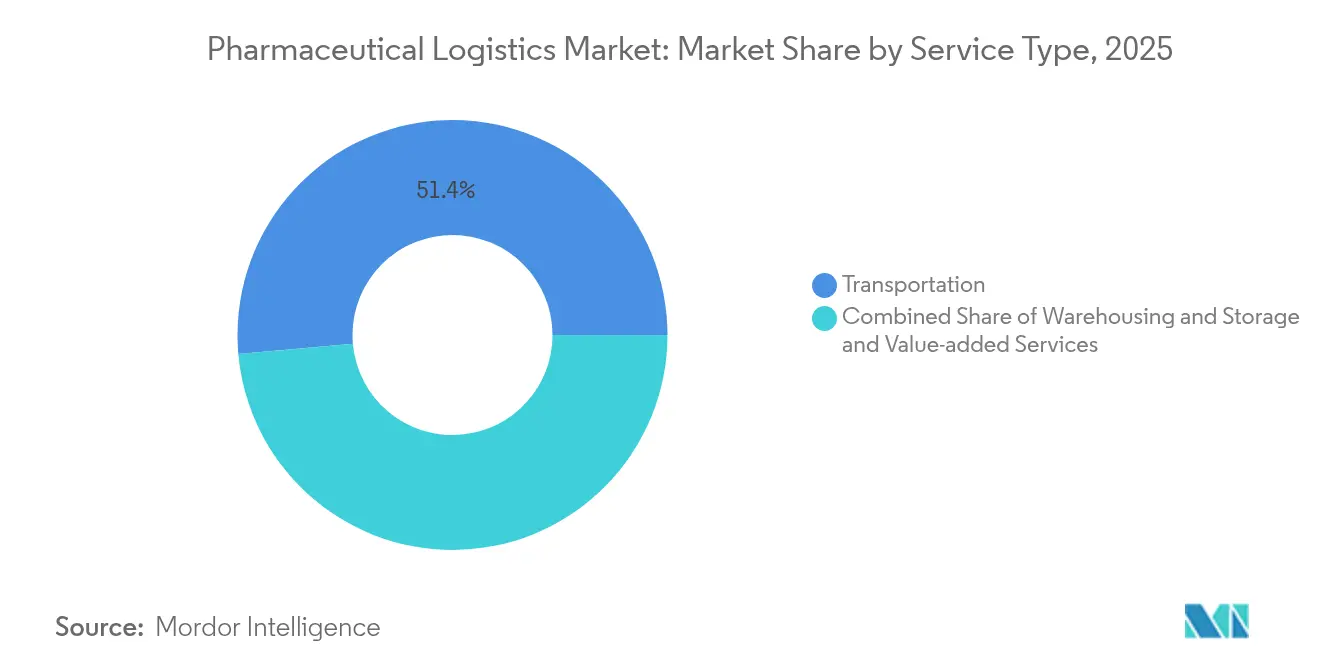
Transportation Dominates While Value-Added Services AccelerateTransportation generated 51.40% of 2025 revenue, illustrating that physical movement remains the backbone of the pharmaceutical logistics market. Road freight captures regional flows, particularly across Europe and North America, while air freight underpins long-haul biologics replenishment with next-day service guarantees. Ocean lanes gain relevance as shippers pursue sustainable options, leveraging GDP-compliant reefer containers to curb emissions.
Value-added services, growing at a 4.42% CAGR, include labeling, secondary packaging, order kitting, and serialization consulting that relieve manufacturers of non-core tasks. Demand rises fastest in Asia-Pacific, where contract manufacturers seek single-source partners to handle regulatory printing in multiple languages. As data integrity rules tighten, certified relabeling and tamper-evident pack-outs transform from optional extras into procurement prerequisites, driving incremental margin across the pharmaceutical logistics market.



By Mode of Operation:
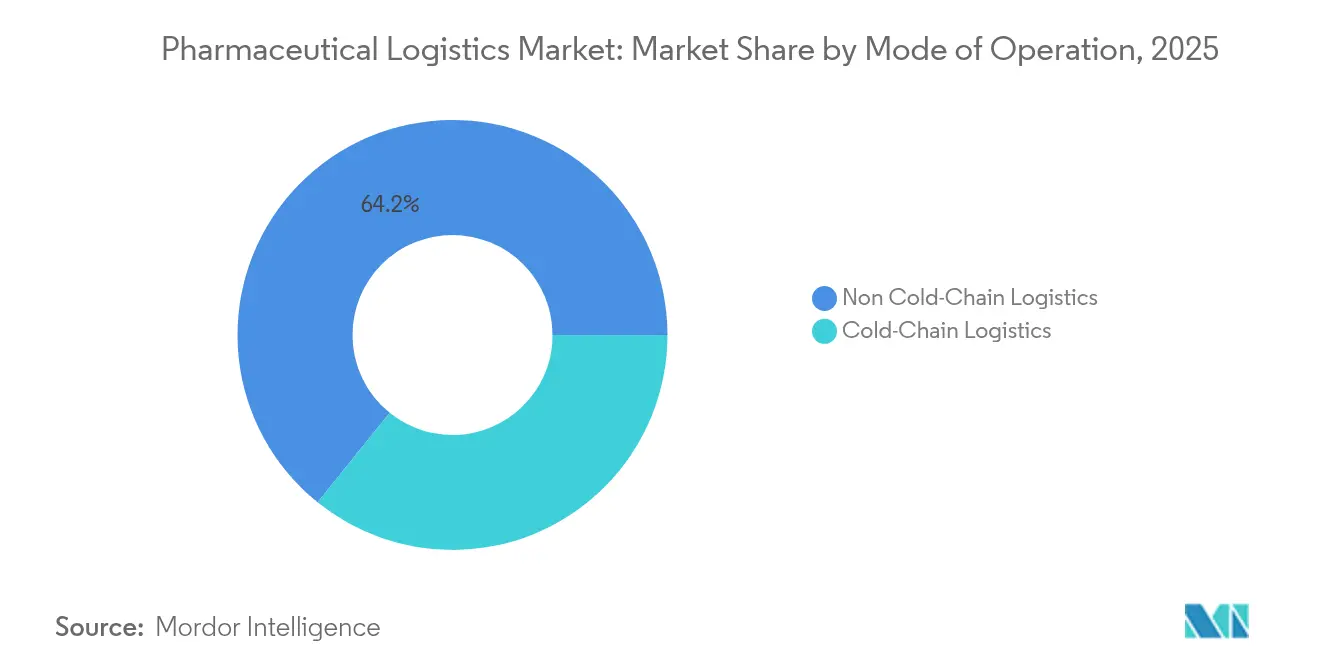
Cold-Chain Expansion Redefines Asset AllocationNon-cold-chain flows still comprise 64.20% of 2025 throughput, yet cold-chain volumes expand faster as biologics, vaccines, and specialty injectables proliferate. Dedicated 2 °C-8 °C cross-dock corridors integrate real-time telemetry, allowing proactive intervention before excursions occur. Hybrid DCs equipped with multi-zone chambers optimize footprint, enabling operators to toggle between ambient and refrigerated storage within the same building to protect the global pharmaceutical logistics market size.
Ultra-low and cryogenic services form a high-margin micro-segment. UPS’s acquisition of Frigo-Trans and BPL adds bulk liquid-nitrogen capacity and 24/7 command centers. Passive packaging innovations, vacuum-insulated panels, PCM bricks, and nitrogen-charged dewars, extend lane coverage in regions where active containers are unavailable, enhancing service density and supporting broader pharmaceutical logistics market growth.
By Product Type:
Cell & Gene Therapies Trigger Premium Service DemandPrescription drugs represented 30.60% of the 2025 value and continue to leverage mature distribution protocols that balance cost and quality. However, precision-medicine launches complicate ambient routing as a rising share of prescription items requires refrigerated handling.
Cell & gene therapies, forecast to rise at a 6.12% CAGR, demand cryogenic preservation, chain-of-identity safeguards, and synchronized pick-up at manufacturing suites minutes after release. Providers that embed validated −196 °C holding rooms and GPS-enabled dry shippers command premium rates, reinforcing differentiation within the pharmaceutical logistics market. Broader biologics and biosimilar portfolios further enlarge cold-chain lane density, permitting economies of scale in dry-ice replenishment, PCM pooling, and validated lane certification.
Geography Analysis
Europe Pharmaceutical Logistics Market
Europe maintained a 31.70% revenue share in 2025, underpinned by harmonized GDP enforcement, dense road networks, and large-scale manufacturing clusters in Germany, Switzerland, and Ireland. Investment in cross-border rail-air corridors supports modal shifts that lower emissions without compromising lead times. The pharmaceutical logistics market size in Europe benefits from continual capacity additions such as Cold Chain Technologies’ new Netherlands hub, which augments regional PCM production and reduces transit risk.
North America Pharmaceutical Logistics Market
North America remains a powerhouse thanks to DSCSA-driven serialization maturity and sustained public-sector funding for pandemic preparedness. DHL allocated 50% of its EUR 2 billion (USD 2.08 billion) plan to U.S. and Canadian facilities, integrating solar-powered warehouses and LNG trucks that curb emissions while preserving service standards. Combined with FedEx’s USD 440 million expansion of healthcare distribution centers, the region continues to redefine best practices around data visibility and sustainability.
APAC and MEA Pharmaceutical Logistics Market
Asia-Pacific is expected to post the fastest growth at 5.02% CAGR from 2026 to 2031, buoyed by increased production out of China and India, widening insurance coverage, and e-pharmacy proliferation. Governments incentivize cold-chain upgrades, as evidenced by India’s 2025 tax rebates on GDP-compliant warehousing equipment. Regional carriers deploy rail-truck sea-air solutions along the China-Europe corridor, trimming cost and cutting transit emissions. Middle East & Africa trail in infrastructure, yet Gulf Cooperation Council localization programs spur warehouse investment, securing future pharmaceutical logistics market expansion.

Regulatory Landscape
Pharmaceutical logistics regulation is tightening around end-to-end traceability, GDP compliance, and greater visibility into upstream supply origins. In the United States, DSCSA requirements are pushing unit-level serialized tracing and electronic data interoperability across trading partners, while 2026 legislative and rulemaking activity targets deeper supply chain oversight, including proposed changes tied to distributed manufacturing registration and enhanced registration expectations for foreign API manufacturing sites.
In Europe, Good Distribution Practice (GDP) remains the primary compliance framework for storage, transport, and wholesale distribution, with the EMA maintaining operational guidance for wholesale distribution authorizations and parallel distribution procedures, including updates to Union-format documentation (updated in 2024). In Asia, China has moved to standardize modern pharmaceutical logistics through NMPA guidance that strengthens computerized management systems and traceability requirements, reducing provincial variance and raising the bar for 3PLs and wholesalers operating across regions.
Value Chain Analysis
The pharmaceutical logistics value chain runs from API sourcing and drug manufacturing through primary and secondary packaging, release and QA, and multi-tier distribution via wholesalers, hospital pharmacies, retail and e-pharmacies, and direct-to-patient channels. Logistics providers operate across transport (air, road, ocean, and intermodal), temperature-controlled warehousing, and value-added services such as labeling, kitting, and serialization support, with compliance layers (EU GDP, U.S. DSCSA) increasingly built into day-to-day operations through validated lanes, digital custody records, and exception management.
Bottlenecks tend to emerge where cold-chain integrity overlaps with documentation and data exchange, especially for biologics, vaccines, and cell and gene therapies that require strict temperature control and chain-of-identity. Network changes in 2026 highlighted upstream and corridor investments that reshape flows, including Maersk launching a weekly reefer rail service linking Hyderabad manufacturing to Nhava Sheva for export, and air cargo operators building GDP-certified temperature-controlled corridors between European gateways and U.S. hubs. Contract logistics is also a key orchestration layer, supported by CEVA Logistics extending its long-term agreement with GSK to run a dedicated pharmaceutical distribution center in Poland, which reinforces the move toward outsourced, site-specific pharma DC operations.
Competitive Landscape
Consolidation accelerates as capital-intensive temperature-controlled assets raise barriers to entry. DHL’s EUR 2 billion (USD 2.08 billion) pledge through 2030 spans new GDP hubs in Chicago, São Paulo, and Singapore, while UPS’s USD 1.6 billion purchase of Andlauer Healthcare Group widens Canadian cryogenic reach. FedEx counters with expansions that add redundant power and automated picking tailored to clinical-trial returns.
Niche specialists such as Cryoport anchor the ultra-cold segment by combining validated dewars with 24/7 control towers, often partnering with integrators for first-mile collection. IoT start-ups like Controlant supply disposable trackers that feed real-time data into cloud dashboards, enabling predictive interventions that reduce excursion risk. Blockchain pilots led by TraceLink and IBM receive FDA endorsement, positioning compliant platforms as key differentiators in upcoming DSCSA milestones.
Competitive intensity also rises among cold-storage REITs—Lineage, Americold, and Nichirei—as they purchase regional facilities to embed pharmaceutical-grade chambers into wider food networks, boosting utilization and diversifying revenue. Overall, differentiation hinges on global reach, validated cold-chain capacity, and integrated digital visibility that collectively strengthen customer lock-in and expand the pharmaceutical logistics market.
Pharmaceutical Logistics Industry Leaders
Deutsche Post DHL
Kuehne + Nagel
UPS
FedEx
Nippon Express
- *Disclaimer: Major Players sorted in no particular order
Pharmaceutical Logistics Market Companies Covered in this Report
- Deutsche Post DHL
- Kuehne + Nagel
- UPS
- FedEx
- Nippon Express
- World Courier
- SF Express
- CEVA Logistics
- DSV
- Kerry Logistics
- C.H. Robinson
- Lineage Logistics
- United States Cold Storage
- Americold Logistics
- Nichirei Logistics Group
- Kloosterboer
- NewCold Advanced Cold Logistics
- VersaCold Logistics Services
- Rhenus Logistics
- Cencora

Market Opportunities and Future Outlook
One opportunity centers on compliance-led digitalization and operational services that help manufacturers and distributors execute unit-level traceability while keeping cold-chain integrity intact, especially where DSCSA-style serialization and interoperability requirements increase the cost of non-compliance. Capacity and capability build-outs in 2026 reflect this, including UPS investing USD 48 million across 27 temperature-controlled freight cross-dock facilities aligned with IATA CEIV Pharma standards, and FedEx launching a dedicated Life Sciences organization supported by global Life Sciences Centers and CEIV Pharma Corporate Certification for ground handling.
Another whitespace is purpose-built temperature-controlled warehousing and cross-docking near manufacturing clusters and air-ocean interfaces to shorten dwell time and reduce excursion risk, including ambient-to-ultra-cold requirements. Facility moves show where providers are placing assets: Movianto (Yusen Logistics) expanded its Aalst, Belgium site, increasing temperature-controlled pallet capacity from 14,000 to 25,000 spaces, and GEODIS opened a temperature-controlled pharma and healthcare facility in Manchester with additional pallet positions for inventory and cross-docking. Regulatory attention on distributed manufacturing and foreign API oversight, including the FDA publishing a proposed rule in July 2026 to amend establishment registration requirements, also supports demand for logistics partners that can manage tighter provenance, documentation, and multi-node distribution models.
Recent Industry Developments in Pharmaceutical Logistics Market
- July 2026: FedEx launched a dedicated Life Sciences organization, supported by a network of global Life Sciences Centers and CEIV Pharma Corporate Certification for ground handling. The move formalizes a specialized operating model for pharma and biotech shipments that require tighter SOPs, visibility, and exception management across lanes. It also positions FedEx to bundle air, ground, and solutions capabilities more directly around clinical, biologics, and temperature-sensitive distribution needs.
- August 2025: UPS Healthcare expanded global cold chain capabilities by adding 20 cross-dock facilities and extending IATA CEIV Pharma certifications across 18 locations. This expanded footprint increases throughput capacity for temperature-sensitive freight and supports standardized handling across geographies. The additional certified nodes strengthen UPS Healthcare offerings for biopharma, specialty pharma, and time-critical replenishment lanes.
- April 2024: UPS completed the acquisition of Frigo-Trans and its sister company BPL. The deal added temperature-controlled logistics capabilities and specialized healthcare handling capacity in Europe, complementing UPS Healthcare distribution and transport networks. It also widened service coverage for high-complexity pharma flows that demand validated storage, transport, and monitoring.


Pharmaceutical Logistics Market Report Scope and Research Methodology
Market Definition and Coverage
For this study, the pharmaceutical logistics market is defined as paid logistics services that move, store, and handle pharmaceutical and related healthcare products across the supply chain, including temperature-controlled and ambient flows, and the compliance processes needed to keep product integrity.
Scope exclusions: We exclude pure drug manufacturing value and pure retail pharmacy margins, and we count logistics services revenue rather than the value of medicines inside the shipment.
Segments Covered in This Report
- By Service Type
- Transportation
- Road Freight
- Air Freight
- Sea Freight
- Rail Freight
- Warehousing & Storage
- Value-added Services and Others
- Transportation
- By Mode of Operation
- Cold-Chain Logistics
- Non-Cold-Chain Logistics
- By Product Type
- Prescription Drugs
- OTC Drugs
- Biologics & Biosimilars
- Vaccines & Blood Products
- Clinical Trail Materials
- Cell & Gene Therapies
- Medical Devices & Diagnostics
- Veterinary Medicine
- Others
- By Geography
- North America
- United States
- Canada
- Mexico
- South America
- Brazil
- Peru
- Chile
- Argentina
- Rest of South America
- Asia-Pacific
- India
- China
- Japan
- Australia
- South Korea
- South East Asia (Singapore, Malaysia, Thailand, Indonesia, Vietnam, and Philippines)
- Rest of Asia-Pacific
- Europe
- United Kingdom
- Germany
- France
- Spain
- Italy
- BENELUX (Belgium, Netherlands, and Luxembourg)
- NORDICS (Denmark, Finland, Iceland, Norway, and Sweden)
- Rest of Europe
- Middle East and Africa
- United Arab of Emirates
- Saudi Arabia
- South Africa
- Nigeria
- Rest of Middle East And Africa
- North America
Data Sources, Market Sizing, and Validation
Desk Research
Desk research was used to build the structure of the market model and to anchor it to observable trade and distribution signals. We referenced public sources such as WHO guidance on good distribution practice, US FDA materials on drug supply chain security, EMA GDP guidance, UN Comtrade for pharma-related trade flows, and OECD health statistics to understand demand direction by region.
We also reviewed annual reports, investor decks, and press releases of logistics and cold chain operators to map service mixes and typical pricing levers. Where needed, we used paid subscriptions for company financials and news, an import-export shipment-level database to sanity check lane activity, and patent databases to spot cold-chain monitoring and packaging intensity trends. The sources listed here are illustrative only, and additional public and paid references were used to collect, cross-check, and clarify specific data points.
Primary Interviews and Surveys
Primary work focused on validating what desk sources cannot show clearly, like how much spend sits in cold chain versus ambient, how fast biologics-related handling is growing, and how GDP compliance costs are passed through. We spoke with a mix of logistics providers, specialty carriers, packaging and monitoring participants, and pharma supply chain teams across APAC, EMEA, and the Americas to pressure-test assumptions and align the final sizing ranges.
Distribution of primary research fieldwork respondents
Distribution of primary research fieldwork respondents
| Company type | Respondent position | Region |
|---|---|---|
| Top tier: 27% | CXOs: 14% | APAC: 40% |
| Mid tier: 59% | Functional/Unit leaders: 39% | EMEA: 33% |
| Smaller Players: 14% | Managers: 47% | Americas: 27% |
Market-Sizing & Forecasting
The sizing starts with a top-down demand pool build that reconstructs pharma distribution activity by region using trade intensity, manufacturing footprint, and healthcare consumption direction, which are then translated into addressable logistics spend. From there, we corroborate totals with selective bottom-up checks, such as sampling typical warehousing and transport pricing, reviewing capacity footprints, and using provider revenue disclosures to confirm the order of magnitude.
Inputs that shaped the model include cold-chain penetration by product mix (especially vaccines and biologics), average temperature-controlled handling premiums, air versus ocean modal split for time-sensitive lanes, warehouse throughput and storage dwell time patterns, and compliance-driven packaging and monitoring intensity. Forecasts are produced using scenario analysis, where growth paths are tied to biologics share, specialty therapy adoption, cross-border shipment growth, and expected normalization of freight and energy costs. The results are then adjusted using what interviewees see in contracted volumes and service-level changes. When bottom-up signals were missing for smaller markets, we filled gaps using proxy ratios from similar trade lanes, and then rechecked the implied spend per shipment against expert feedback.
Data Validation & Update Cycle
Validation is done in layers so that single-source bias is reduced before sign-off. We check model outputs against independent signals like pharma trade values, air cargo indicators for time and temperature-sensitive flows, and announced capacity additions in cold storage and specialized transport.
Outliers are flagged, investigated, and corrected after revisiting the underlying driver assumptions, and follow-up outreach is triggered when a key variable moves sharply or a region breaks its historical pattern. Reports are refreshed annually, with interim updates when material events occur, and a final pre-delivery pass is completed so clients receive the most current view available.
Mordor Intelligence's Global Pharmaceutical Logistics Market Sizing Compared With Other Published Estimates
Published market sizes for pharmaceutical logistics often look far apart because each publisher draws the line around different service revenue pools and product handling needs, and then applies its own time frame and currency treatment. In practice, the spread usually comes from what gets counted as logistics services versus what gets counted as the value of goods moving through the chain.
The main gap comes from whether the estimate captures the full outsourced logistics services stack across temperature-controlled and ambient flows, and the way Mordor Intelligence counts transportation, warehousing and storage, and value-added services while avoiding adding the value of the medicines inside the shipment. Differences also show up when one model leans heavily on provider revenues while another leans on pharma trade values, or when inflation assumptions for freight, packaging, and monitoring are carried forward without rechecking against fresh contracts.
Benchmark comparison
| Source | Market Size | Gaps in Research Methodology |
|---|---|---|
| Mordor Intelligence | USD 560.81 B (2025) | |
| Global Consultancy A | USD 80.56 B (2025) | This figure appears to focus on a narrower definition of logistics spending and can exclude parts of warehousing, value-added services, or broader healthcare product handling, which compresses the total versus a full service-stack view. |
| Trade Journal B | USD 138.71 B (2025) | This approach includes select pharma logistics revenues and may treat bundled goods within the service offering differently, and the growth path can be influenced by short-term rate assumptions that lift the near-year number. |
Looking across the table, most of the variance is explained by scope choices and how service revenue is separated from product value. By keeping the inputs tied to observable shipment activity, service mix, and validated pricing levers, the final number remains traceable to clear variables that can be checked and repeated over time.


Key Questions Answered in the Report
How large is the pharmaceutical logistics market in 2026?
The pharmaceutical logistics market size is USD 591.48 billion in 2026 and is forecast to grow at a 5.47% CAGR to 2031.
Which service segment generates the most revenue?
Transportation services account for 51.40% of 2025 revenue, reflecting the sector’s core requirement for global product movement.
Why is cold-chain capacity expanding so rapidly?
Biologics, vaccines, and cell & gene therapies require temperatures from 2 °C to −196 °C, pushing carriers to add cryogenic storage, IoT monitoring, and GDP-certified hubs that drive 5.57% CAGR in cold-chain services.
Which region is growing fastest?
Asia-Pacific leads in growth at a 5.02% CAGR through 2031, supported by expanding drug manufacturing in China and India and broader healthcare access.
What is the key challenge to global pharmaceutical logistics compliance?
Divergent regulations, EU GDP, U.S. DSCSA, and varying Asia-Pacific rules, force operators to maintain multiple tracking standards and validation documents, elevating cost and complexity.
Page last updated on:




