North America Satellite Manufacturing Market Size and Share
Market Overview
| Study Period | 2017 - 2030 |
|---|---|
| Forecast Data Period | 2025 - 2030 |
| Historical Data Period | 2017 - 2023 |
| Market Size (2025) | USD 184.4 Billion |
| Market Size (2030) | USD 269.5 Billion |
| Growth Rate (2025 - 2030) | 7.88% CAGR |
| Market Concentration | High |
Major Players*Disclaimer: Major Players sorted in no particular order Image © Mordor Intelligence. Reuse requires attribution under CC BY 4.0. | |

North America Satellite Manufacturing Market Analysis by Mordor Intelligence
The North America Satellite Manufacturing Market size is estimated at 184.4 billion USD in 2025, and is expected to reach 269.5 billion USD by 2030, growing at a CAGR of 7.88% during the forecast period (2025-2030).
The North American satellite manufacturing landscape is experiencing an unprecedented transformation, driven by increasing commercialization and technological advancements in the space sector. Private companies like SpaceX, Blue Origin, and Boeing are making substantial investments in space manufacturing technology, fostering innovation and reshaping traditional industry dynamics. The sector has demonstrated remarkable growth, with the region witnessing the launch of 4,351 satellites during 2017-2022, marking a significant 61% increase in launch activity from 2021 to 2022. This surge in satellite production reflects the industry's robust response to growing demand across various applications, from communications to Earth observation.
The commercial space sector is witnessing accelerated development through strategic public-private partnerships and increased government support. NASA's budget allocation of USD 26 billion in 2023, representing a 5.6% increase from the previous year, underscores the government's commitment to space exploration and satellite manufacturing technology advancement. These investments are facilitating groundbreaking initiatives, such as Amazon's Kuiper Systems securing Federal Communications Commission approval to launch 1,500 satellites by 2026, with plans to expand to 3,236 satellites by 2029 for global broadband internet services.
Manufacturing capabilities in the region have significantly expanded, with companies adopting advanced production techniques and automated assembly lines. SpaceX, for instance, maintains an impressive production rate of 120 satellites per month across its four facilities, demonstrating the industry's ability to meet growing demand through efficient spacecraft manufacturing processes. This manufacturing prowess is particularly evident in the Low Earth Orbit (LEO) segment, where North American organizations have successfully deployed over 3,000 satellites, establishing a strong foundation for various space-based services.
The industry is witnessing a shift toward more sophisticated satellite applications, particularly in areas such as electronic intelligence, Earth science, meteorology, laser imaging, and optical imaging. Companies are increasingly focusing on developing specialized satellites for specific applications, leading to more diverse and capable satellite constellations. This specialization is supported by advanced manufacturing techniques and innovative technologies, enabling the production of satellites with enhanced capabilities and longer operational lifespans. The trend toward specialized applications is particularly evident in the growing number of Earth observation and communication satellites being deployed, with manufacturers developing customized solutions to meet specific customer requirements.
North America Satellite Manufacturing Market Trends and Insights
Rising Demand for Satellite Miniaturization in North America
- The ability of small satellites to perform nearly all of the functions of traditional satellites at a fraction of their cost has increased the viability of building, launching, and operating small satellite constellations. Small satellites are being preferred for scientific research and military and defense sector applications. Small satellites typically have shorter development cycles, and smaller development teams can be produced on the same production line and are cheaper to launch into orbit. Revolutionary technological advancements facilitated the miniaturization of electronics, reducing the satellite bus size and mass over time for manufacturers. During the historical period, a total of 580 nanosatellites were placed into orbit by various players in the region.
- The demand from North America is primarily driven by the United States, which manufactures the largest number of small satellites each year. The country's launches have increased over the last three years, which shows the country's huge potential. In addition, the ongoing investments in startups and the nano and microsatellite development projects are expected to boost growth in the region.
- Currently, NASA is involved in several projects aimed at developing these satellites. NASA is making use of CubeSats for conducting advanced exploration, demonstrating newly emerging technologies for conducting scientific research and educational investigations. The Canadian government is emphasizing the development of necessary skill sets for nanosatellite development at the university level. For instance, Wyvern, a Canadian startup, aims at providing relatively low-cost access to hyperspectral imaging taken from a low Earth orbit with the help of CubeSats.
,-Number-of-Launches,-North-America,-2017---2022.svg)


Investment Opportunities in the North American Satellite Manufacturing Market
- In North America, government expenditure for space programs hit a record of approximately USD 24.8 billion in 2022. The region is the epicentre of space innovation and research, with the presence of the world's biggest space agency, NASA. In 2022, the US government spent nearly USD 62 billion on its space programs, making it the highest spender on space in the world. In the United States, federal agencies receive funding from Congress every year worth USD 32.33 billion for their subsidiaries.
- In January 2023, according to the Canadian government, the Canadian space sector added USD 2.3 billion to the Canadian GDP and employed 10,000 people. The government reported that 90% of Canadian space firms are small- and medium-sized businesses. The Canadian Space Agency (CSA) budget is modest, and the estimated budgetary spending for 2022-23 was USD 329 million.
- Space agencies spend available budgetary resources by making financial promises called obligations. For instance, until February 2023, the National Aeronautics and Space Administration (NASA) distributed USD 333 million as research grants. The Canadian Space Agency (CSA) announced an opportunity for the Canadian space science community to advance its knowledge of space in atmospheric and Earth-system science, lunar gateway/Artemis technology application, planetary exploration, space astronomy, and solar-terrestrial science. In April 2022, three grants totalling USD 132,831 thousand were awarded to Canadian universities to support projects that use data collected by AstroSat to understand better how stars are formed.

OTHER KEY INDUSTRY TRENDS COVERED IN THE REPORT
- Medium and Micro Satellites are Poised to Create Demand in the Market
Segment Analysis: Application
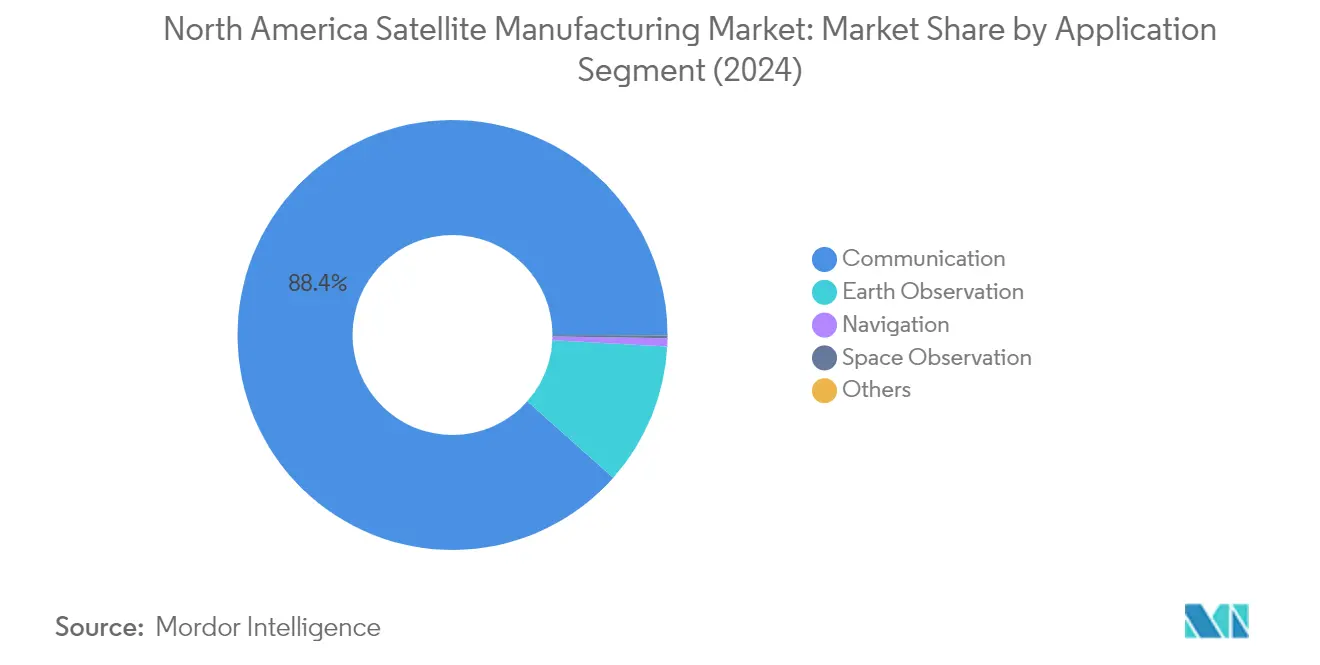
Communication Segment in North America Satellite Manufacturing Market
The communication segment dominates the North American satellite manufacturing market, commanding approximately 88% market share in 2024. This substantial market presence is driven by the increasing demand for uninterrupted connectivity across various applications, including weather forecasting, media and entertainment, aviation, television, internet, and telecommunication services. The segment's growth is further bolstered by the rising demand for motion communication solutions across military vehicles, utility vehicles, ships, and trains. Major private companies like SpaceX, Telesat, and Lockheed Martin are emphasizing better connectivity for the transportation industry, communication backbones for Internet of Things (IoT) devices, fleet management, remote maintenance, and direct-to-consumer market services through satellite communication.

Earth Observation Segment in North America Satellite Manufacturing Market
The Earth observation segment is experiencing significant growth in the North American satellite manufacturing market, with an expected growth rate of approximately 9% during 2024-2029. This growth is primarily driven by the increasing adoption of Earth observation satellites for various applications, including environmental monitoring, spy satellites, and non-military purposes. The segment's expansion is supported by multiple new projects with increased spending capabilities to provide better services to users on the surface. Companies are actively investing in improving existing Earth monitoring capabilities, focusing on providing scientists with new data on core climate systems and processes, including extreme storms, surface water and oceans, and atmospheric conditions.
Remaining Segments in Application Segmentation
The remaining segments in the North American satellite manufacturing market include navigation, space observation, and other specialized applications. The navigation segment serves crucial functions in global positioning systems and satellite-based communication systems, particularly important for military applications and civilian navigation needs. The space observation segment focuses on studying planets, asteroids, comets, and other celestial bodies, contributing significantly to research and exploration initiatives. The other specialized applications segment encompasses various niche uses, including educational purposes, mission extensions, experimental platforms, and technological demonstrations, each playing a unique role in advancing satellite technology and applications.
Segment Analysis: Satellite Mass
100-500kg Segment in North America Satellite Manufacturing Market
The 100-500kg satellite segment dominates the North American satellite manufacturing market, accounting for approximately 87% market share in 2024. Mini satellites in this mass range compete effectively with larger satellites across many applications, leveraging miniaturized but redundant electronics and field-programmable gate arrays (FPGAs) rather than hardware. These satellites are particularly valuable for collecting data related to agriculture, mineral exploration, urban development, border and maritime security, forestry, ocean resources, and disaster management applications. Most satellites in this category carry propulsion systems for orbit correction, which significantly extends their service life and operational capabilities. The segment's strong market position is driven by the ability to deliver high-performance capabilities at optimized costs while maintaining reliability for both commercial and military applications.
Below 10kg Segment in North America Satellite Manufacturing Market
The Below 10kg segment, comprising nanosatellites, is projected to experience the fastest growth rate of approximately 9% during 2024-2029. This rapid growth is driven by advances in miniaturization and reduced costs, making these satellites increasingly attractive for Earth observation, communication, and remote sensing applications. The segment's expansion is particularly notable in the commercial sector, where companies are leveraging these cost-effective satellites for constellation deployments. For instance, Planet Labs continues to manufacture and deploy SuperDove satellites weighing approximately 6 kg each, while companies like Swarm Technologies are focusing on ultra-small satellites for low-bandwidth satellite connectivity solutions. The increasing adoption of nanosatellites in various industries, coupled with their lower manufacturing and launch costs, is expected to drive significant growth in this segment.
Remaining Segments in Satellite Mass Market
The remaining segments in the satellite mass market include the Above 1000kg, 500-1000kg, and 10-100kg categories, each serving specific market needs. The Above 1000kg segment primarily caters to large remote sensing payloads and communication systems requiring extensive transponder and antenna capabilities. The 500-1000kg medium-sized satellites segment focuses on specialized military and defense applications, while the 10-100kg microsatellite segment serves medium-term applications with lifespans up to two years. These segments complement each other by providing various options for different mission requirements, from short-term experimental projects to long-duration operational missions, contributing to the market's overall diversity and capability range.
Segment Analysis: Orbit Class
LEO Segment in North America Satellite Manufacturing Market
The Low Earth Orbit (LEO) segment dominates the North American satellite manufacturing market, commanding approximately 96% market share in 2024, driven by the increasing deployment of satellite constellations for various applications. The segment's prominence is largely attributed to the advantages LEO satellites offer, including shorter signal runtimes, lower latency in communications, and reduced propagation delays. Major companies like SpaceX and Amazon's Kuiper Systems are actively expanding their presence in this orbit class, with SpaceX receiving permission to launch 7,500 satellites for its Gen2 Starlink constellation and Kuiper Systems planning to deploy over 3,200 satellites. The segment is experiencing robust growth, projected to expand at nearly 9% through 2024-2029, supported by increasing investments in satellite internet connectivity, Earth observation capabilities, and technological advancements in satellite miniaturization. The competitive landscape in the LEO segment remains dynamic, with multiple players focusing on developing innovative solutions for global broadband connectivity, remote sensing, and communication applications.
Remaining Segments in Orbit Class
The Geostationary Earth Orbit (GEO) and Medium Earth Orbit (MEO) segments complement the LEO segment in the North American satellite manufacturing market, each serving distinct applications and requirements. GEO satellites, positioned at approximately 35,786 km above the Earth's equator, are primarily utilized for applications requiring consistent coverage over specific geographical areas, such as weather monitoring, telecommunications, and broadcasting services. The MEO segment, operating at altitudes around 20,000 km, plays a crucial role in navigation systems, military communications, and surveillance applications. Both segments continue to evolve with technological advancements, with manufacturers developing more efficient and capable satellites to meet the growing demands of commercial and military users. The strategic importance of these orbits remains high, particularly for applications requiring stable, long-term orbital positions and wide geographical coverage.
Segment Analysis: End User
Commercial Segment in North America Satellite Manufacturing Market
The commercial segment dominates the North American satellite manufacturing market, accounting for approximately 88% of the total market value in 2024. This significant market share is primarily driven by the increasing demand for satellite-based services across various industries, including telecommunications, broadcasting, navigation, and remote sensing. The segment's growth is particularly fueled by major satellite constellation projects from companies focusing on global broadband connectivity. Private companies are leveraging satellite systems for multiple applications, with a particular emphasis on high-speed internet connectivity in remote areas. The commercial sector's dominance is further strengthened by innovative technologies and lower costs of manufacturing and deploying satellites, which has enabled numerous new players to enter the market and launch their own satellites for various commercial applications.
Military & Government Segment in North America Satellite Manufacturing Market
The military and government segment is projected to be the fastest-growing segment in the North American satellite manufacturing market, with an expected growth rate of approximately 9% during 2024-2029. This robust growth is driven by increasing defense budgets and the growing importance of space-based assets for military operations. The segment's expansion is supported by the rising need for faster strategic communication systems, tactical data links, and modern network-centric battle force capabilities. The US Space Force's increasing collaboration with major defense companies for developing key projects such as missile tracking systems is expected to further accelerate growth. Additionally, advances in electronic warfare technology and the development of new technologies to enhance the capabilities of military C4ISR are serving as key drivers for this segment's rapid expansion.
Remaining Segments in End User Segmentation
The other end user segment in the North American satellite manufacturing market primarily consists of research institutions, colleges, and non-governmental organizations. This segment plays a crucial role in advancing space research and technology development through various satellite projects. Technical research institutes in the region are significant developers of satellites for space-related research, technology development, and Earth observation. The segment benefits from dedicated funding from regional governments and the private sector for research and innovation in the space sector. These institutions contribute to the overall market by conducting innovative experiments and developing new technologies that often find applications in commercial and military sectors.
Segment Analysis: Satellite Subsystem
Propulsion Hardware and Propellant Segment in North American Satellite Manufacturing Market
The propulsion hardware and propellant segment dominates the North American satellite manufacturing market, commanding approximately 78% of the total market share in 2024. This segment's prominence is driven by the increasing demand for satellite propulsion systems that enable orbit transfers and position adjustments in space. The segment's growth is supported by major space agencies and private companies investing in advanced propulsion technologies, particularly for new satellite constellations. Chemical propulsion systems continue to be the preferred choice when strong thrust or rapid maneuvering is required, while electric propulsion systems are gaining traction for station-keeping applications in commercial communication satellites. Leading companies like Northrop Grumman, Moog Inc., Sierra Nevada Corporation, SpaceX, and Blue Origin are actively developing and supplying various propulsion systems to meet the growing demand from both commercial and government sectors.
Satellite Bus & Subsystems Segment in North American Satellite Manufacturing Market
The satellite bus and subsystems segment is experiencing the fastest growth in the market, with a projected growth rate of approximately 17% during 2024-2029. This rapid growth is driven by increasing investments in miniaturized electronics and technological advancements that enable the creation of more lightweight and affordable satellite buses while providing enhanced capabilities. The segment is witnessing significant innovation in areas such as modular designs, standardized interfaces, and advanced materials. Multiple satellite programs focusing on creating space constellations are driving demand, with technology giants like SpaceX and Amazon disclosing plans to launch thousands of satellites in various orbital configurations. The development of cost-effective, high-performance satellite buses and customer ground transceivers is particularly crucial for implementing new spaceborne low-latency broadband internet systems to meet growing consumer demands across the world.
Remaining Segments in Satellite Subsystem
The solar array and power hardware segment plays a crucial role in providing essential power generation capabilities for satellites, with companies developing increasingly efficient and lightweight solar panel technologies. The structures, harness, and mechanisms segment focuses on providing the physical framework and mechanical systems necessary for satellite operations, including sophisticated antenna systems and deployment mechanisms. Both segments are experiencing significant technological advancements, particularly in areas such as advanced materials, miniaturization, and improved efficiency. These segments are essential for ensuring reliable satellite operations and are benefiting from increased investments in space technology and the growing demand for satellite-based services across various applications, including communications, Earth observation, and scientific research.
Segment Analysis: Propulsion Tech
Liquid Fuel Segment in North America Satellite Manufacturing Market
Liquid fuel propulsion systems dominate the North American satellite manufacturing market, accounting for approximately 73% market share in 2024. The segment's prominence is driven by its superior specific impulses compared to solid propulsion systems, resulting in greater efficiency and longer operational life for satellites. The ability to precisely control thrust levels and throttle engines allows for optimized maneuvers and efficient fuel usage, enabling extended mission durations and orbital adjustments. Major space agencies and private companies continue to invest heavily in liquid propulsion technology, focusing on reducing manufacturing costs while increasing fuel efficiency. The segment's growth is further supported by ongoing research and development activities aimed at developing more advanced and efficient propulsion technologies for various satellite applications.
Gas Based Segment in North America Satellite Manufacturing Market
The gas-based propulsion segment is experiencing rapid growth and is projected to expand at approximately 13% during 2024-2029. This growth is primarily attributed to the technology's high efficiency, controllability, reliability, and long lifespan, making it an ideal choice for various space missions. Cold gas propulsion technology, which uses compressed gas as propellant, has gained significant traction in various space applications, including satellite and spacecraft propulsion, as well as scientific research and exploration. The segment's expansion is further supported by ongoing innovations in gas-based thruster technologies, with companies developing new solutions that offer improved performance and reliability. The increasing adoption of environmentally friendly propulsion technologies and the rising demand for efficient satellite propulsion systems are expected to drive continued growth in this segment.
Remaining Segments in Propulsion Tech
The electric propulsion segment represents another significant technology in the satellite manufacturing market. Electric propulsion systems are particularly valuable for their ability to achieve thrust at high exhaust velocities while reducing the amount of propellant required compared to conventional methods. This technology has become increasingly important with the rise of small satellites and miniaturized electronics. The segment's growth is supported by ongoing research and development in energy handling technology and high-performance Hall-effect propulsion systems. The emergence of green emission initiatives has further encouraged the adoption of electric propulsion technologies, making it an increasingly attractive option for satellite manufacturers and operators looking to enhance their environmental sustainability credentials.
North America Satellite Manufacturing Market Geography Segment Analysis
North America Satellite Manufacturing Market in the United States
The United States dominates the North American satellite manufacturing landscape, commanding approximately 100% of the total market share in 2024. The country's leadership position is reinforced by the presence of major players like SpaceX, Lockheed Martin, and Northrop Grumman, who continue to push technological boundaries in satellite production. The robust framework for satellite design and manufacturing, particularly in the small satellite segment, has enabled the US to maintain its competitive edge. The country's space agencies and private companies are actively investing in advanced military satellites for communication and surveillance purposes, while also focusing on commercial satellite constellations for various applications. The emphasis on research and development, coupled with supportive government policies and substantial funding for space programs, has created a fertile environment for innovation in satellite manufacturing. The presence of sophisticated infrastructure and a skilled workforce has further strengthened the United States' position as the epicenter of satellite manufacturing in North America.
North America Satellite Manufacturing Market in Canada
Canada's satellite manufacturing market is projected to grow at a rate of approximately 6% during 2024-2029, driven by increasing investments in space technology and infrastructure. The country's satellite manufacturing capabilities are being enhanced through strategic government initiatives and private sector partnerships. Canada's focus on developing specialized satellite technologies, particularly in areas such as Earth observation and communications, has positioned it as an important player in the North American market. The Canadian Space Agency's continued support for research and development in satellite technology, coupled with investments in building necessary skill sets at the university level, has created a strong foundation for growth. The country's emphasis on fostering innovation in the space sector, particularly through support for small and medium-sized enterprises, has led to the emergence of several innovative satellite manufacturing companies. The government's commitment to ensuring nationwide high-speed internet coverage has also spurred demand for satellite manufacturing capabilities, particularly in the development of low Earth orbit satellite constellations.
North America Satellite Manufacturing Market in Other Countries
The satellite manufacturing landscape in other North American countries is characterized by emerging opportunities and growing interest in spacecraft manufacturing development. While these markets are still in their developmental stages compared to the United States and Canada, they are showing increasing potential for growth in satellite manufacturing capabilities. Various government initiatives and private sector investments are helping to establish the necessary infrastructure and expertise for satellite assembly operations. The focus is primarily on developing capabilities in small satellite manufacturing and assembly, with particular emphasis on applications in telecommunications and Earth observation. International partnerships and technology transfer agreements are playing crucial roles in helping these countries build their satellite manufacturing capabilities. The growing recognition of the strategic importance of space technology is driving increased investment in research and development facilities and human capital development in the satellite manufacturing sector across these nations.

Competitive Landscape
Top Companies in North America Satellite Manufacturing Market
The North American satellite manufacturing landscape is characterized by intense innovation and strategic developments among key players like SpaceX, Lockheed Martin, Maxar Technologies, and Northrop Grumman. Companies are heavily investing in research and development to enhance satellite production capabilities while simultaneously focusing on miniaturization and cost reduction. The industry has witnessed a significant shift towards reusable launch systems and mass production of satellites, particularly for constellation projects. Market leaders are expanding their manufacturing facilities and adopting advanced manufacturing techniques to increase production capacity and efficiency. Strategic partnerships and collaborations with government agencies, particularly in the defense and communication sectors, have become crucial for maintaining market position. Companies are also emphasizing vertical integration strategies to control the entire production chain, from component manufacturing to launch services.
Market Dominated by Established Defense Contractors
The North American satellite manufacturing market exhibits a relatively consolidated structure dominated by large defense contractors and specialized space technology companies. These established players leverage their long-standing relationships with government agencies, particularly the Department of Defense and NASA, to maintain their market positions. The market has high entry barriers due to the significant capital requirements, technical expertise, and regulatory compliance needs, which favor larger, established companies with robust financial resources and extensive experience in the aerospace sector.
The industry has witnessed selective merger and acquisition activities, primarily aimed at acquiring specialized technological capabilities or expanding market reach. Major players are increasingly focusing on vertical integration strategies, acquiring smaller companies with innovative technologies or specialized capabilities in areas such as artificial intelligence, machine learning, and advanced materials. This consolidation trend is particularly evident in the commercial satellite segment, where companies are seeking to strengthen their positions in the growing small satellite market and expand their capabilities in emerging applications.
Innovation and Adaptability Drive Future Success
Success in the North American satellite manufacturing market increasingly depends on companies' ability to adapt to rapidly evolving technology trends and changing customer requirements. Incumbent players need to focus on developing cost-effective manufacturing processes while maintaining high-quality standards and reliability. Companies must also invest in next-generation technologies such as artificial intelligence, advanced materials, and automated manufacturing processes to maintain their competitive edge. Building strong relationships with both government and commercial customers while diversifying product portfolios to address various market segments has become crucial for sustained growth.
For new entrants and smaller players, success lies in identifying and focusing on specific market niches where they can offer unique value propositions. This includes developing specialized capabilities in areas such as small satellite manufacturing, specific subsystems, or innovative propulsion technologies. Companies must also navigate complex regulatory requirements while maintaining flexibility to adapt to changing market conditions. The increasing focus on environmental sustainability and space debris mitigation will likely influence future competitive dynamics, requiring companies to incorporate these considerations into their product development and manufacturing processes. Building strategic partnerships with established players and maintaining strong relationships with key stakeholders in both government and private sectors will be crucial for long-term success. The role of satellite integration in ensuring seamless operations across different systems is becoming increasingly important in this context.
North America Satellite Manufacturing Industry Leaders
Capella Space Corp.
Lockheed Martin Corporation
Maxar Technologies Inc.
Northrop Grumman Corporation
Space Exploration Technologies Corp.
- *Disclaimer: Major Players sorted in no particular order


Recent Industry Developments
- December 2023: Planet Labs has built 12 Dove nanosatellites for Planet. These satellites are launched from Vostochny Cosmodrome.
- November 2023: Thales Alenia Space signed a contract with Inmarsat for the construction of Inmarsat-5 satellite. The satellite was launched aboard Ariane-5ECA
- July 2023: Planet Labs has built 48 Dove satellites. These satellites are launched from Baikonur Cosmodrome.


North America Satellite Manufacturing Market Report Scope
Communication, Earth Observation, Navigation, Space Observation, Others are covered as segments by Application. 10-100kg, 100-500kg, 500-1000kg, Below 10 Kg, above 1000kg are covered as segments by Satellite Mass. GEO, LEO, MEO are covered as segments by Orbit Class. Commercial, Military & Government are covered as segments by End User. Propulsion Hardware and Propellant, Satellite Bus & Subsystems, Solar Array & Power Hardware, Structures, Harness & Mechanisms are covered as segments by Satellite Subsystem. Electric, Gas based, Liquid Fuel are covered as segments by Propulsion Tech. Canada, United States are covered as segments by Country.| Communication |
| Earth Observation |
| Navigation |
| Space Observation |
| Others |
| 10-100kg |
| 100-500kg |
| 500-1000kg |
| Below 10 Kg |
| above 1000kg |
| GEO |
| LEO |
| MEO |
| Commercial |
| Military & Government |
| Other |
| Propulsion Hardware and Propellant |
| Satellite Bus & Subsystems |
| Solar Array & Power Hardware |
| Structures, Harness & Mechanisms |
| Electric |
| Gas based |
| Liquid Fuel |
| Canada |
| United States |
| Application | Communication |
| Earth Observation | |
| Navigation | |
| Space Observation | |
| Others | |
| Satellite Mass | 10-100kg |
| 100-500kg | |
| 500-1000kg | |
| Below 10 Kg | |
| above 1000kg | |
| Orbit Class | GEO |
| LEO | |
| MEO | |
| End User | Commercial |
| Military & Government | |
| Other | |
| Satellite Subsystem | Propulsion Hardware and Propellant |
| Satellite Bus & Subsystems | |
| Solar Array & Power Hardware | |
| Structures, Harness & Mechanisms | |
| Propulsion Tech | Electric |
| Gas based | |
| Liquid Fuel | |
| Country | Canada |
| United States |


Market Definition
- Application - Various applications or purposes of the satellites are classified into communication, earth observation, space observation, navigation, and others. The purposes listed are those self-reported by the satellite’s operator.
- End User - The primary users or end users of the satellite is described as civil (academic, amateur), commercial, government (meteorological, scientific, etc.), military. Satellites can be multi-use, for both commercial and military applications.
- Launch Vehicle MTOW - The launch vehicle MTOW (maximum take-off weight) means the maximum weight of the launch vehicle during take-off, including the weight of payload, equipment and fuel.
- Orbit Class - The satellite orbits are divided into three broad classes namely GEO, LEO, and MEO. Satellites in elliptical orbits have apogees and perigees that differ significantly from each other and categorized satellite orbits with eccentricity 0.14 and higher as elliptical.
- Propulsion tech - Under this segment, different types of satellite propulsion systems have been classified as electric, liquid-fuel and gas-based propulsion systems.
- Satellite Mass - Under this segment, different types of satellite propulsion systems have been classified as electric, liquid-fuel and gas-based propulsion systems.
- Satellite Subsystem - All the components and subsystems which includes propellants, buses, solar panels, other hardware of satellites are included under this segment.
| Keyword | Definition |
|---|---|
| Attitude Control | The orientation of the satellite relative to the Earth and the sun. |
| INTELSAT | The International Telecommunications Satellite Organization operates a network of satellites for international transmission. |
| Geostationary Earth Orbit (GEO) | Geostationary satellites in Earth orbit 35,786 km (22,282 mi) above the equator in the same direction and at the same speed as the earth rotates on its axis, making them appear fixed in the sky. |
| Low Earth Orbit (LEO) | Low Earth Orbit satellites orbit from 160-2000km above the earth, take approximately 1.5 hours for a full orbit and only cover a portion of the earth’s surface. |
| Medium Earth Orbit (MEO) | MEO satellites are located above LEO and below GEO satellites and typically travel in an elliptical orbit over the North and South Pole or in an equatorial orbit. |
| Very Small Aperture Terminal (VSAT) | Very Small Aperture Terminal is an antenna that is typically less than 3 meters in diameter |
| CubeSat | CubeSat is a class of miniature satellites based on a form factor consisting of 10 cm cubes. CubeSats weigh no more than 2 kg per unit and typically use commercially available components for their construction and electronics. |
| Small Satellite Launch Vehicles (SSLVs) | Small Satellite Launch Vehicle (SSLV) is a three-stage Launch Vehicle configured with three Solid Propulsion Stages and a liquid propulsion-based Velocity Trimming Module (VTM) as a terminal stage |
| Space Mining | Asteroid mining is the hypothesis of extracting material from asteroids and other asteroids, including near-Earth objects. |
| Nano Satellites | Nanosatellites are loosely defined as any satellite weighing less than 10 kilograms. |
| Automatic Identification System (AIS) | Automatic identification system (AIS) is an automatic tracking system used to identify and locate ships by exchanging electronic data with other nearby ships, AIS base stations, and satellites. Satellite AIS (S-AIS) is the term used to describe when a satellite is used to detect AIS signatures. |
| Reusable launch vehicles (RLVs) | Reusable launch vehicle (RLV) means a launch vehicle that is designed to return to Earth substantially intact and therefore may be launched more than one time or that contains vehicle stages that may be recovered by a launch operator for future use in the operation of a substantially similar launch vehicle. |
| Apogee | The point in an elliptical satellite orbit which is farthest from the surface of the earth. Geosynchronous satellites which maintain circular orbits around the earth are first launched into highly elliptical orbits with apogees of 22,237 miles. |


Research Methodology
Mordor Intelligence follows a four-step methodology in all our reports.
- Step-1: Identify Key Variables: In order to build a robust forecasting methodology, the variables and factors identified in Step-1 are tested against available historical market numbers. Through an iterative process, the variables required for market forecast are set and the model is built on the basis of these variables.
- Step-2: Build a Market Model: Market-size estimations for the historical and forecast years have been provided in revenue and volume terms. For sales conversion to volume, the average selling price (ASP) is kept constant throughout the forecast period for each country, and inflation is not a part of the pricing.
- Step-3: Validate and Finalize: In this important step, all market numbers, variables and analyst calls are validated through an extensive network of primary research experts from the market studied. The respondents are selected across levels and functions to generate a holistic picture of the market studied.
- Step-4: Research Outputs: Syndicated Reports, Custom Consulting Assignments, Databases & Subscription Platforms.


