Market Overview
| Study Period | 2021 - 2031 |
|---|---|
| Forecast Data Period | 2026 - 2031 |
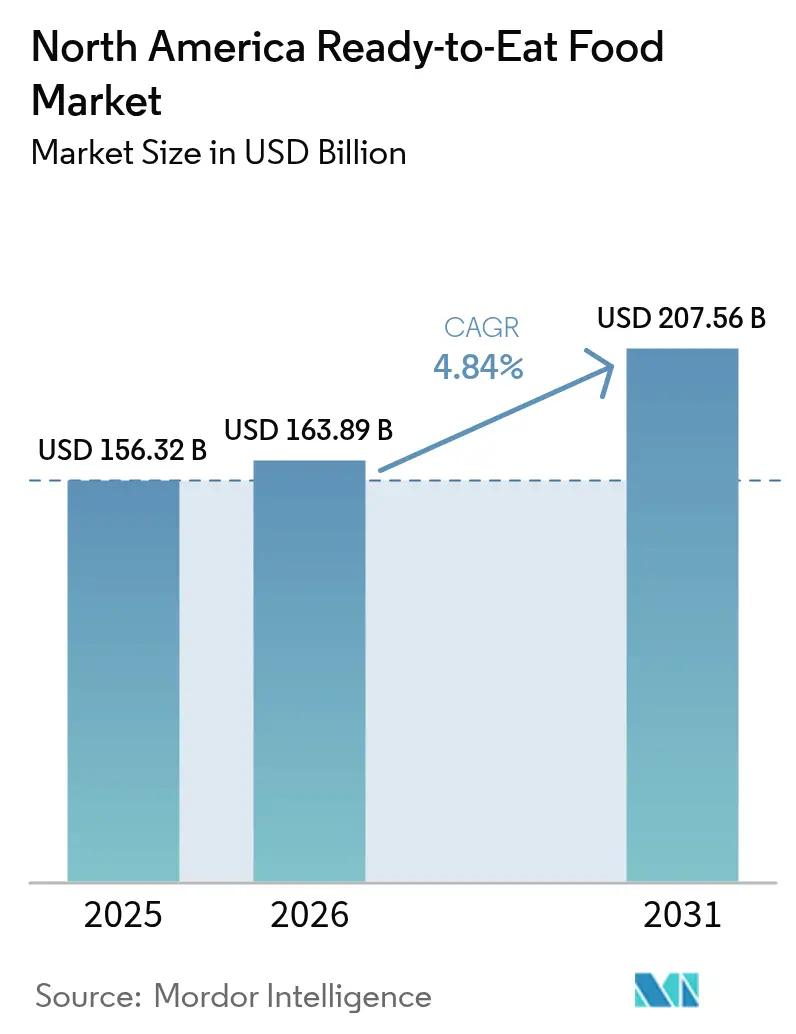
| Base Year Market Size (2025) | USD 156.32 Billion |
| Market Size (2026) | USD 163.89 Billion |
| Market Size (2031) | USD 207.56 Billion |
| Growth Rate (2026 - 2031) | 4.84% CAGR |
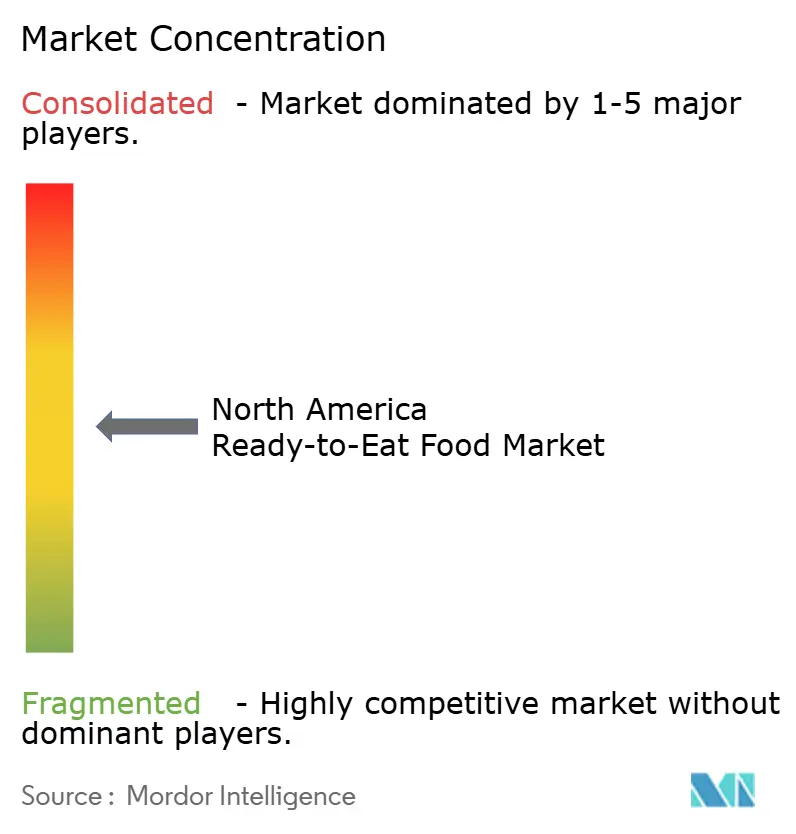
| Market Concentration | Medium |
Major Players
*Disclaimer: Major Players sorted in no particular order Image © Mordor Intelligence. Reuse requires attribution under CC BY 4.0. |
|
North America Ready-to-Eat Food Market Analysis by Mordor Intelligence
North American ready-to-eat food market size in 2026 is estimated at USD 163.89 billion, growing from 2025 value of USD 156.32 billion with 2031 projections showing USD 207.56 billion, growing at 4.84% CAGR over 2026-2031. This growth is primarily driven by evolving consumer lifestyles, including busier schedules, a rise in single-person households, and higher workforce participation, all of which are increasing the demand for convenient meal solutions. Regulatory developments have further supported this trend. In 2025, the U.S. FDA implemented front-of-package nutrition labeling and redefined the "healthy" claim, prompting manufacturers to reformulate products while maintaining taste and portability to meet consumer expectations. The expansion of e-commerce has also played a pivotal role in enhancing market accessibility. Strategic partnerships in the digital space have streamlined last-mile delivery, making ready-to-eat foods more accessible to consumers. Additionally, demographic shifts in Mexico, such as urbanization and changing dietary preferences, are accelerating the adoption of convenient food options. Despite challenges like rising input costs, manufacturers are mitigating these pressures through investments in automation, which not only help manage margins but also drive continuous innovation in product offerings. These combined factors are positioning the North American ready-to-eat food market for sustained growth during the forecast period.
Key Report Takeaways
- By product type, ready meals led with 35.78% revenue share in 2025 and is projected to post a 4.85% CAGR through 2031.
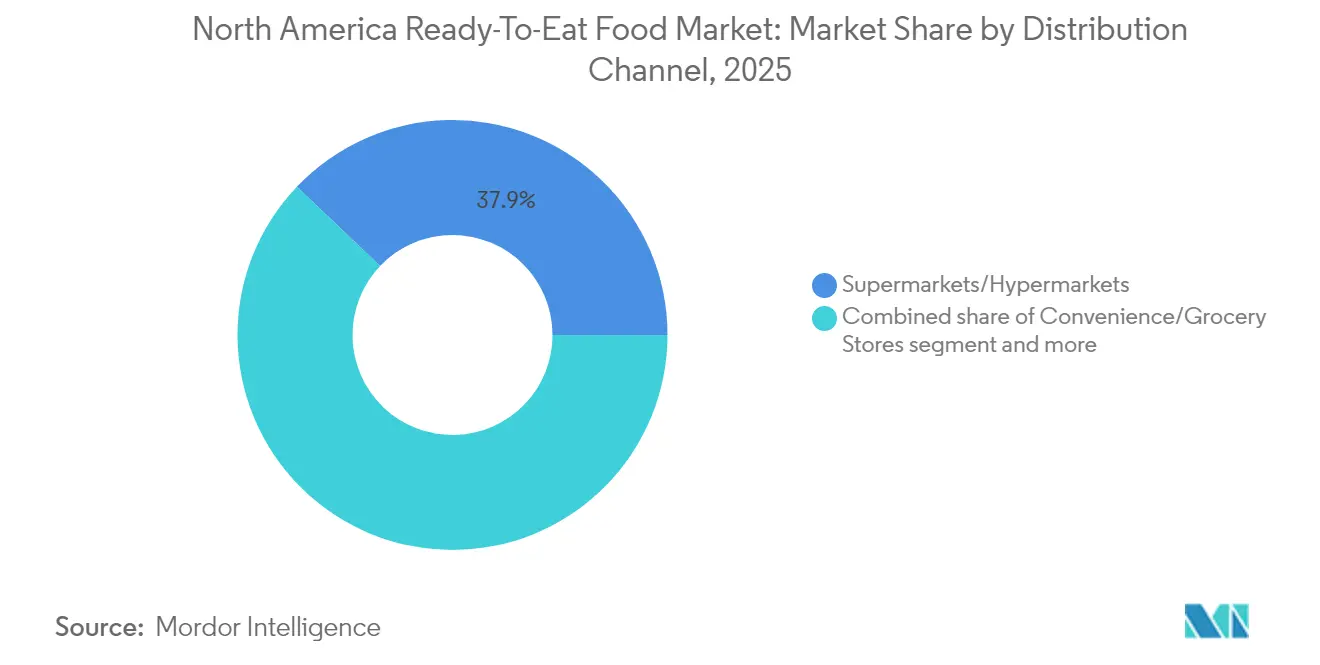
- By distribution channel, supermarkets/hypermarkets captured 37.88% of the ready-to-eat food market share in 2025, while online retail stores are forecast to expand at a 6.58% CAGR to 2031.
- By geography, the United States held 83.10% of the ready-to-eat food market size in 2025; Mexico is set to grow at a 7.05% CAGR between 2026 and 2031.
Note: Market size and forecast figures in this report are generated using Mordor Intelligence’s proprietary estimation framework, updated with the latest available data and insights as of 2026.
North America Ready-to-Eat Food Market Trends and Insights
Drivers Impact Analysis*
| Driver | (~) % Impact on CAGR Forecast | Geographic Relevance | Impact Timeline |
|---|---|---|---|
| Availability of Diverse Cuisine Options in Ready-To-Eat Formats | +0.8% | North America, with strongest impact in urban centers | Medium term (2-4 years) |
| Growing Number of Single-Person Households | +1.2% | United States and Canada, particularly metropolitan areas | Long term (≥ 4 years) |
| Advancements In Packaging to Improve Shelf Life and Portability | +0.6% | With early adoption in North America | Short term (≤ 2 years) |
| Rapid Growth of Online Food Delivery And E-Grocery Platforms | +1.1% | North America, with Mexico showing accelerated adoption | Medium term (2-4 years) |
| Increasing Workforce Participation Boosts Demand for Time-Saving Food Solutions | +0.9% | United States and Canada, urban and suburban markets | Long term (≥ 4 years) |
| Increasing Consumer Willingness to Spend on Premium Ready-to-Eat Products | +0.4% | North America, concentrated in higher-income demographics | Medium term (2-4 years) |
| Source: Mordor Intelligence | |||
Availability of Diverse Cuisine Options in Ready-To-Eat Formats
Manufacturers are redefining product development strategies to align with consumers' growing desire for diverse culinary experiences. According to the USDA's Food Processing Ingredients Annual report, the demand for ready-to-eat foods in Mexico is rising, particularly among younger consumers [1]Source: United States Department of Agriculture, "Food Processing Ingredients Annual", www.apps.fas.usda.gov. This shift is fueled by an increasing acceptance of international flavors, which is driving market growth. The trend has evolved beyond traditional ethnic foods to include innovative fusion concepts and regional specialties, enabling brands to stand out in a competitive market. By offering a wider variety of options, companies can command premium pricing while appealing to a broader demographic spectrum. Furthermore, Export Development Canada identifies global flavors, with a strong emphasis on Asian and Indian cuisines, as significant trends for 2025. This reflects a growing consumer preference for authentic international experiences delivered in convenient formats. By adopting a data-driven approach to flavor innovation, brands can strategically launch targeted products, minimizing the risk of failure in emerging cuisine categories and ensuring alignment with consumer expectations.
Growing Number of Single-Person Households
Urban markets are undergoing a significant shift in the ready-to-eat food sector due to the rise of single-person households. These changes, coupled with limited living spaces and fast-paced urban lifestyles, are driving demand for smaller, convenient meal options. Statistics Canada highlights that evolving household structures are reshaping food buying habits. Single-person households, a key consumer segment, prefer premium products and are willing to pay more for high-quality, convenient meals, making cooking for one comparable to buying prepared foods. The US Census Bureau reported 38.1 million single-person households in the U.S. in 2023, up from 37.89 million in 2022, showcasing their growing market influence [2]Source: US Census Bureau, "Number of single-person households in the United States from 1960 to 2023", www2.census.gov. Brands can cater to this segment by offering products with resealable packaging, longer shelf life, and portion control. Additionally, these consumers increasingly use online grocery services and meal delivery platforms, boosting digital retail channels. Aligning product offerings and distribution strategies with these trends allows companies to capture demand and strengthen their position in the ready-to-eat food market.
Advancements In Packaging to Improve Shelf Life and Portability
Packaging innovation, driven by advancements in smart technologies and sustainable materials, has become a key competitive differentiator. These innovations reshape consumer expectations while addressing evolving regulatory standards. The Institute of Food Technologists highlights developments like metalized films that enhance shelf life and reduce plastic use, and digital printing technologies for cost-effective label updates to meet compliance [3]Source: The Institute of Food Technologists, "Top 7 Food Packaging Innovations", www.ift.org. The FDA's front-of-package nutrition labeling mandates emphasize designs that integrate regulatory adherence with product appeal. Migration testing ensures food safety by mitigating chemical transfer concerns, fostering trust, and enabling innovation. The focus on sustainability has accelerated compostable packaging solutions, meeting environmental regulations and growing consumer demand for eco-friendly options. These advancements create opportunities for premium product positioning while addressing regulatory, environmental, and consumer-driven factors influencing purchasing decisions.
Rapid Growth of Online Food Delivery And E-Grocery Platforms
Digital commerce is transforming consumer shopping and market operations. Government data highlights growing reliance on tech platforms for food distribution, signaling an industry shift. The USDA, EPA, and FDA are investing in digital ecosystems to reduce food waste, enhance supply chain transparency, and improve risk management. Partnerships between food distributors and tech platforms are enabling smaller brands to bypass traditional retail barriers and reach consumers directly. Integrating SNAP benefits into e-commerce expands access for underserved groups, promoting inclusivity. Technological advancements are improving customer retention, accessibility, and the shopping experience. E-commerce platforms provide valuable data for manufacturers to refine products and marketing strategies, fostering rapid innovation and market agility. Insights from online shopping are driving product development and optimizing supply chains, ensuring businesses remain competitive in a fast-paced market.
Restraints Impact Analysis*
| Restraint | (~) % Impact on CAGR Forecast | Geographic Relevance | Impact Timeline |
|---|---|---|---|
| Concerns Over Nutritional Value and Use of Artificial Ingredients | -0.7% | North America, particularly among health-conscious demographics | Medium term (2-4 years) |
| Growing Preference for Fresh and Organic Food Alternatives | -0.9% | United States and Canada, strongest in urban markets | Long term (≥ 4 years) |
| Stringent Government Regulations on Food Labeling and Additives | -0.5% | United States and Canada, with Mexico following similar trends | Short term (≤ 2 years) |
| Environmental Impact of Packaging Waste from Ready-to-Eat Products | -0.3% | North America, with strongest impact in environmentally conscious regions | Medium term (2-4 years) |
| Source: Mordor Intelligence | |||
Concerns Over Nutritional Value and Use of Artificial Ingredients
As health awareness campaigns and regulatory changes emphasize ingredient transparency, consumer skepticism toward ultra-processed foods is rising. The FDA's front-of-package nutrition labeling system categorizes products as "Low," "Med," or "High" in saturated fat, sodium, and added sugars, making nutritional shortcomings clearer. This aligns with a trend reported by the International Food Information Council, where more consumers are scrutinizing ingredient and nutrition labels. Demand for clean-label and reduced-sugar products is growing, reflecting a shift toward healthier choices [4]Source: International Food Information Council, "2024 IFIC Food & Health Survey", www.foodinsight.org. Regulatory shifts are driving manufacturers to reformulate products, but this often increases costs and alters taste profiles, especially in convenience foods. Products rated poorly under the new system risk losing market appeal, pressuring manufacturers to innovate. The FDA's guidance on Low-Moisture Ready-to-Eat foods highlights a focus on food safety, urging robust sanitation to prevent contamination. Manufacturers are investing in clean-label formulations and functional ingredients to meet regulatory and consumer demands, but balancing these changes with affordability and taste remains a challenge for the processed food market.
Growing Preference for Fresh and Organic Food Alternatives
The Organic Trade Association (OTA) highlights the rapid growth of the organic food sector as a significant threat to traditional ready-to-eat products. Millennials and Gen Z are driving this shift, prioritizing health benefits over environmental claims when purchasing organic products. This preference challenges ready-to-eat manufacturers, as younger buyers value health and sustainability over convenience. The "food as medicine" trend further emphasizes fresh produce and minimally processed options, creating additional obstacles for conventional ready-to-eat categories. The International Fresh Produce Association's State of the Consumer 2025 report projects substantial spending growth in the produce sector, driven by demand for healthier, eco-friendly products. Increased awareness through nutrition education and social media reinforces this preference for fresh alternatives. To remain competitive, ready-to-eat manufacturers must innovate, balancing convenience with health-conscious attributes to meet the needs of this evolving consumer base.
*Our forecasts treat driver/restraint impacts as directional, not additive. The impact forecasts reflect baseline growth, mix effects, and variable interactions.
Segment Analysis
By Product Type: Ready Meals Dominate Through Premium Innovation
In 2025, ready meals hold a 35.78% market share, with a projected CAGR of 4.85% through 2031. This growth highlights the segment's ability to adapt to consumer preferences by offering convenient, restaurant-quality foods. Manufacturers leverage global culinary trends and premium strategies to maintain leadership. The USDA reports rising demand for globally-inspired ready-to-eat meals, especially among younger consumers in Mexico, with similar trends across North America. The "elevated in-home experiences" trend drives demand for premium frozen offerings with authentic flavors and superior ingredients. Ready Meals also address demographic shifts, such as more single-person households and busier lifestyles, by providing portion-controlled, convenient solutions that reduce food waste. FDA nutrition labeling requirements push manufacturers to improve nutritional profiles while retaining taste and convenience.
Export Development Canada identifies innovative meal solutions and global flavors as key 2025 trends. Manufacturers are responding with products featuring international cuisines and clean-label ingredients to meet transparency and quality demands. Advances in packaging, such as metalized films and smart technologies, extend shelf life and maintain food quality, enabling broader distribution. The Institute of Food Technologists highlights these innovations as enhancing product performance and appeal. The segment's growth is further supported by the increasing acceptance of frozen foods as high-quality alternatives to fresh cooking, particularly among younger consumers who prioritize convenience without compromising taste or nutrition.


By Distribution Channel: Traditional Retail Maintains Dominance While Digital Channels Accelerate
In 2025, Supermarkets and Hypermarkets dominate the North American grocery market with a 37.88% market share. Their success is driven by robust infrastructure, diverse products, and their role as the primary food shopping destination. These retailers meet consumer needs by offering ready-to-eat meals and fresh produce, enabling informed purchases in one visit. The Food Marketing Institute's 2025 U.S. Grocery Shopper Trends report shows that 75% of shoppers feel in control of grocery expenses, using strategies like list-making and meal planning. Traditional retailers benefit from consumer preferences for in-person product inspection, instant availability, and the convenience of combining ready-to-eat and grocery purchases. Strategic partnerships with food manufacturers further strengthen their market position through exclusive product launches and promotions.
Online Retail Stores are the fastest-growing segment in the grocery market, with a projected CAGR of 6.58% through 2031. This growth is driven by technological advancements, improved delivery systems, and rising demand for convenience and contactless shopping. SNAP benefits integration has expanded market access, while AI-powered tools enhance customer retention and basket sizes. The Food Marketing Institute highlights digital transformation's role in reshaping grocery retail, supported by USDA investments in supply chain transparency. Online platforms excel in offering niche products, subscriptions, and personalized recommendations, which traditional retailers struggle to match. Younger consumers, comfortable with digital platforms, drive this growth by prioritizing time-saving solutions aligned with their dynamic lifestyles.
Geography Analysis
In 2025, the United States boasts a commanding 83.10% market share, underscoring its mature infrastructure, established consumer habits, and extensive distribution networks. These networks adeptly serve both traditional retail and the rapidly expanding e-commerce sector, catering to a diverse demographic. The U.S. maintains its leadership, bolstered by a sophisticated regulatory framework. Notably, the FDA's stringent food safety and labeling mandates cultivate consistent market conditions. Characterized by high consumer purchasing power and a widespread acceptance of convenience foods, the U.S. market benefits from a refined supply chain infrastructure. This infrastructure guarantees smooth product distribution from manufacturers directly to consumers. Moreover, the market's maturity is highlighted by strong brand loyalty and widespread consumer familiarity with ready-to-eat product categories across its varied demographics.
Mexico is on a rapid ascent, boasting a projected 7.05% CAGR through 2031. This growth is driven by swift urbanization, a youthful demographic shift, and an increasing acceptance of convenience foods, all supported by rising disposable incomes. The USDA's Food Processing Ingredients Annual report highlights the importance of Mexico's food processing industry, which accounts for 4% of the nation's GDP in 2024. This significant contribution strengthens the supply chain, driving the growth of the ready-to-eat food market. Mexico's proximity to U.S. suppliers, combined with the benefits of USMCA trade agreements, facilitates easy access to both ingredients and finished products. Moreover, industry leaders like Grupo Bimbo and Sigma Alimentos are instrumental in bolstering local market growth and enhancing consumer acceptance. As urbanization transforms lifestyles, younger Mexican consumers are increasingly drawn to international flavors and convenience-oriented products, shifting away from traditional home cooking in favor of quicker meal solutions.
Competitive Landscape
In North America, the Ready-to-Eat (RTE) food market showcases a moderately fragmented landscape, where a select few dominant players command a significant market share. These leaders, bolstered by robust brand loyalty and expansive distribution networks, harness innovation and a focus on health to cater to urban consumers pressed for time. While segments like private labels and premium RTEs gain traction, heightening competition, they also prompt traditional giants to broaden their portfolios. Yet, amidst this consolidation, regional and niche players carve out their niches, tapping into specific dietary trends and ethnic cuisines. This interplay of dominance and competitive entry barriers crafts a vibrant, opportunity-laden market.
Consumer preferences are increasingly gravitating towards clean-label, organic, and functional ingredients, driving growth in the RTE sector. Legacy brands are reformulating products, eliminating artificial preservatives, and cutting down on sodium and sugar. Meanwhile, startups are seizing the moment, promoting plant-based, gluten-free, and keto-friendly options. They adeptly leverage direct-to-consumer models and social media to engage younger audiences. As health awareness rises, the demand for product transparency and traceability becomes paramount, shaping brand trust and loyalty.
Technological strides in packaging and supply chain logistics are reshaping the competitive arena. Techniques like vacuum skin packaging, high-pressure processing (HPP), and smart-label technologies empower manufacturers to prolong shelf life while preserving product quality. Retailers, too, are broadening their RTE offerings, blending in-store and online channels. This includes convenient meal kits and heat-and-eat formats. Collectively, these trends herald a more agile, health-centric, and digitally savvy competition in North America's RTE market.
North America Ready-to-Eat Food Industry Leaders
-
Conagra Brands, Inc.
-
Nestle S.A
-
General Mills, Inc
-
The Kraft Heinz Company
-
Tyson Foods, Inc.
- *Disclaimer: Major Players sorted in no particular order

Recent Industry Developments
- May 2025: Dolly Parton has launched a new line of single-serve frozen meals in collaboration with Conagra Brands, bringing her signature Southern-inspired comfort foods—such as chicken and dumplings, beef pot roast, country fried steak, and shrimp and grits—to grocery stores nationwide at an affordable price.
- May 2025: Kencko, known for its instant smoothies, has expanded into the snack category with the launch of fiber-rich Fruit Snaps—crunchy, freeze-dried fruit sticks available in mango, strawberry, and raspberry, each providing 2 grams of dietary fiber and no added sugars
- January 2025: Honey Bunches of Oats has introduced a new indulgent chocolate flavor, expanding its popular cereal line to cater to fans seeking a sweeter, more decadent breakfast or snack option. According to the brand, this launch combines the brand’s signature crunchy granola clusters and flakes with rich chocolate, appealing to both longtime enthusiasts and new consumers looking for variety.
- January 2025: Natural Grocers has launched six new certified organic, plant-based soups—Butternut Squash, Creamy Tomato, Sauerkraut, Sweet Corn, Three Lentil, and Vegan Chili Bean—packaged in eco-friendly, BPA-free pouches designed for sustainability and convenience.


Research Methodology Framework and Report Scope
Market Definitions and Key Coverage
Our study defines the North American ready-to-eat (RTE) food market as every packaged item, frozen, chilled, canned, or shelf-stable, that reaches consumers through retail or food-service channels and can be eaten with minimal or no further cooking.
Scope Exclusion: Beverages, home-delivered meal kits that require cooking, and unprocessed fresh produce stand outside this scope.
Segmentation Overview
-
By Product Type
- Instant Breakfast/Cereals
- Instant Soups and Snacks
- Ready Meals
- Baked Goods
- Meat Products
- Other Product Types
-
By Distribution Channel
- Supermarkets/Hypermarkets
- Convenience/Grocery Stores
- Speciality Stores
- Online Retail Stores
- Other Distribution Channels
-
By Geography
- United States
- Canada
- Mexico
- Rest of North America
Detailed Research Methodology and Data Validation
Primary Research
Mordor analysts interviewed grocery-chain buyers, brand managers at multinational and private-label producers, cold-chain logisticians, and packaging-equipment vendors across the United States, Canada, and Mexico. These conversations tested price points, volume assumptions, and emerging drivers that secondary sources could not quantify.
Desk Research
Public datasets from USDA Economic Research Service, Statistics Canada, Mexico's INEGI, and UN Comtrade anchor supply, trade, and per-capita consumption baselines, while household-expenditure tables from the U.S. Bureau of Labor Statistics and Health Canada nutrition surveys guide category splits. Company 10-Ks, retailer presentations, and scanner reads released by the Food Marketing Institute refine channel weights. Questel patent analytics surface preservation and packaging trends, and Dow Jones Factiva plus D&B Hoovers track plant expansions and brand launches. The sources listed are illustrative; many additional references inform data collection and validation.
Market-Sizing & Forecasting
A top-down model first reconciles national food expenditure, import-export balances, and category penetration to size the 2024 base. Supplier revenue roll-ups, average-selling-price times volume checks, and channel interviews then act as bottom-up correctives before results are locked. Key variables include single-person household growth, inflation-adjusted ASP progression, cold-chain capacity additions, e-commerce share in grocery, and looming sodium-reduction rules. A multivariate regression, reviewed with surveyed experts, projects demand through 2030, and scenario analysis gauges impacts of recessions or stricter labeling laws.
Data Validation & Update Cycle
Outputs pass variance checks against independent retail dashboards and national nutrition surveys, followed by peer review within Mordor. Reports refresh annually, with interim updates triggered by material events. Every client download receives the latest validated file.
Why Mordor's North America Ready-to-Eat Food Baseline Commands Reliability
Published estimates diverge because firms vary product coverage, channel inclusion, currency treatment, and refresh cadence.
Key gap drivers here include whether shelf-stable breakfast items are counted, whether Mexico is included, and how inflation is stripped out before real growth is applied.
Benchmark comparison
| Market Size | Anonymized source | Primary gap driver |
|---|---|---|
| USD 156.3 B (2025) | Mordor Intelligence | - |
| USD 61.3 B (2024) | Regional Consultancy A | Counts only chilled meals; Mexico excluded |
| USD 67.1 B (2024) | Global Consultancy B | Relies on producer revenue, omits food-service |
| USD 83.9 B (2024) | Trade Journal C | Stops at retail sales; no inflation adjustment |
Taken together, the comparison shows that our three-country scope, dual-track validation, and disciplined update cycle give decision-makers a balanced, transparent baseline they can trace back to public statistics and real-world channel feedback.


Key Questions Answered in the Report
What is the current size of the North America ready-to-eat food market and how fast is it growing?
The market stands at USD 163.89 billion in 2026 and is projected to expand to USD 207.56 billion by 2031, reflecting a 4.84% CAGR.
Which product segment holds the largest share?
Ready Meals lead with 35.78% revenue share in 2025 and are also the fastest-growing segment at a 4.85% CAGR through 2031.
What sales channel is expanding the quickest?
Online Retail Stores are set to grow at a 6.58% CAGR to 2031 as consumers embrace e-grocery platforms and same-day delivery.
Which country is expected to register the fastest growth in North America?
Mexico is projected to advance at a 7.05% CAGR through 2031 thanks to rapid urbanization, rising disposable incomes, and greater acceptance of convenience foods.
Page last updated on:


