Market Overview
| Study Period | 2021 - 2031 |
|---|---|
| Forecast Data Period | 2026 - 2031 |
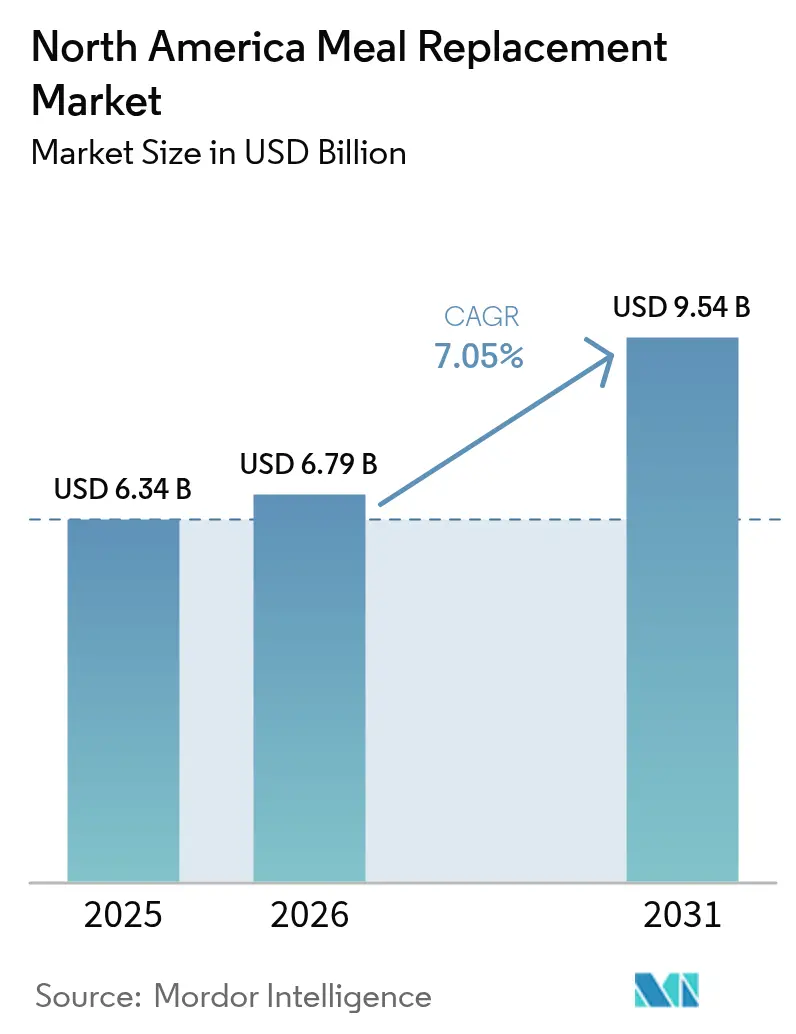
| Base Year Market Size (2025) | USD 6.34 Billion |
| Market Size (2026) | USD 6.79 Billion |
| Market Size (2031) | USD 9.54 Billion |
| Growth Rate (2026 - 2031) | 7.05% CAGR |
| Market Concentration | Medium |
Major Players
*Disclaimer: Major Players sorted in no particular order Image © Mordor Intelligence. Reuse requires attribution under CC BY 4.0. |
|
North America Meal Replacement Market Analysis by Mordor Intelligence
The North America meal replacement market size was valued at USD 6.34 billion in 2025 and estimated to grow from USD 6.79 billion in 2026 to reach USD 9.54 billion by 2031, at a CAGR of 7.05% during the forecast period (2026-2031). The market growth is driven by changing consumer preferences and lifestyle patterns. The increasing demand for convenient and nutritious food options is particularly notable among working professionals, students, and urban populations. Changes in work patterns, including extended working hours and hybrid models, have led consumers to seek quick yet nutritionally complete alternatives to traditional meals. The market has also benefited from advances in food science, including the integration of probiotics and adaptogens, allowing manufacturers to develop products for specific dietary requirements, such as keto, diabetic-friendly, and gluten-free options. The market's growth is further supported by the expansion of digital retail channels and direct-to-consumer services, which provide personalized nutrition plans and convenient delivery options.
Key Report Takeaways
- By product type, powdered formats led with 42.88% of meal replacement market share in 2025; ready-to-drink (RTD) products are growing fastest at a 7.74% CAGR through 2031.
- By packaging, bottles held 64.72% revenue in 2025, whereas Tetra Pak cartons are forecast to expand at an 8.39% CAGR to 2031.
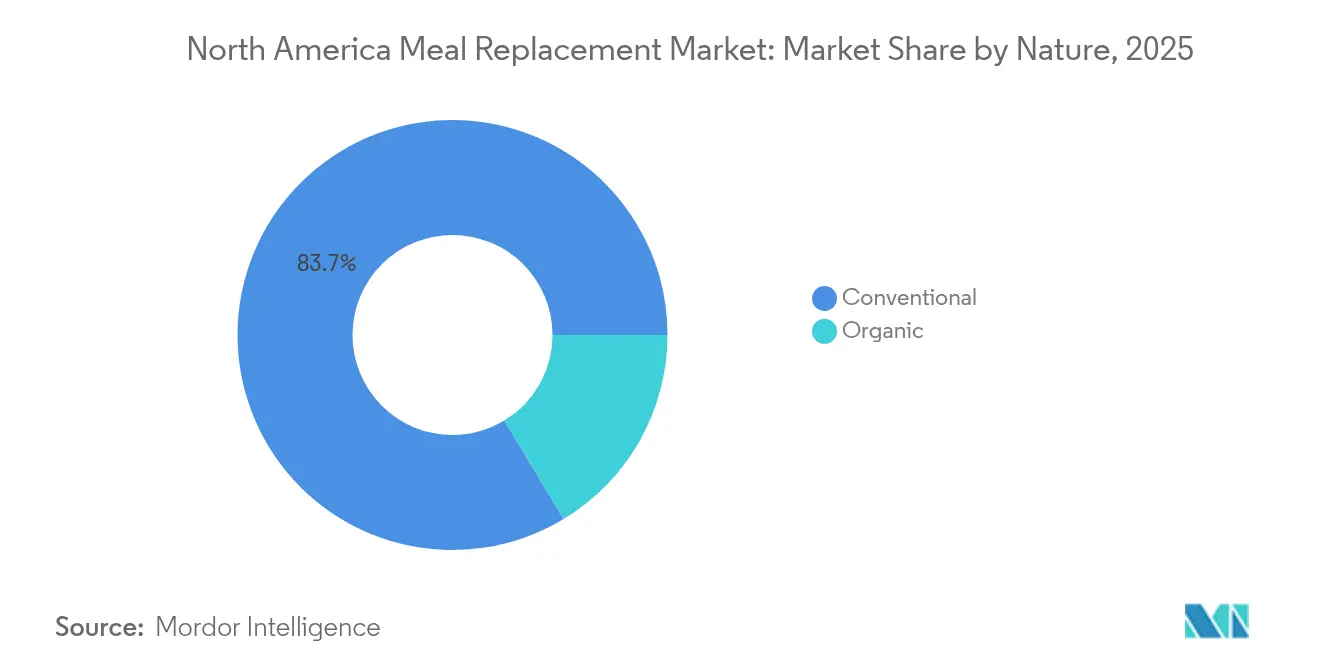
- By nature, conventional products accounted for 83.65% of 2025 revenue, while the organic segment is advancing at a 9.14% CAGR.
- By distribution channel, supermarkets and hypermarkets commanded 47.25% of 2025 sales, and online retailers are expected to grow 7.28% annually to 2031.
- By geography, the United States represented 77.92% of 2025 revenue, while Mexico is set to grow at a 9.03% CAGR during the forecast period.
Note: Market size and forecast figures in this report are generated using Mordor Intelligence’s proprietary estimation framework, updated with the latest available data and insights as of 2026.
North America Meal Replacement Market Trends and Insights
Drivers Impact Analysis*
| Driver | (~) % Impact on CAGR Forecast | Geographic Relevance | Impact Timeline |
|---|---|---|---|
| Quick and Nutritious Meal Options Gain Popularity Amid Busy Lifestyles | +1.2% | North America, with strongest growth in urban centers | Medium term (2-4 years) |
| Rising Fitness Trends Drive Up Demand for Protein-Rich Replacement Products | +1.8% | United States and Canada, spill-over to Mexico | Long term (≥ 4 years) |
| E-Commerce Platforms Enhance Accessibility of Global Meal Replacement Brands | +1.1% | Global, with early gains in United States metropolitan areas | Short term (≤ 2 years) |
| Heightened Awareness of Portion Control Fuels Meal Replacement Adoption | +0.9% | North America, particularly among GLP-1 medication users | Medium term (2-4 years) |
| Technological Advances Improve Product Variety, Flavor, and Shelf Life | +0.8% | Manufacturing hubs in United States and Canada | Long term (≥ 4 years) |
| Corporate Wellness Initiatives Promote Meal Replacements in Workplace Settings | +0.7% | North America, concentrated in major business districts | Medium term (2-4 years) |
| Source: Mordor Intelligence | |||
Quick and Nutritious Meal Options Gain Popularity Amid Busy Lifestyles
Corporate meal delivery services are addressing institutional demand as hybrid work arrangements create new requirements for employee wellness programs. According to DoorDash for Business research in 2025, 91% of employees who receive meal benefits report higher job satisfaction, prompting companies to incorporate meal services into their benefits packages. The demand for efficient nutrition solutions has expanded from individual consumers to workplace cafeterias and corporate catering operations, where meal replacements provide controlled portions as alternatives to conventional food service. Factor's corporate meal delivery program demonstrates this evolution by offering various dietary options, including low-carb, keto, and vegan meals. This business model generates stable revenue streams that demonstrate greater resilience during economic fluctuations compared to direct-to-consumer sales. Additionally, the incorporation of meal replacements into corporate wellness programs provides valuable data on consumption patterns to guide product development and marketing initiatives.
Rising Fitness Trends Drive Up Demand for Protein-Rich Replacement Products
Protein fortification has evolved from niche sports nutrition to mainstream consumer demand, becoming a significant driver in the meal replacement market. According to the International Food Information Council (IFIC), 71% of Americans actively seek to increase their protein intake in 2024 [1]Source: International Food Information Council (IFIC), "2024 IFIC Food & Health Survey", foodinsight.org. In March 2025, Quest Nutrition launched its Protein Milkshake, containing 45 grams of protein, 2 grams of sugar, and 4 grams or less of net carbs, demonstrating the market's demand for high-protein convenience products that exceed traditional serving sizes. The fitness trend aligns with aging demographics, as consumers recognize protein's role in muscle mass preservation and metabolic health. Plant-based protein innovations, particularly in pea and fava bean processing, address sustainability concerns while meeting performance nutrition requirements. Manufacturing advances in protein stabilization prevent foaming issues that previously limited protein concentration in liquid formulations, enabling higher protein density without compromising taste or texture.
E-Commerce Platforms Enhance Accessibility of Global Meal Replacement Brands
Direct-to-consumer strategies are transforming distribution economics as manufacturers bypass traditional retail markups and establish direct customer relationships. The development of integrated meal planning platforms by major retailers, such as Walmart, consolidates various meal solutions into a unified system, enabling meal replacement manufacturers to leverage cross-selling opportunities and consumer behavior analytics. The implementation of subscription-based business models generates consistent revenue streams while facilitating data-driven, personalized nutrition recommendations based on consumption patterns and consumer feedback. E-commerce distribution channels enable manufacturers to conduct efficient product testing and modifications, introducing new formulations with reduced inventory risk compared to conventional retail launches.
Technological Advances Improve Product Variety, Flavor, and Shelf Life
Advanced freeze-drying technology enhances product formulation capabilities in cold beverage applications, with Nestlé's developments preventing ingredient agglomeration and enabling diverse product formats with prolonged shelf stability. In August 2024, PlantFusion introduced a stand-up pouch format for powdered protein using a multilayer plant-based material that is 100% compostable. This packaging innovation maintains moisture and oxygen barrier properties while addressing sustainability requirements. Fermentation-based protein production delivers ingredients with superior organoleptic properties and lower environmental impact compared to conventional protein sources. These technological developments enable manufacturers to expand their product portfolios with enhanced flavor profiles and improved stability characteristics while reducing manufacturing costs through increased efficiency and minimized waste.
Restraints Impact Analysis*
| Restraint | (~) % Impact on CAGR Forecast | Geographic Relevance | Impact Timeline |
|---|---|---|---|
| Misconceptions About Artificial Ingredients Reduce Consumer Confidence | -1.3% | North America, particularly among organic-focused consumers | Long term (≥ 4 years) |
| Allergen Concerns Restrict Consumption Among Sensitive Populations | -0.8% | United States and Canada, with regulatory focus | Medium term (2-4 years) |
| Product Recalls Undermine Brand Loyalty and Consumer Trust | -1.1% | North America, with institutional market impact | Short term (≤ 2 years) |
| Limited Satiety Compared to Whole Meals Hinders Long-Term Adoption | -0.9% | Global, with cultural variations in meal expectations | Long term (≥ 4 years) |
| Source: Mordor Intelligence | |||
Misconceptions About Artificial Ingredients Reduce Consumer Confidence
The growing consumer demand for clean labels creates a significant market constraint by increasing production costs and operational complexities across the supply chain. Consumers carefully examine ingredient lists for artificial additives. The Food and Drug Administration (FDA)'s evaluation of tara flour in May 2024, which resulted in its classification as an unapproved food additive, shows how regulatory decisions can remove ingredients from formulations and reduce consumer trust in new additives. The production of plant-based proteins requires functional ingredients that consumers often view as artificial, creating a fundamental conflict between technical needs and clean label goals. This challenge is particularly evident in protein stabilization, where traditional emulsifiers and stabilizers face consumer resistance despite proven safety and functional requirements. Companies must invest significant resources in developing alternative ingredients and educating consumers while maintaining product quality standards. This constraint particularly affects price-sensitive market segments where clean label alternatives remain too expensive.
Product Recalls Undermine Brand Loyalty and Consumer Trust
The listeria outbreak of 2024-2025, associated with supplement shakes distributed in long-term care facilities, resulted in 38 documented illnesses and 11 fatalities, as reported by the Food and Drug Administration (FDA) [2]Source: Food and Drug Administration (FDA), "Outbreak Investigation of Listeria monocytogenes: Frozen Supplemental Shakes (February 2025)", www.fda.gov. The institutional market demonstrates significant constraints, as healthcare facilities and corporate wellness programs implement stringent vendor qualification protocols that systematically exclude recalled brands from future procurement consideration. The financial implications of recalls encompass direct product replacement expenditures, potential legal ramifications, mandatory regulatory compliance measures, and substantial marketing investments necessary for reputation restoration. The intricate interconnection of ingredient supply chains indicates that contamination originating from a single supplier has the capacity to compromise multiple brands simultaneously, thereby generating comprehensive market uncertainty.
*Our forecasts treat driver/restraint impacts as directional, not additive. The impact forecasts reflect baseline growth, mix effects, and variable interactions.
Segment Analysis
By Product Type: RTD Products Drive Innovation
Powdered products currently dominate the market with a 42.88% share in 2025, driven by operational cost advantages and enhanced customization capabilities that appeal to diverse consumer segments. The powdered segment maintains its market leadership through multiple strategic advantages, including reduced manufacturing expenses, extended product longevity, and the capacity for bulk institutional distribution. The segment's growth is further supported by the integration of sustainable packaging solutions and the ability to facilitate personalized nutrition through precise formulation control.
The ready-to-drink products segment demonstrates significant market expansion with a projected CAGR of 7.74% through 2031. This growth is primarily attributed to technological advancements in packaging methodologies and protein stabilization processes, enabling manufacturers to achieve higher protein concentrations without compromising product quality. The implementation of Tetra Pak's Industrial Protein Mixer technology has effectively addressed previous limitations in protein concentration by eliminating foaming issues. In the nutritional bars category, market dynamics are influenced by increasing competition from alternative protein-enriched products, particularly frozen desserts and fortified snacks. The specialized product segment, encompassing gels and shots, demonstrates increasing relevance in medical nutrition applications, specifically addressing the requirements of GLP-1 medication users who require targeted formulations for muscle maintenance and appetite regulation.


By Packaging Format: Sustainable Solutions Gain Momentum
Tetra packs and cartons demonstrate the highest growth rate at 8.39% CAGR through 2031, driven by sustainability initiatives and extended shelf life capabilities that reduce food waste and transportation costs. Bottles hold the largest market share at 64.72% in 2025, due to consumer familiarity and retail display advantages, despite increasing sustainability concerns. Pouches show increased adoption in powder applications through advancements in barrier properties and compostable materials that protect product integrity while addressing environmental concerns. Other packaging formats fulfill specific needs, including single-serve portions and institutional bulk packaging, optimizing cost and convenience for various use cases.
Consumer environmental awareness and corporate sustainability goals influence packaging choices across individual and institutional segments. Tetra Pak's aseptic technology enables ambient storage and longer shelf life, reducing cold chain requirements and expanding distribution capabilities, particularly in e-commerce and international markets. Bottles face challenges with recycling infrastructure and plastic waste concerns, spurring development in bio-based materials and refillable systems. Pouch packaging provides material efficiency and reduced shipping costs, supporting direct-to-consumer business models and subscription services that require frequent deliveries.
By Nature: Organic Segment Accelerates
Conventional products maintain a commanding market position with an 83.65% share in 2025, attributed to their established manufacturing infrastructure, competitive pricing advantages, and extensive distribution capabilities. This segment's market dominance is reinforced through sophisticated supply chain optimization, economies of scale in production, and strategic sourcing relationships that enable cost-effective operations. The conventional segment's broad market penetration is further supported by its ability to meet diverse consumer preferences across multiple price points. However, the segment faces increasing pressure to implement clean label practices and transparency initiatives, despite operating outside the parameters of organic certification requirements.
Organic products are projected to grow at 9.14% CAGR through 2031, driven by consumers' acceptance of premium pricing for clean label formulations and sustainable sourcing. The organic segment benefits from United States Department of Agriculture (USDA) organic certification standards and increased retail support through dedicated shelf space and promotions. While this segment enables premium positioning and brand differentiation that support higher margins and customer loyalty, it faces challenges from supply chain complexity and certification costs. Supply constraints in organic protein production create pricing volatility and limit growth potential. Corporate sustainability initiatives and institutional purchasing policies continue to support organic sourcing despite higher costs.
By Distribution Channel: E-commerce Transformation
Online retailers are projected to achieve a 7.28% CAGR through 2031, driven by direct-to-consumer strategies, subscription models, and digital marketing capabilities that enable personalized customer experiences and data collection. Supermarkets and hypermarkets hold the dominant position with a 47.25% market share in 2025, leveraging impulse purchase opportunities and consumer preferences for physical product inspection. Convenience stores address immediate consumption needs in urban markets with limited storage space, while specialty stores focus on expert consultation and premium product positioning for higher margins. Additional distribution channels include institutional sales, workplace vending, and healthcare facility partnerships that target specific customer segments.
The growth in e-commerce reflects evolving consumer shopping behaviors, accelerated by pandemic-driven digital adoption and the increasing popularity of subscription services that offer convenience and bulk purchase savings. Physical retail channels are adapting by enhancing in-store experiences and implementing omnichannel services that combine online ordering with in-store pickup and returns. The distribution channel landscape continues to evolve as consumers embrace both digital product discovery through social media and influencer marketing, while valuing physical retail for product testing and immediate availability.
Geography Analysis
The United States holds a dominant 77.92% share of the North American meal replacement market in 2025. This leadership position stems from established corporate wellness infrastructure, increased GLP-1 medication adoption, and premium product positioning that reflects higher per-capita spending. The Food and Drug Administration (FDA)'s December 2024 finalization of updated "healthy" claim criteria provides new labeling opportunities for meal replacement manufacturers. The proposed front-of-package nutrition labeling requirements may influence consumer decision-making processes. Corporate wellness program adoption continues to grow as companies recognize meal replacement benefits for employee health and productivity. The United States market maintains prominence in GLP-1 medication prescriptions, generating specific demand for protein-rich formulations that support muscle preservation during weight loss therapy.
Canada maintains a stable secondary market position through regulatory modernization and cross-border trade integration that enables efficient product launches and supply chain operations. Health Canada's updated regulations for foods for special dietary use improve market access for innovative formulations while upholding safety standards. The country's Marketing Authorization for vitamin D fortification in yogurt and kefir indicates regulatory support for nutritional enhancement that may extend to meal replacements. Canadian consumers demonstrate a strong interest in plant-based options, with Agriculture and Agri-Food Canada documenting substantial growth in plant-based ready meals that support meal replacement adoption.
Mexico exhibits the fastest growth rate at 9.03% CAGR through 2031, supported by increasing vegan market adoption. COFEPRIS regulatory improvements simplify food supplement approvals through streamlined Prior Sanitary Import Permit processes and updated labeling requirements, reducing market entry barriers while maintaining safety standards. The personalized supplementation services address local health challenges. According to the Ministry of Health (Mexico), in 2023, adults aged 40-59 years showed the highest prevalence of overweight and obesity, with approximately 83.4% of adult respondents affected by these conditions, creating substantial demand for weight management solutions . Rest of North America caters to specialized niche markets with limited distribution infrastructure but increasing cross-border e-commerce activity that provides access to premium United States and Canadian brands.
Competitive Landscape
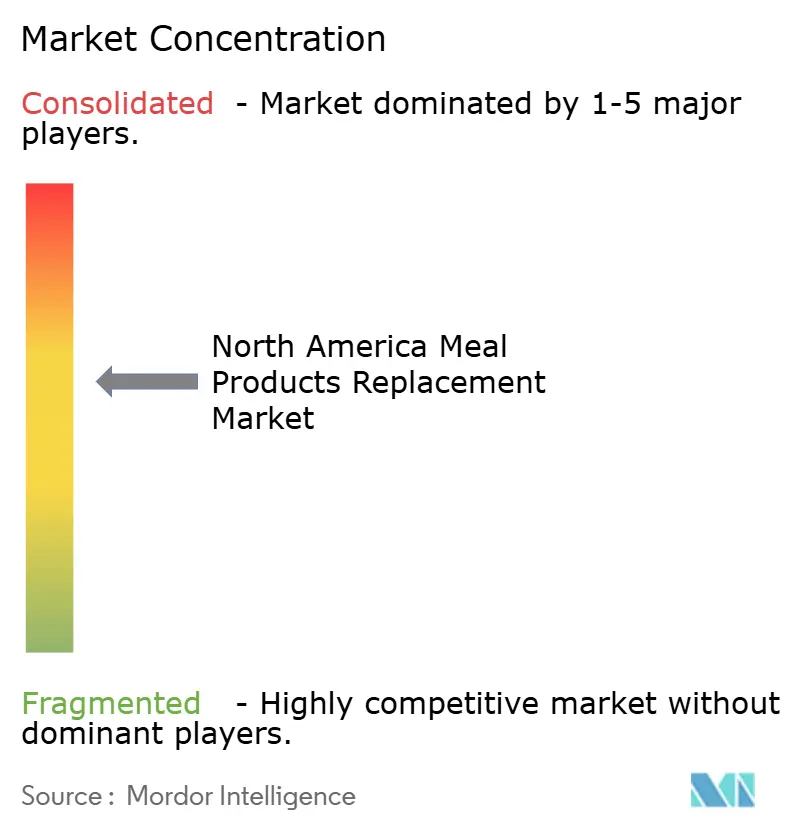
The North American meal replacement market demonstrates moderate consolidation. Strategic acquisitions continue to influence competitive dynamics and market positioning. The market's primary players include Abbott Laboratories, Nestlé S.A., Glanbia plc, Herbalife Nutrition Ltd., and Simply Good Foods Company. The industry's technological advancement progresses through collaborations with ingredient suppliers who develop GLP-1-supportive formulations, addressing new nutritional requirements created by pharmaceutical weight management drugs.
Companies focus on personalized nutrition and medical nutrition therapy opportunities, using artificial intelligence to customize solutions for specific health conditions and medication interactions. In June 2025, Lembas developed bioactive peptides that naturally enhance GLP-1 production as alternatives to pharmaceutical solutions. New market entrants implement direct-to-consumer models and subscription services to bypass traditional retail channels.
Established companies maintain their market position through strategic acquisitions and corporate wellness programs. Companies that possess integrated supply chain capabilities and regulatory expertise lead the market. Large organizations with substantial resources benefit from stricter quality assurance requirements and increased regulatory oversight. These requirements create barriers for smaller competitors while strengthening the position of well-established firms.
North America Meal Replacement Industry Leaders
-
Abbott Laboratories
-
Nestlé S.A
-
Glanbia plc
-
Herbalife Nutrition Ltd.
-
Simply Good Foods Company
- *Disclaimer: Major Players sorted in no particular order

Recent Industry Developments
- May 2025: CLIF BUILDERS has expanded its high-protein bars portfolio with the launch of three new products. The latest additions feature the BUILDERS OREO-flavored bar and the BUILDERS Reduced Sugar Crispy Protein bar, both available in two flavors.
- September 2024: Arla Foods introduced meal-replacement drinks in Denmark in chocolate caramel and vanilla hazelnut flavors. The beverages contain added vitamins, minerals, and fiber, with each serving providing 30g of protein and 12g of fiber.
- June 2024: The Simply Good Foods Company completed the acquisition of Only What You Need (OWYN), a plant-based ready-to-drink (RTD) protein shake brand. The acquisition strengthens Simply Good Foods' position in the nutritional snacking category.
- January 2024: Abbott Laboratories introduced PROTALITY, a high-protein nutrition shake brand. The product targets adults seeking weight loss while maintaining muscle mass and nutritional balance.


Research Methodology Framework and Report Scope
Market Definitions and Key Coverage
Our study defines the North America meal replacement market as retail and food-service sales of purpose-formulated powders, ready-to-drink beverages, and nutrition bars that are explicitly positioned to replace at least one conventional meal and deliver regulated minimum levels of calories, protein, vitamins, and minerals. All protein sources, whey, soy, pea, rice, and blended plant options, are covered, provided the product is marketed for complete meal substitution rather than snack or sports-supplement use.
Scope exclusion: Items such as home meal-kit subscriptions, frozen entrées, single-nutrient supplements, and high-protein snacks that lack a "meal replacement" claim are not counted.
Segmentation Overview
-
By Product Type
- Powdered Products
- Ready-to-Drink (RTD) Products
- Nutritional Bars
- Other Product Types
-
By Packaging Format
- Bottles
- Pouches
- Tetra Packs and Cartons
- Others
-
By Nature
- Conventional
- Organic
-
By Distribution Channel
- Supermarkets/Hypermarkets
- Convenience Stores
- Specialty Stores
- Online Retailers
- Other Distribution Channels
-
By Geography
- United States
- Canada
- Mexico
- Rest of North America
Detailed Research Methodology and Data Validation
Primary Research
To refine volumes and average selling prices, Mordor analysts conducted structured interviews with formulation scientists at contract manufacturers, category buyers at leading grocery and online retailers, clinical dietitians, and fitness-focused consumers across the United States, Canada, and Mexico. Insights on serving size trends, price elasticities, and promotional lift helped us validate desk findings and adjust assumptions that desk work alone could not resolve.
Desk Research
We began by mapping the industry through government and association datasets such as USDA Food Availability, CDC NHANES obesity prevalence, Health Canada nutrition guidelines, Mexico's ENSANUT surveys, and the US Census Monthly Retail Trade e-commerce tables. Our team also reviewed FDA product advisory letters, Consumer Healthcare Products Association white papers, patent filings accessed via Questel, and company financials from D&B Hoovers and news archives on Dow Jones Factiva. These secondary inputs shaped baseline consumption volumes, channel splits, and regulatory triggers. The sources cited here are illustrative; many additional public and proprietary references informed the desk phase.
Market-Sizing & Forecasting
A top-down reconstruction anchored on calorie-equivalent demand pools, built from obesity incidence, gym membership growth, and e-commerce penetration for nutrition products, established the 2025 market base. Select bottom-up cross-checks, including sampled manufacturer shipments and retail ASP × units scans, ensured alignment. Key variables in the multivariate regression forecast include adult obesity rate shifts, average online basket values for health foods, protein input prices, and label-claim innovation counts, each stress-tested through scenario analysis before acceptance. Data gaps in supplier roll-ups were bridged using weighted interpolation guided by primary expert ranges.
Data Validation & Update Cycle
Every model iteration passes a two-step analyst review comparing outputs with independent consumption indicators, trade shipment trends, and price monitors. Material variances trigger re-contact of primary sources. Reports refresh annually, and we issue interim updates when regulatory changes or major acquisitions distort the baseline.
Why Our North America Meal Replacement Baseline Commands Reliability
Published figures often diverge because firms pick different product scopes, assume alternate average serving prices, or freeze exchange rates at varying points. By tying our scope strictly to "complete meal" claims and updating macro-drivers each quarter, Mordor delivers a figure that clients can track back to transparent variables.
Key gap drivers include: some publishers fold in frozen entrées or high-protein snacks; others extrapolate from narrow brand panels without calibrating U.S.-Canada price gaps; a few lock currency at prior-year averages, inflating growth when the dollar weakens. Our disciplined refresh cadence and dual-path, top-down and bottom-up, reconciliation minimize such drifts.
Benchmark comparison
| Market Size | Anonymized source | Primary gap driver |
|---|---|---|
| USD 6.34 Bn (2025) | Mordor Intelligence | - |
| USD 6.22 Bn (2023) | Regional Consultancy A | Excludes Mexico and uses constant 2021 exchange rates |
| USD 10.37 Bn (2024) | Global Consultancy B | Adds frozen ready meals and counts sports-nutrition shakes |
| USD 9.49 Bn (2023) | Industry Journal C | Derives region as fixed share of global without local price validation |
In summary, differences stem largely from product scope and currency choices. By grounding estimates in clearly defined meal-replacement criteria, current-year pricing, and regularly refreshed driver data, Mordor Intelligence offers a balanced, reproducible baseline that decision-makers can depend on.


Key Questions Answered in the Report
What is the current size of the North America meal replacement market?
The meal replacement market is valued at USD 6.79 billion in 2026 and is forecast to reach USD 9.54 billion by 2031.
Which product format is expanding fastest?
Ready-to-drink shakes show the quickest growth at a 7.74% CAGR, outpacing powders and bars thanks to packaging and protein-stabilization advances.
Why is Mexico the fastest-growing geography?
Mexico benefits from streamlined COFEPRIS approvals, a rising vegan population and urban health awareness, supporting a 9.03% CAGR through 2031.
What role does e-commerce play in channel dynamics?
Online retailers are forecast to expand at 7.28% annually as subscriptions and data-driven personalization improve customer retention and margin mix.
Page last updated on:


