
Market Overview
| Study Period | 2021 - 2031 |
|---|---|
| Forecast Data Period | 2026 - 2031 |
| Base Year Market Size (2025) | USD 191.09 Billion |
| Market Size (2026) | USD 198.01 Billion |
| Market Size (2031) | USD 236.55 Billion |
| Growth Rate (2026 - 2031) | 3.62 % |
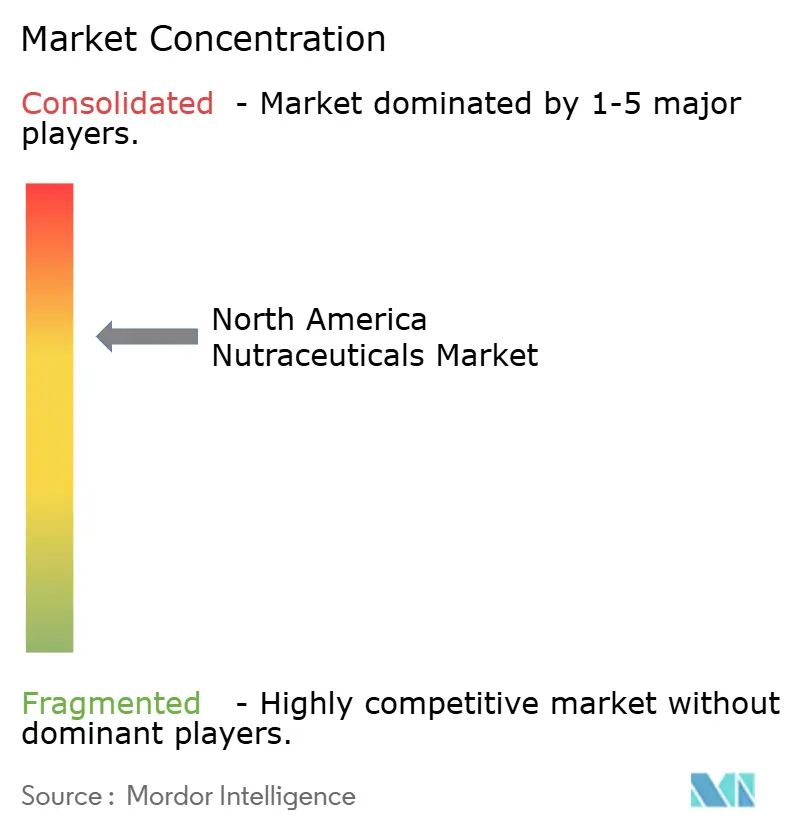
| Market Concentration | Medium |
Major Players
*Disclaimer: Major Players sorted in no particular order Image © Mordor Intelligence. Reuse requires attribution under CC BY 4.0. |
|
North America Nutraceuticals Market Analysis by Mordor Intelligence
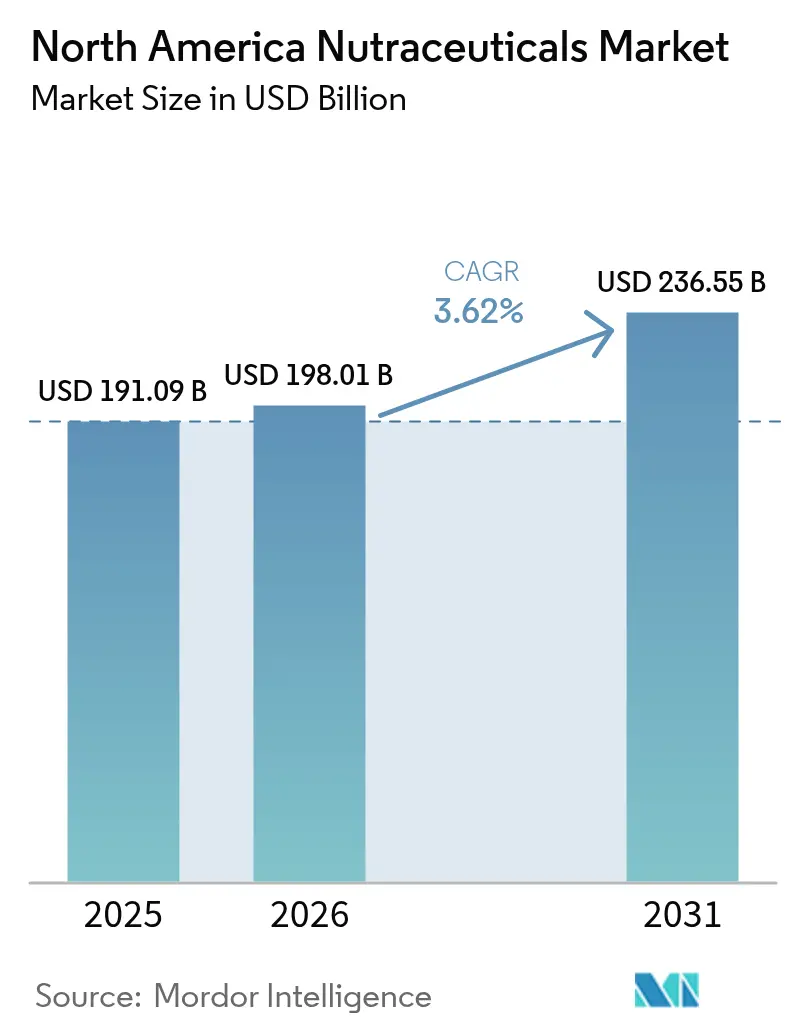
The North America Nutraceuticals Market size was valued at USD 191.09 billion in 2025, increased to USD 198.01 billion in 2026, and is projected to reach USD 236.55 billion by 2031, growing at a CAGR of 3.62% during 2026–2031. This growth reflects a continued shift toward preventive healthcare and proactive wellness management across the region. Increasing awareness of lifestyle-related chronic diseases underscores the importance of nutrition-based interventions in reducing health risks before they escalate into medical conditions. Furthermore, rising demand for clean-label, plant-based, and scientifically validated formulations is driving product innovation and premiumization. Advances in nutritional science and ingredient bioavailability are also improving perceived efficacy. Additionally, stricter regulatory oversight is enhancing product credibility and consumer trust, contributing to the market's long-term stability.
Key Report Takeaways
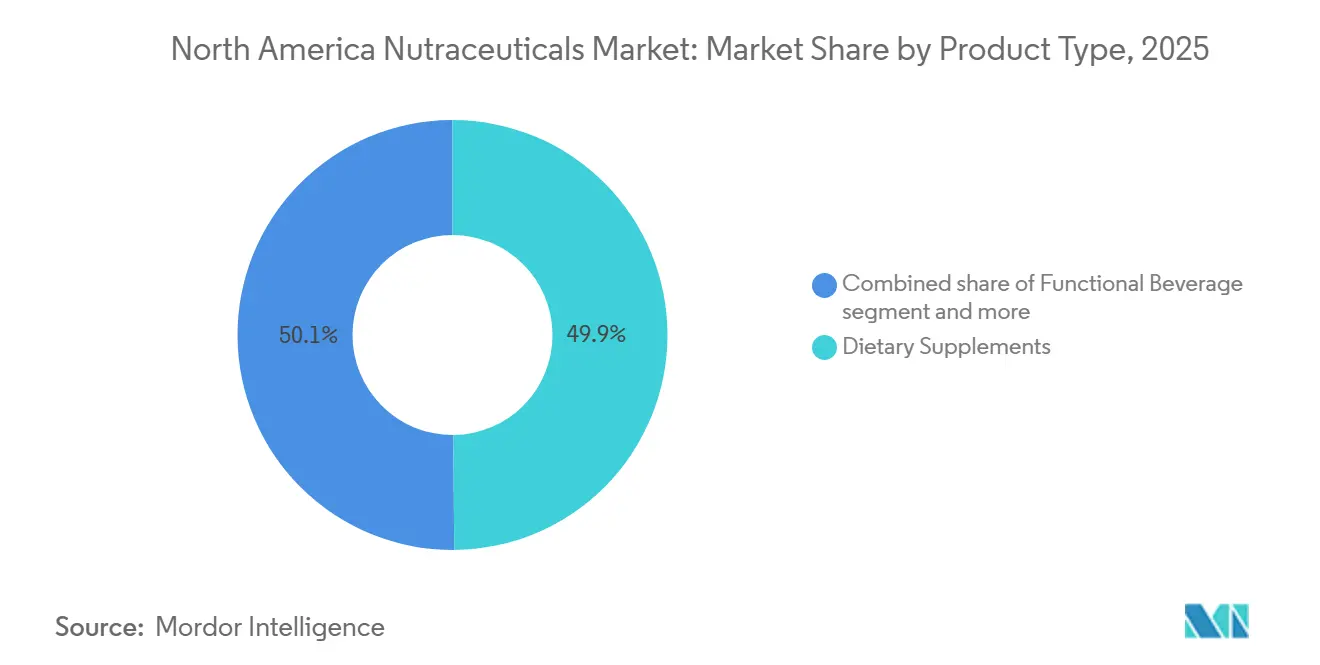
- By product type, dietary supplements led with 49.87% of the North America Nutraceuticals market share in 2025; functional beverages are forecast to expand at a 3.89% CAGR through 2031.
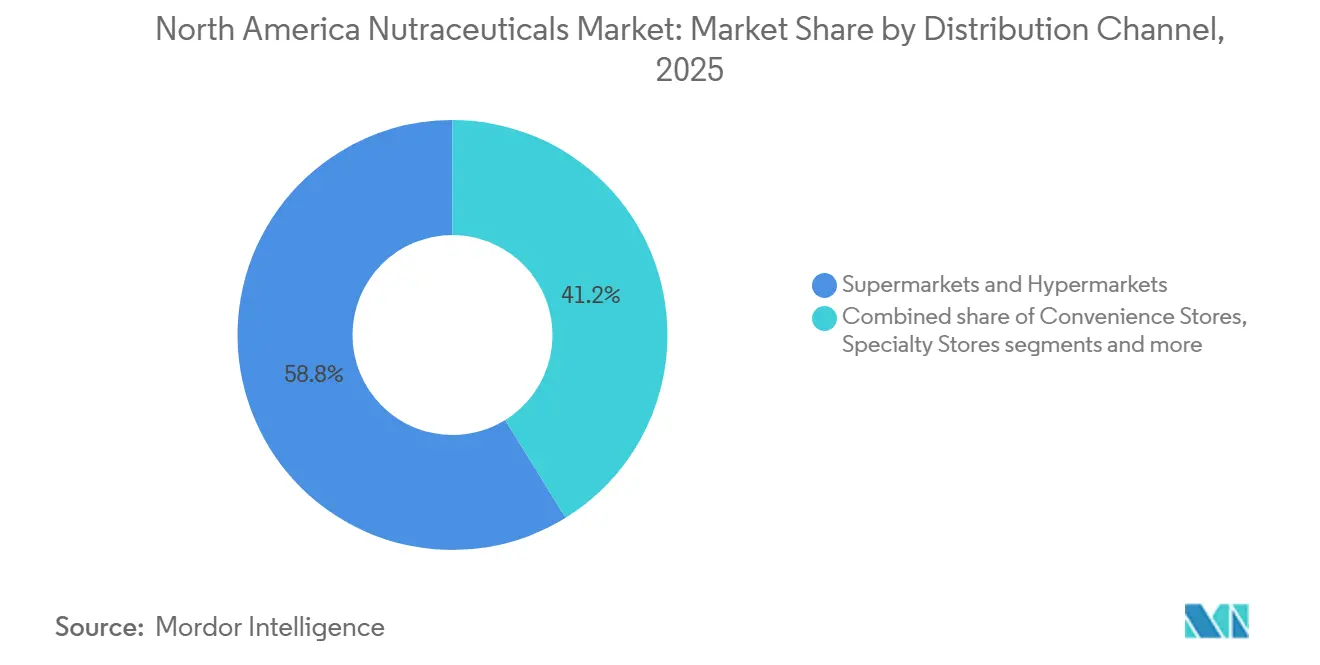
- By distribution channel, supermarkets and hypermarkets held 58.82% share of the North America Nutraceuticals market size in 2025; online retail is the fastest-growing channel with a 5.05% CAGR projected to 2031.
- By geography, the United States commanded 68.09% revenue share in 2025, whereas Mexico is projected to grow at a 4.81% CAGR over 2026-2031.
Note: Market size and forecast figures in this report are generated using Mordor Intelligence’s proprietary estimation framework, updated with the latest available data and insights as of 2026.
Market Trends and Insights
Drivers Impact Analysis of North America Nutraceuticals Market*
| Driver | (~) % Impact on CAGR Forecast | Geographic Relevance | Impact Timeline |
|---|---|---|---|
| Rising consumer health and wellness awareness | +0.9% | United States, Canada, with accelerating adoption in urban Mexico | Medium term (2-4 years) |
| High and growing prevalence of chronic lifestyle diseases | +1.1% | United States (highest burden), Canada, expanding in Mexico | Long term (≥ 4 years) |
| Ageing population with specific health needs | +0.7% | United States, Canada, Mexico | Long term (≥ 4 years) |
| Shift to clean-label, natural, and plant-based ingredients | +0.6% | United States, Canada, early adoption in Mexico City, Monterrey | Medium term (2-4 years) |
| Sports, fitness and protein-focused trends | +0.5% | United States (dominant), Canada, emerging in Mexico | Short term (≤ 2 years) |
| Personalized nutrition and bespoke formulations | +0.4% | United States (coastal markets), Canada (Toronto, Vancouver), limited Mexico penetration | Medium term (2-4 years) |
| Source: Mordor Intelligence | |||


Rising consumer health and wellness awareness
Increasing consumer awareness of health and wellness is a key driver of the North America nutraceuticals market. Consumers are increasingly adopting a proactive approach to health management, emphasizing preventive care and long-term wellness over reactive treatment. Rising awareness of lifestyle-related conditions such as cardiovascular disorders, diabetes, stress, and weakened immunity has strongly motivated individuals to incorporate nutraceutical products into their daily routines, significantly enhancing overall well-being and quality of life. The extensive availability of health information through digital platforms, wellness influencers, medical publications, and healthcare professionals has substantially improved consumer understanding of the critical role played by vitamins, minerals, botanical extracts, probiotics, and functional ingredients in maintaining physiological balance and supporting optimal health.
High and growing prevalence of chronic lifestyle diseases
The increasing prevalence of chronic lifestyle diseases is a key factor driving the North America nutraceuticals market. Rising cases of obesity, cardiovascular disorders, type 2 diabetes, and metabolic syndrome are prompting consumers to adopt preventive health measures, including the regular use of nutraceutical products. According to the Centers for Disease Control and Prevention (CDC), in 2024, the United States reported an adult obesity prevalence of approximately 25% [1]Source: Centers for Disease Control and Prevention (CDC), "Adult Obesity Prevalence Maps", cdc.gov. These figures underscore the widespread nature of lifestyle-related health challenges in the country and emphasize the growing demand for nutritional solutions targeting weight management, heart health, metabolic balance, and overall wellness. As obesity is a major risk factor for various chronic diseases, consumers are increasingly opting for dietary supplements and functional nutrition products designed to support healthier lifestyles. These include products aimed at weight control, cholesterol management, blood sugar regulation, and inflammation reduction.
Ageing population with specific health needs
The aging population in North America is a key structural driver of the nutraceuticals market, as older adults increasingly seek nutritional solutions tailored to support healthy aging and manage age-related conditions. Seniors are more likely to face issues such as reduced bone density, joint mobility challenges, cardiovascular concerns, cognitive decline, vision problems, and weakened immune systems. This has led to sustained demand for nutraceutical products targeting specific health conditions. The demographic shift is reinforcing the importance of preventive nutrition as part of long-term health management strategies, particularly for individuals striving to maintain independence and quality of life in later years. According to Statistics Canada, as of July 2025, approximately 8.1 million people in Canada were aged 65 years and older, highlighting the growing senior population in the region [2]Source: Statistics Canada, "Older Adults and Population Aging", statcan.gc.ca. This expanding demographic significantly influences per-capita supplement consumption, as older consumers typically exhibit higher usage frequency compared to younger age groups.
Shift to clean-label, natural, and plant-based ingredients
The increasing preference for clean-label, natural, and plant-based ingredients is driving market growth, reflecting changing consumer expectations regarding transparency, safety, and sustainability. Consumers are paying closer attention to ingredient lists, favoring products that exclude artificial additives, synthetic preservatives, genetically modified components, and unnecessary fillers. This trend has prompted nutraceutical manufacturers to reformulate products using recognizable, minimally processed, and naturally sourced ingredients, enhancing brand trust and influencing purchase decisions. Furthermore, the growing interest in plant-based lifestyles and environmentally conscious consumption is boosting demand for botanical extracts, herbal actives, algae-derived nutrients, and plant-based proteins. Plant-derived ingredients are often associated with holistic wellness, fewer side effects, and long-term health benefits.
Restraints Impact Analysis of North America Nutraceuticals Market*
| Restraint | (~) % Impact on CAGR Forecast | Geographic Relevance | Impact Timeline |
|---|---|---|---|
| Stringent and evolving regulatory scrutiny | -0.5% | United States (FDA enforcement), Canada (Health Canada modernization), Mexico (COFEPRIS oversight) | Short term (≤ 2 years) |
| Lack of standardization and quality variability | -0.3% | United States (fragmented manufacturing), Canada, Mexico (emerging quality concerns) | Medium term (2-4 years) |
| Risk of misleading or overstated health claims | -0.4% | United States (FDA warning letters), Canada, Mexico | Short term (≤ 2 years) |
| Product safety concerns and recalls | -0.2% | United States (contamination events), Canada, Mexico | Short term (≤ 2 years) |
| Source: Mordor Intelligence | |||
Stringent and evolving regulatory scrutiny
Stringent and evolving regulatory scrutiny in the United States and Canada serves as a significant restraint on the North America nutraceuticals market. This scrutiny increases compliance complexity, lengthens approval timelines, and raises operational costs. In the United States, the Food and Drug Administration (FDA) regulates dietary supplements under established frameworks, requiring manufacturers to ensure product safety and proper labeling. In Canada, Health Canada oversees natural health products through a pre-market licensing system, which mandates evidence of safety, quality, and efficacy prior to commercialization. Companies must obtain Natural Product Numbers (NPNs), adhere to strict Good Manufacturing Practices (GMP) requirements, and comply with detailed labeling standards. Although these regulatory frameworks enhance consumer trust and product credibility, they also prolong product approval cycles and elevate documentation and testing expenses.
Lack of standardization and quality variability
The lack of standardization and quality variability continues to be a significant restraint in the North American nutraceuticals market. Inconsistencies in ingredient potency, purity, and formulation quality can erode consumer confidence and damage brand credibility. Unlike pharmaceuticals, nutraceutical products often exhibit variations in bioactive compound concentrations due to differences in raw material sourcing, extraction techniques, and manufacturing processes. Variability in components such as botanical ingredients, probiotic strains, and omega-3 content can lead to inconsistent efficacy across brands, fostering skepticism among healthcare professionals and informed consumers. Furthermore, fragmented supply chains and dependence on globally sourced raw materials heighten the risks of contamination, adulteration, and mislabeling. Enhancing more robust quality control measures and standardization practices could mitigate these challenges and improve consumer trust in the market.
*Our forecasts treat driver/restraint impacts as directional, not additive. The impact forecasts reflect baseline growth, mix effects, and variable interactions.
North America Nutraceuticals Market Segment Analysis
By Product Type:
Functional Beverages Outpace Legacy FormatsDietary supplements accounted for 49.87% of the North America nutraceuticals market in 2025, driven by their integration into preventive health practices and long-term wellness strategies. According to the Penn State College of Medicine, approximately 59 million Americans regularly used vitamins or supplements in 2024, highlighting the widespread adoption and strong penetration of this category. This trend reflects a shift toward self-directed healthcare, where consumers proactively maintain immunity, support cardiovascular and metabolic health, enhance cognitive performance, and promote healthy aging, reducing reliance on medical interventions. The segment's growth is further supported by increased awareness of micronutrient deficiencies, concerns over lifestyle-related disorders, and growing trust in scientifically validated ingredients.
Functional beverages are projected to grow at a CAGR of 3.89% through 2031 in the North America nutraceuticals market, fueled by rising consumer demand for convenient, on-the-go health solutions that seamlessly integrate nutrition into daily routines. These beverages align with modern lifestyle consumption habits, offering hydration combined with health benefits such as energy enhancement, immune support, digestive wellness, cognitive performance, and metabolic balance. The segment is expanding as consumers increasingly shift away from sugar-laden carbonated drinks and artificial energy beverages, favoring products perceived as natural, fortified, and purpose-driven. Additionally, growing interest in clean-label ingredients, plant-based formulations, and reduced sugar content is driving innovation within this category.


By Distribution Channel:
E-Commerce Disrupts Shelf-Space EconomicsSupermarkets and hypermarkets accounted for 58.82% of the North America nutraceuticals market in 2025, driven by their extensive physical presence, high consumer footfall, and ability to offer a wide range of nutraceutical products under one roof. These retail formats remain the primary purchasing destination for vitamins, dietary supplements, and functional nutrition products due to established consumer trust, immediate product availability, and the opportunity for in-store comparison. The segment benefits from strategic shelf placement in health and wellness aisles, promotional bundling, private-label expansion, and cross-merchandising alongside everyday grocery purchases, which encourages impulse buying and repeat consumption. Additionally, consumers often prefer supermarkets and hypermarkets for health-related purchases because they provide access to recognized national brands and transparent labeling, reinforcing product authenticity and safety.
Online retail channels are projected to grow at a CAGR of 5.05% through 2031 in the North America nutraceuticals market, supported by the steady expansion of e-commerce infrastructure and shifting consumer purchasing behavior toward digital platforms. According to the United States Census Bureau under the United States Department of Commerce, retail e-commerce sales reached USD 310.3 billion in 2025, reflecting a 1.9% increase from the second quarter of 2025, highlighting the resilience and continued momentum of online retail activity [3]Source: United States Census Bureau, "Quarterly Retail E-Commerce Sales", census.gov. This sustained growth environment directly benefits nutraceutical sales, as consumers increasingly prefer the convenience of home delivery, broader product selection, access to detailed ingredient information, and the ability to compare brands and health claims digitally.
Geography Analysis
United States Nutraceuticals Market
The United States accounted for 68.09% of the North American Nutraceuticals Market in 2025, driven by its established supplement culture, advanced product innovation ecosystem, and strong consumer focus on preventive healthcare. The country benefits from widespread awareness of lifestyle-related health issues, high adoption rates of dietary supplements, and a well-developed retail and digital distribution network. The presence of leading nutraceutical manufacturers, ongoing product development in areas such as immunity, cognitive health, sports nutrition, and healthy aging, along with intense marketing and brand competition, further solidifies the United States’ leading position in the regional market.
Mexico Nutraceuticals Market
Mexico is expected to grow at a CAGR of 4.81% through 2031, positioning itself as one of the fastest-growing nutraceutical markets in North America. This growth is primarily driven by increasing awareness of preventive health, rising demand for immunity-boosting and metabolic health products, and greater availability of supplements through pharmacies and modern retail channels. Health-conscious consumers, motivated by concerns over obesity and lifestyle-related conditions, are increasingly adopting nutritional supplements. Additionally, the growing penetration of organized retail and digital commerce platforms is enhancing product accessibility in urban areas, supporting sustained market expansion during the forecast period.
Canada Nutraceuticals Market
Canada’s nutraceutical market is defined by high per-capita supplement consumption, strong e-commerce adoption, and a structured regulatory framework that bolsters consumer confidence. Canadian consumers show a strong preference for natural health products, clean-label formulations, and plant-based ingredients. Regulatory oversight ensures product quality, transparent labeling, and safety compliance, fostering trust in nutraceutical products. Furthermore, Canada’s digitally engaged population and widespread integration of online retail channels contribute to steady growth in direct-to-consumer sales.
Regulatory Landscape
In the United States, nutraceuticals sold as dietary supplements operate under the DSHEA framework, with manufacturing and quality requirements under current Good Manufacturing Practices (21 CFR Part 111). This keeps labeling, identity, and safety substantiation central to commercialization. In March 2026, the US FDA held a public meeting to explore the scope of dietary supplement ingredients, reflecting active re-evaluation of how modern ingredient technologies fit within existing definitions. The discussion raises the importance of well-documented ingredient identity and safety dossiers for New Dietary Ingredient-related pathways.
Competitive Landscape
The North America nutraceuticals market demonstrates moderate concentration, featuring a mix of global food and pharmaceutical conglomerates alongside specialized nutrition companies. Key players include Nestlé S.A., PepsiCo Inc., Abbott Laboratories, Herbalife Nutrition Ltd., and Amway Corp. These companies maintain their market positions through extensive distribution networks, diversified product portfolios, strong research and development (R&D) capabilities, and established brand equity. Their competitive advantages stem from vertical integration, regulatory expertise, clinical validation of select products, and scalability across supermarkets, pharmacies, specialty stores, and digital platforms. Meanwhile, private-label offerings and mid-sized nutraceutical firms heighten competition by delivering targeted, niche formulations.
The competitive dynamics are evolving rapidly with the emergence of digitally native, direct-to-consumer (DTC) brands. New entrants are incorporating AI-driven dosing algorithms, biomarker tracking, personalized nutrition assessments, and subscription-based replenishment models to appeal to younger, tech-savvy consumers willing to pay premiums for customized formulations. This shift toward personalization is transforming purchasing behavior, moving the focus from generalized supplementation to tailored wellness programs. In response, established players are increasingly investing in digital transformation, enhancing e-commerce capabilities, forming strategic partnerships with health-tech firms, or acquiring high-growth disruptor brands to remain competitive and engage digitally active consumer segments.
The competitive edge in the market is increasingly favoring brands that can demonstrate measurable health outcomes. Companies investing in peer-reviewed clinical trials, ingredient traceability, third-party certifications, and transparent labeling practices are gaining stronger consumer trust and differentiation. Scientific substantiation, regulatory compliance, and quality assurance are becoming central to brand positioning rather than secondary marketing claims. In an environment characterized by rising consumer skepticism and regulatory scrutiny, the ability to validate efficacy and safety through credible evidence is emerging as a critical factor for achieving long-term competitive advantage in the North American nutraceuticals market.
North America Nutraceuticals Industry Leaders
-
Nestlé S.A.
-
PepsiCo Inc.
-
Abbott Laboratories
-
Herbalife Nutrition Ltd.
-
Amway Corp.
- *Disclaimer: Major Players sorted in no particular order
North America Nutraceuticals Market Companies Covered in this Report
- Nestle S.A.
- PepsiCo Inc.
- Abbott Laboratories
- Herbalife Nutrition Ltd.
- Amway Corp.
- General Mills Inc.
- Kellanova (Kellogg)
- The Nature's Bounty Co.
- Pfizer Inc.
- Red Bull GmbH
- GNC Holdings LLC
- Jamieson Wellness Inc.
- NOW Health Group Inc.
- Church & Dwight Co. Inc. (Vitafusion)
- Nature's Way Brands LLC
- Pharmavite LLC
- Glanbia plc
- Danone S.A.
- DSM-Firmenich
- BASF SE

Market Opportunities and Future Outlook
Named regulatory and industry programs are creating whitespace for innovation in ingredients and formats while raising the bar on substantiation. The FDA convened a March 2026 public meeting to explore the scope of dietary supplement ingredients, and ongoing engagement around how dietary substances are defined, including newer biotech-derived inputs, supports opportunities for companies that can build compliant identity, safety, and quality packages under established cGMP requirements (21 CFR Part 111) and align labeling with permissible claims. On the supply and capability side, manufacturers and ingredient solution providers are investing to shorten lead times and support faster reformulation cycles for better-for-you positioning across foods, beverages, and supplements. In January 2026, ADM announced a USD 26 million investment in its Erlanger, Kentucky flavors facility to strengthen raw material handling and reformulation capabilities, and in March 2026 TCI Biotech invested over USD 26 million to upgrade its American Fork, Utah facility with new powder, liquid, and jelly sachet production lines. These upgrades expand dosage-form optionality for brands, and, alongside continued channel shifts toward e-commerce and subscription-style replenishment models referenced in the market structure, they improve the commercial pathway for differentiated condition-specific and clean-label formulations across omnichannel distribution.
Recent Industry Developments in North America Nutraceuticals Market
- July 2026: PepsiCo introduced Quaker Oat Shake and Go, positioning oats in an on-the-go shake format for convenience-led nutrition occasions. The launch expands functional breakfast and snack adjacencies and reinforces brand-led innovation in better-for-you packaged nutrition across mass retail channels.
- January 2026: ADM announced a USD 26 million investment in its Erlanger, Kentucky flavors facility to strengthen raw material handling and reformulation capabilities. The expansion supports faster reformulation cycles and improved supply responsiveness for ingredients used across foods, beverages, and supplements, reinforcing North American capability to scale clean-label and condition-specific formulations.
- June 2024: Nestle committed to eliminating the use of FD&C colors in its US food and beverage portfolio by mid-2026. This portfolio-level shift supports clean-label renovation across functional foods and beverages and increases reformulation activity for color systems, flavors, and ingredient sourcing across North American supply chains.


North America Nutraceuticals Market Report Scope and Research Methodology
Market Definition and Coverage
For this study, the market covers nutraceutical products sold in North America that provide added nutritional or health benefits beyond basic food intake, and it is measured in value terms in USD across the study period.
Scope exclusions: We exclude prescription drugs and clinical nutrition that is provided only through inpatient hospital settings, unless it is sold as a consumer nutraceutical product.
Segments Covered in This Report
-
By Product Type
-
Functional Food
- Cereals
- Bakery and Confectionery
- Dairy
- Snacks
- Other Functional Foods
-
Functional Beverage
- Energy Drinks
- Sports Drinks
- Fortified Juice
- Dairy and Dairy-Alternative Beverages
- Other Functional Beverages
-
Dietary Supplements
- Vitamins and Minerals
- Botanicals
- Enzymes
- Fatty Acids
- Proteins
- Other Dietary Supplements
-
Functional Food
-
By Distribution Channel
- Supermarkets and Hypermarkets
- Convenience Stores
- Specialty Stores
- Online Retail Stores
- Other Distribution Channels
-
By Geography
- United States
- Canada
- Mexico
- Rest of North America
Data Sources, Market Sizing, and Validation
Desk Research
Desk work starts by building a clean view of category definitions, label rules, and demand signals for nutraceutical consumption across the United States, Canada, and Mexico. We typically rely on public sources such as the US Food and Drug Administration, Health Canada, the US Department of Agriculture, and the Centers for Disease Control and Prevention to understand product claims, fortification norms, and health trends that influence demand.
We also review trade and macro indicators that help explain value growth, such as inflation trends, household spending patterns, and cross border flows, using sources such as the US Census Bureau, Statistics Canada, and customs trade statistics. To ground company level context, we use annual reports, investor presentations, press releases, and trusted industry association publications, followed by selective use of paid subscriptions for company financials, patent landscaping, and shipment level import and export reads when it helps validate assumptions. These examples are not exhaustive, and many other public and paid sources were also used for data collection, validation, and clarification.
Primary Interviews and Surveys
Primary work is used to test what we see in public sources and to add practical inputs that are hard to confirm from documents alone, such as price moves by channel and the pace of premiumization within key nutraceutical formats. We spoke with a mix of manufacturers, ingredient suppliers, distributors, retailers, and category experts across North America, and then we rechecked key assumptions with different respondent roles so the model did not rely on one viewpoint.
Distribution of primary research fieldwork respondents
| Company type | Respondent position |
|---|---|
| Top tier: 34% | CXOs: 14% |
| Mid tier: 45% | Functional/Unit leaders: 35% |
| Smaller Players: 21% | Managers: 51% |
Market-Sizing & Forecasting
Sizing starts with a top down build that reconstructs the nutraceutical value pool by combining category level consumption signals and channel sales structures across North America, and then translating them into a consistent USD market value. Once a first cut is formed, it is corroborated with selective bottom up approximations, such as sampled price points by format times estimated volumes for key channels, followed by supplier and retailer checks to adjust totals where needed.
Inputs that tend to matter most in this market include functional food and beverage penetration, dietary supplement usage incidence, average selling price movement by distribution channel, mix shifts toward premium formulations, and regulatory or labeling changes that affect product claims and launches. For forecasting, we mainly use scenario analysis supported by expert views, because growth is sensitive to consumer health priorities, inflation led trade downs, and the pace of innovation within vitamins, botanicals, and fortified formats. When bottom up visibility is uneven, we handle gaps by using proxy categories with similar price ladders and consumption behavior, and then we validate the implied growth rates with interview feedback before finalizing the series.
Data Validation & Update Cycle
Validation is done through repeated variance checks across steps, so outputs are compared against independent signals like category growth commentary, channel mix expectations, and broad health and wellness demand indicators. If a sub market total looks out of pattern, the assumption is reopened and the team recontacts sources to confirm whether the change is real or caused by a definition or pricing mismatch.
Before sign off, numbers and logic are reviewed in multiple passes, first by the analyst building the model and then by a second reviewer who checks math consistency, scope alignment, and forecast reasonableness. Reports are refreshed annually, and interim updates are made when material events shift the outlook, followed by a final pre delivery scan so clients receive the latest view available at that time.
Mordor Intelligence's North America Nutraceutical Market Estimate Compared With Other Published Estimates
Published market values for nutraceuticals in North America can vary a lot, even when the topic name looks the same, because the included product baskets and the way value is counted are not always consistent. Differences also show up when one publisher anchors on retail sales, another uses manufacturer revenues, or the forecast assumptions are updated at different times.
Some estimates expand the scope to include medical foods and parts of specialized clinical nutrition, which lifts totals even if demand drivers are similar. In Mordor Intelligence, the count is kept to functional foods, functional beverages, and dietary supplements sold as nutraceuticals in North America, and the value is kept consistent across channels to reduce double counting when products move through distributors.
Benchmark comparison
| Source | Market Size | Gaps in Research Methodology |
|---|---|---|
| Mordor Intelligence | USD 191.09 B (2025) | |
| Industry Publisher A | USD 163.41 B (2025) | Uses a narrower stated base and appears to apply a different product mapping for nutraceutical categories, which can understate value when functional foods and beverages are not fully captured in the same basket. |
| Industry Publisher B | USD 176.58 B (2026) | Different base year and higher growth assumptions can shift the starting point, and the definition notes medical foods which can change what is counted and how pricing is treated across channels. |
Overall, the spread mainly comes from what gets included under nutraceuticals, the year chosen for the headline value, and how pricing is normalized across channels. By keeping the scope rules explicit and tying the totals to observable consumption and channel signals, the sizing steps stay repeatable and easier to audit when assumptions need to be refreshed.


Key Questions Answered in the Report
What is the projected size of the North America nutraceuticals space by 2031?
It is forecast to reach USD 236.55 billion, rising from USD 198.01 billion in 2026 at a 3.62% CAGR over 2026-2031.
Which product category is expected to register the quickest growth during the forecast period?
Functional beverages are projected to expand at 3.89% per year, the fastest pace among all product types.
How fast are online sales expanding across the region?
E-commerce is on track for a 5.05% CAGR through 2031, making it the most rapidly growing distribution channel.
Why are pediatric nutraceutical formulations gaining traction?
Parental focus on preventive health and convenient gummy formats is pushing pediatric SKUs to a 4.56% CAGR, the highest among end-user segments.
Page last updated on:





