North America Maize Market Analysis by Mordor Intelligence
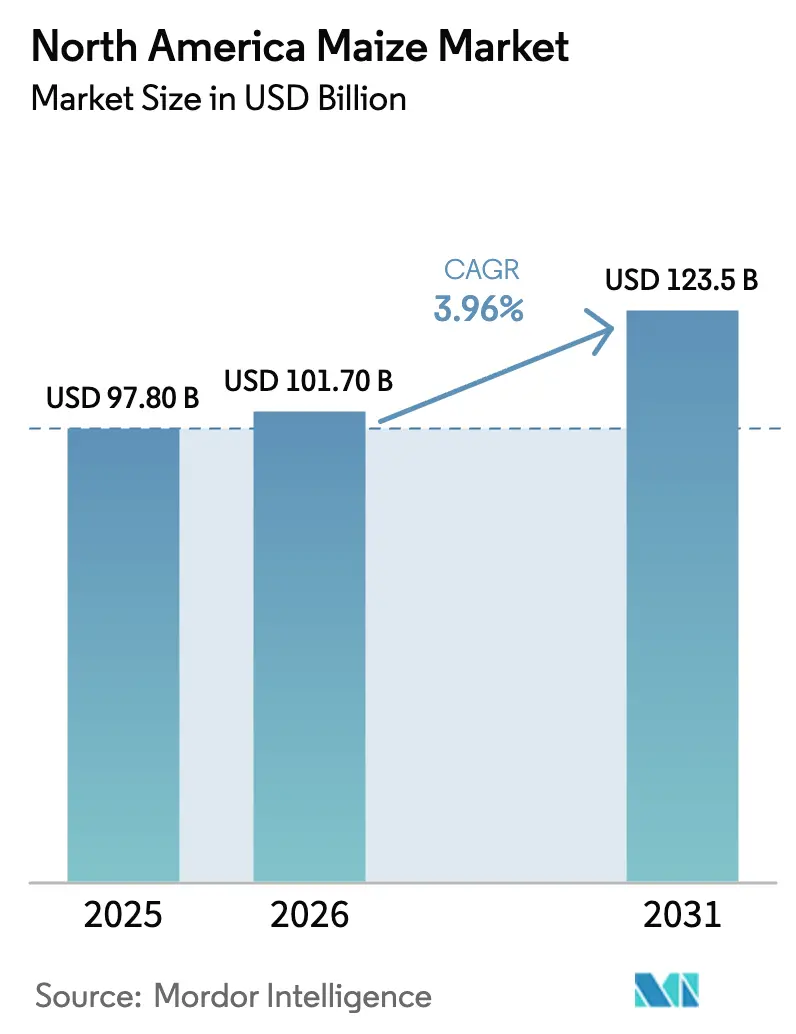
The North America maize market size was valued at USD 97.80 billion in 2025 and is estimated to grow from USD 101.7 billion in 2026 to USD 123.5 billion by 2031, at a CAGR of 3.96% during the forecast period (2026-2031). Renewable-fuel mandates, robust livestock feed demand, and expanding industrial uses such as polylactic acid (PLA) bioplastics keep corn in a central position within regional cropping systems. Long-term biofuel targets secure a baseline pull of almost 5.5 billion bushels for ethanol each year, while animal feed consumption remains anchored near 5.2 billion bushels despite gradual feed-efficiency gains. Growth pockets also come from premium pet-food recipes and carbon-credit programs that reward conservation tillage, both of which lift acreage profitability without raising planted hectares. The market’s competitive landscape is fragmented, allowing regional cooperatives and tech-enabled start-ups to gain share against global grain merchants that traditionally dominated origination and export corridors.
Key Report Takeaways
- By geography, the United States captured 75% of North America maize market revenue in 2025, while Mexico posted the fastest 5.6% CAGR from 2026 to 2031.
Note: Market size and forecast figures in this report are generated using Mordor Intelligence’s proprietary estimation framework, updated with the latest available data and insights as of January 2026.
North America Maize Market Trends and Insights
Drivers Impact Analysis*
| Driver | (~) % Impact on CAGR Forecast | Geographic Relevance | Impact Timeline |
|---|---|---|---|
| Robust livestock feed demand | +0.7% | United States, Mexico, Canada | Medium term (2-4 years) |
| Expanding ethanol blending mandates | +0.8% | United States, Canada | Long term (≥4 years) |
| Growth in pet-food manufacturing | +0.4% | United States, Canada | Medium term (2-4 years) |
| Rising corn-based bioplastics output | +0.5% | United States, Mexico | Long term (≥4 years) |
| Surge in on-farm precision-ag adoption | +0.6% | United States, Canada | Medium term (2-4 years) |
| Carbon-credit revenues for conservation tillage | +0.3% | United States | Short term (≤2 years) |
| Source: Mordor Intelligence | |||
Robust Livestock Feed Demand
North America poultry and swine systems consumed the majority of bushels in 2025, a level that is likely to hold as herd rebuilding in the pork sector and steady broiler placements offset incremental efficiency gains [1]Source: United States Department of Agriculture, “World Agricultural Supply and Demand Estimates,” usda.gov. Mexico imported 18.5 million metric tons of United States yellow corn for feed in 2025, reflecting the cost and mycotoxin-control advantages that rail logistics offer to Jalisco and Veracruz. Canadian aquaculture feed formulators substituted soybean meal with corn gluten meal, adding 200,000 metric tons of annual demand by 2026. Corn, therefore, retains versatility across monogastric, ruminant, and aquafeed channels, preserving a broad base of structural demand.
Expanding Ethanol Blending Mandates
The United States Environmental Protection Agency finalized Renewable Fuel Standard volumes that keep corn-ethanol uptake close to 15 billion gallons a year, or 5.5 billion bushels of feedstock [2]Source: U.S. Environmental Protection Agency, “Renewable Fuel Standard Program,” epa.gov. Midwest states committed USD 45 million to retrofit 1,200 retail sites for year-round (15% Ethanol) E15 sales, which safeguards seasonal throughput. Canada’s Clean Fuel Regulations require 10% renewable content in gasoline by 2030, adding 400 million liters of incremental ethanol demand by 2027. Stable Renewable Identification Number prices above USD 0.80 per gallon keep crush margins positive even when crude prices fluctuate, underpinning plant utilization near 90% and shielding the North America maize market from abrupt ethanol slowdowns.
Growth in Pet-Food Manufacturing
Premium dog and cat food makers expanded grain-inclusive formulas in 2025, lifting demand for corn gluten meal by 8% year over year [3]Source: American Pet Products Association, “Pet Industry Market Size and Ownership Statistics,” americanpetproducts.org. Nestlé Purina and Mars Petcare collectively sourced approximately 1.2 million metric tons of the ingredient, highlighting its digestibility and amino acid profile, which enable a reduction in synthetic methionine costs by USD 15 per metric ton of finished feed. Consumers concerned about legume-driven canine cardiomyopathy have shown a preference for recipes that use corn as the primary carbohydrate, thereby broadening the market for premium grain-inclusive products. These cost benefits, combined with consumer health considerations, strengthen corn's role in the rapidly growing pet food market.
Rising Corn-Based Bioplastics Output
North America maize market is experiencing growth driven by the increasing demand for corn-based bioplastics, particularly polylactic acid (PLA). Producing 1 kg of PLA typically requires approximately 2.5 kg of corn, underscoring corn's role as a critical feedstock. The global expansion of PLA, including NatureWorks' integrated complex currently under development in Thailand, highlights the growing momentum for bio-based polymers, which positively impacts maize demand in North America. Prominent companies such as PepsiCo and Unilever are advancing recyclable, compostable, and alternative packaging solutions, contributing to the long-term growth of PLA usage. Furthermore, regulatory measures like California Senate Bill 54, which mandates compostable or recyclable packaging by 2031, are driving the adoption of bio-based materials and enhancing the prospects for corn-derived bioplastics.
Restraints Impact Analysis*
| Restraint | (~) % Impact on CAGR Forecast | Geographic Relevance | Impact Timeline |
|---|---|---|---|
| Heightened pest and disease pressure episodes | -0.5% | United States, Canada, Mexico | Medium term (2-4 years) |
| Price volatility tied to energy markets | -0.4% | United States, Mexico, Canada | Short term (≤2 years) |
| Increasing water-use restrictions | -0.3% | United States (High Plains) | Long term (≥4 years) |
| Export route bottlenecks on Mississippi River | -0.2% | United States (Midwest) | Short term (≤2 years) |
| Source: Mordor Intelligence | |||
Heightened Pest and Disease Pressure Episodes
Resistance to widely planted Bacillus thuringiensis (Bt) traits forced 8% of Midwest farms to use soil insecticides in 2024, raising costs by up to USD 35 per acre and eroding margins in high-rent counties. New seed blends that stack four or five Bacillus thuringiensis (Bt) proteins carry premiums of USD 15 to USD 18 per acre, limiting adoption to the most pest-prone fields. Tar spot spread into Michigan and Wisconsin, slicing yields by 20 to 40 bushels per acre when fungicides were not applied, a threat that forces extra passes and chemical spend. Layered pathogen management costs reduce profitability and limit the rate at which the North America maize market expands its acreage.
Price Volatility Tied to Energy Markets
Corn futures posted a 0.72 correlation with West Texas Intermediate crude during 2025, meaning crude swings rapidly shift ethanol margins and elevator bids. When oil dropped from USD 85 to USD 72 per barrel midyear, ethanol margins halved, and six plants temporarily idled, removing roughly 80 million bushels of feedstock demand. Renewable Identification Number prices partly cushioned the shock, but the lag created breakeven windows that squeezed working capital. Growers who forward contract corn near harvest risk basis mismatches whenever fuel markets slide, cutting net prices by USD 0.30 to USD 0.50 per bushel within a quarter.
*Our forecasts treat driver/restraint impacts as directional, not additive. The impact forecasts reflect baseline growth, mix effects, and variable interactions.
Geography Analysis
The United States is projected to dominate the North America maize market in 2026, accounting for 75% of the market. It is projected to harvest 15.1 billion bushels, generating USD 68 billion in farmgate revenue. From 2023-2024, strong biofuel mandates absorbed 5.5 billion bushels of feedstock, and livestock systems consumed an additional 5.4 billion bushels, keeping interior basis levels firm. Mexico was the fastest-growing geography, expanding at a 5.6% CAGR as its import program reached 18.5 million metric tons to supply feed mills and the emerging ethanol blend target. Rail corridors from Texas and Kansas deliver corn to Jalisco and Veracruz in under five days, underpinning a reliable cross-border flow that stabilizes the North America maize market.
Canada produced 450 million bushels in 2026, with Ontario and Quebec accounting for more than 90% of output and channeling most of the grain to domestic feed and to adjacent United States ethanol plants. Non-genetically modified corn covered 180,000 acres and earned premiums of USD 0.30 to USD 0.40 per bushel in European poultry feed markets. Clean Fuel Regulations will lift Canadian ethanol demand by 400 million liters by 2027, requiring an extra 140 million bushels of corn feedstock. Cooler growing seasons cap yield at 128 bushels per acre, yet proximity to Great Lakes ports secures freight advantages into Atlantic and European destinations.
Ongoing capacity upgrades at United States ethanol plants, Mexican starch and milling facilities, and Canadian renewable-fuel projects will collectively raise regional intake, extending the upside for the North America maize market. Improved adoption of precision agriculture in the United States and Canada increases yield potential, while carbon-credit incentives finance soil-health practices that protect long-term productivity. Mexico is scaling rail and storage infrastructure near Gulf ports, which will streamline imports and lessen exposure to Mississippi River bottlenecks. Together, these initiatives tighten supply chains, broaden processing demand, and reinforce the region’s position as the cornerstone of global corn trade.
Competitive Landscape
The top five players accounted for the majority of 2026 revenue in the North America maize market, indicating a moderately concentrated field. Archer Daniels Midland Company leverages an extensive number of elevators, a diverse range of river terminals, and more than 3 wet-milling plants to handle a significant amount of bushels annually, giving it scale across origination, processing, and export channels. Cargill Incorporated has also established itself as a diversified provider of elevators and export terminals, while partnering with around 15,000 contract growers, allowing it to match interior origination with Gulf, Pacific Northwest, and Atlantic vessel programs. Both firms have committed capital to regenerative-agriculture incentives that pay growers USD 10 to USD 15 per acre for soil-health practices, tightening supplier loyalty as sustainability metrics become embedded in downstream contracts.
In 2023, Bunge Limited extended its competitive reach through crush expansions and its new 300,000-metric-ton corn-milling joint venture in Guanajuato, Mexico, that targets tortilla-flour sales to Gruma and Maseca. Louis Dreyfus Company maintains a lighter asset model but achieved ISO 14001 certification across eight United States elevators after energy-efficiency upgrades cut electricity use by 12% in 2024. In 2024, CHS Inc. differentiated itself with farmer ownership and added a 12-million-bushel elevator in Grand Forks, North Dakota, expanding rail-car capacity to 110 units and improving access to Pacific Northwest export lanes. Together, these firms deepen origination footprints and diversify processing portfolios, sustaining a competitive buffer against the two market leaders.
Forward growth centers on carbon-credit monetization, bioprocessing diversification, and digital traceability platforms that lock in high-margin identity-preserved flows. Archer Daniels Midland Company and LG Chem achieved a significant growth in commercial output of the polylactic acid plant that consumes a significant amount of corn annually and pre-sold capacity to multinational beverage and snack brands. In 2025, Cargill expanded its Eddyville, Iowa, complex by 150 million bushels and added a high-fructose corn syrup line to capture beverage-sector demand, while Green Plains retrofitted four ethanol plants with carbon-capture units to secure low-carbon fuel credits. Ongoing seed-trait innovation by Corteva Agriscience and Bayer CropScience also supports the supply side by protecting yields and lowering nitrogen needs, a synergy that helps processors source reliable volumes even as climate risks intensify.
Recent Industry Developments
- December 2025: Maizex Seeds committed fresh capital to expand seed-corn production and conditioning facilities in Chatham, Ontario. The project increases domestic hybrid seed supply, reduces reliance on United States seed imports, and supports yield gains that reinforce the North America maize market.
- January 2025: Brevant Seeds, a brand of Corteva Agriscience, introduced 11 new corn hybrids featuring enhanced drought tolerance and rootworm protection for the 2025 planting season. The broader genetics lineup bolsters grower resilience on marginal acres, stabilizes regional output, and sustains volume growth in the North America maize market.
- August 2024: Syngenta has added eight new hybrids to its NK Seeds corn portfolio for the 2025 growing season. This product launch is intended to help growers enhance yields with seeds tailored for diverse farming conditions.


North America Maize Market Report Scope
Maize is a cereal crop cultivated for feed and human consumption. The market studied for this report consists of domestically and internationally traded maize. The North America Maize Market Report is Segmented by Geography (United States, Canada, and Mexico). The Report Includes Production Analysis (Volume), Consumption Analysis (Value and Volume), Import Analysis (Value and Volume), Export Analysis (Value and Volume), Wholesale Price Trend Analysis and Forecast, List of Key Players, Regulatory Framework, Logistics and Infrastructure, and Seasonality Analysis. The Market Forecasts are Provided in Terms of Value (USD) and Volume (Metric Tons).
By Geography
| United States | Production Analysis (Area Harvested, Yield, and Production Volume) |
| Consumption Analysis (Consumption Value and Volume) | |
| Import Market Analysis (Import Value, Volume, and Key Supplying Markets) | |
| Export Market Analysis (Export Value, Volume, and Key Destination Markets) | |
| Wholesale Price Trend Analysis and Forecast | |
| Regulatory Framework | |
| List of Key Players | |
| Logistics and Infrastructure | |
| Seasonality Analysis | |
| Mexico | Production Analysis (Area Harvested, Yield, and Production Volume) |
| Consumption Analysis (Consumption Value and Volume) | |
| Import Market Analysis (Import Value, Volume, and Key Supplying Markets) | |
| Export Market Analysis (Export Value, Volume, and Key Destination Markets) | |
| Wholesale Price Trend Analysis and Forecast | |
| Regulatory Framework | |
| List of Key Players | |
| Logistics and Infrastructure | |
| Seasonality Analysis | |
| Canada | Production Analysis (Area Harvested, Yield, and Production Volume) |
| Consumption Analysis (Consumption Value and Volume) | |
| Import Market Analysis (Import Value, Volume, and Key Supplying Markets) | |
| Export Market Analysis (Export Value, Volume, and Key Destination Markets) | |
| Wholesale Price Trend Analysis and Forecast | |
| Regulatory Framework | |
| List of Key Players | |
| Logistics and Infrastructure | |
| Seasonality Analysis |
| By Geography | United States | Production Analysis (Area Harvested, Yield, and Production Volume) |
| Consumption Analysis (Consumption Value and Volume) | ||
| Import Market Analysis (Import Value, Volume, and Key Supplying Markets) | ||
| Export Market Analysis (Export Value, Volume, and Key Destination Markets) | ||
| Wholesale Price Trend Analysis and Forecast | ||
| Regulatory Framework | ||
| List of Key Players | ||
| Logistics and Infrastructure | ||
| Seasonality Analysis | ||
| Mexico | Production Analysis (Area Harvested, Yield, and Production Volume) | |
| Consumption Analysis (Consumption Value and Volume) | ||
| Import Market Analysis (Import Value, Volume, and Key Supplying Markets) | ||
| Export Market Analysis (Export Value, Volume, and Key Destination Markets) | ||
| Wholesale Price Trend Analysis and Forecast | ||
| Regulatory Framework | ||
| List of Key Players | ||
| Logistics and Infrastructure | ||
| Seasonality Analysis | ||
| Canada | Production Analysis (Area Harvested, Yield, and Production Volume) | |
| Consumption Analysis (Consumption Value and Volume) | ||
| Import Market Analysis (Import Value, Volume, and Key Supplying Markets) | ||
| Export Market Analysis (Export Value, Volume, and Key Destination Markets) | ||
| Wholesale Price Trend Analysis and Forecast | ||
| Regulatory Framework | ||
| List of Key Players | ||
| Logistics and Infrastructure | ||
| Seasonality Analysis | ||


Key Questions Answered in the Report
How large is the North America maize market in 2026?
The market is valued at USD 101.7 billion in 2026, with a 3.96% CAGR projected through 2031.
What share of regional corn goes into ethanol production?
Ethanol plants consume about 5.5 billion bushels each year, roughly 36% of the total United States supply.
Which country is the fastest-growing importer of United States corn?
Mexico shows the fastest growth, with import volumes expanding at a 5.6% CAGR through 2031.
Why are premiums for white corn rising?
Premiums stem from Mexico's preference for non-genetically modified white corn in tortillas and United States specialty food demand.
How is precision agriculture affecting corn yields?
Autosteer and variable-rate technologies add 3 to 5 bushels per acre in fields with high soil heterogeneity.
What is driving the increase in corn-based bioplastics?
New polylactic acid (PLA) plants, brand sustainability pledges, and packaging regulations are pushing regional Polylactic Acid capacity past 165,000 metric tons and boosting corn demand.
Page last updated on:


