Market Overview
| Study Period | 2018 - 2031 |
|---|---|
| Forecast Data Period | 2026 - 2031 |
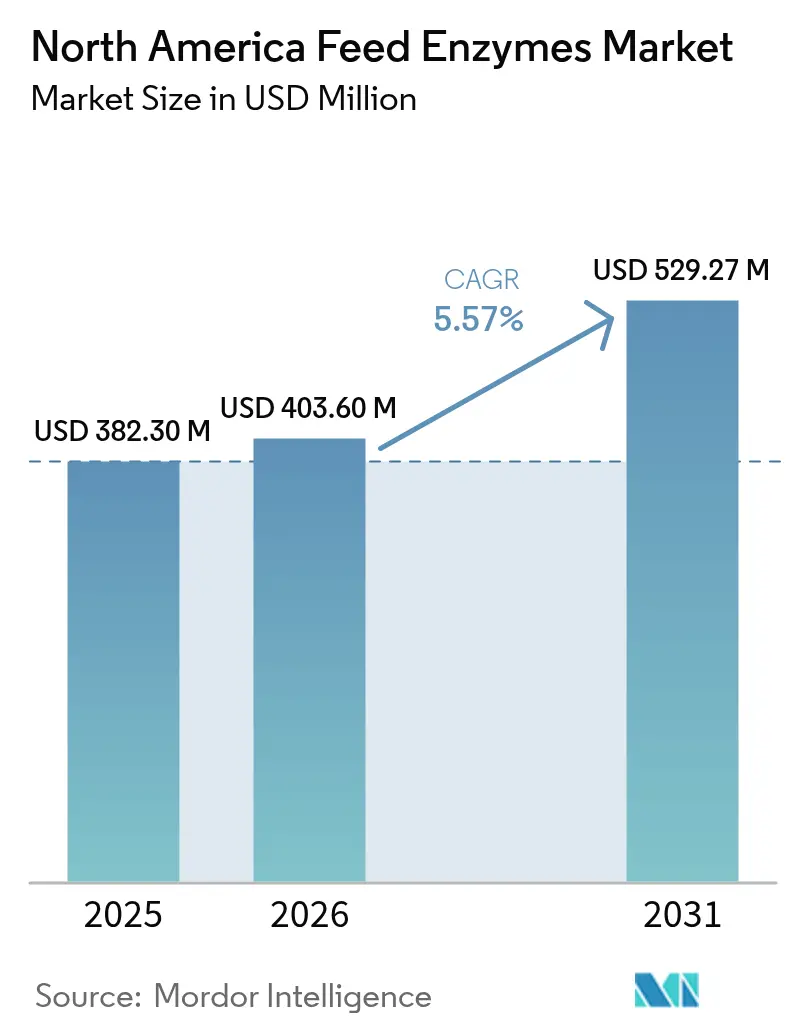
| Base Year Market Size (2025) | USD 382.3 Million |
| Market Size (2026) | USD 403.6 Million |
| Market Size (2031) | USD 529.27 Million |
| Growth Rate (2026 - 2031) | 5.57% CAGR |
| Market Concentration | Medium |
Major Players *Disclaimer: Major Players sorted in no particular order Image © Mordor Intelligence. Reuse requires attribution under CC BY 4.0. | |
North America Feed Enzymes Market Analysis by Mordor Intelligence
The North America feed enzymes market size is expected to grow from USD 382.3 million in 2025 to USD 403.6 million in 2026 and is forecast to reach USD 529.27 million by 2031 at 5.57% CAGR over 2026-2031. The expansion reflects a confluence of stricter state and federal mandates to curb antibiotic use, regulation-driven demand for phosphorus mitigation, and rapid gains in enzyme stability technologies. Lowered formulation costs for high-temperature pelleted feeds further accelerate uptake, while precision livestock-farming platforms deliver real-time enzyme response modeling that improves dosing accuracy. The growing popularity of alternative protein diets in poultry and swine drives sophisticated protease blends, and heightened volatility in phosphate rock pricing reinforces phytase adoption.
Key Report Takeaways
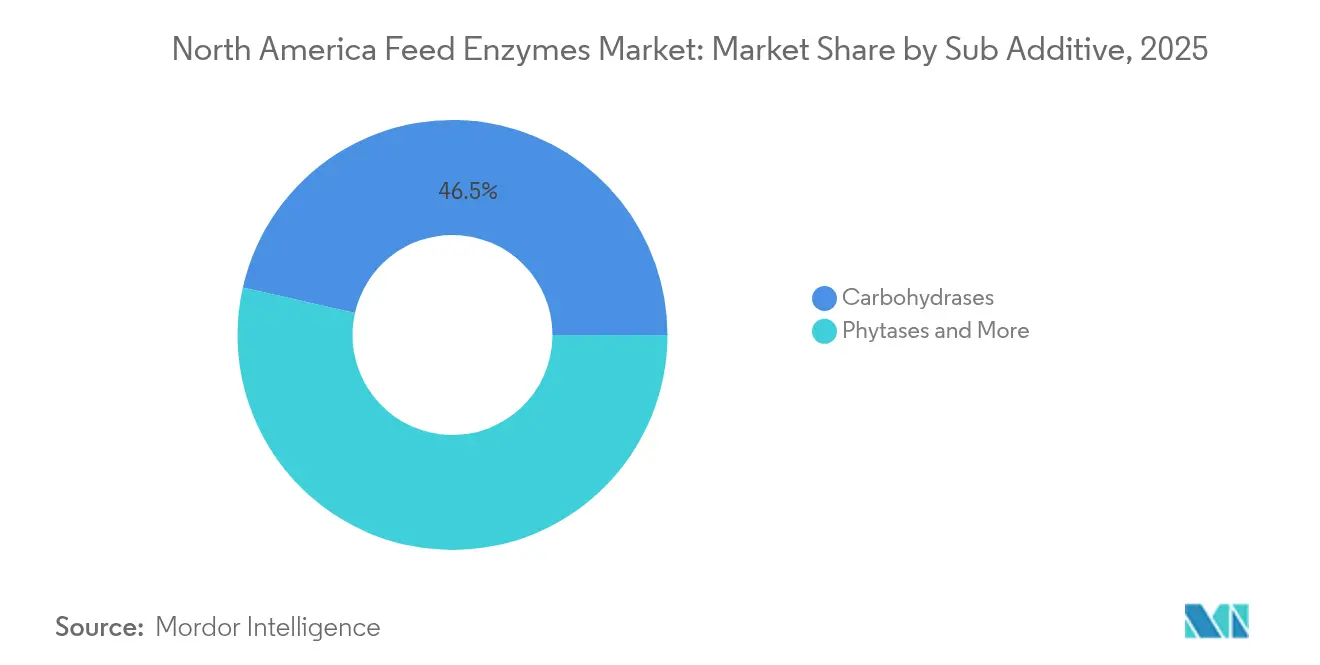
- By sub-additive, carbohydrases held 46.45% of the North America feed enzymes market share in 2025, and are projected to expand with a CAGR of 5.72% through 2031.
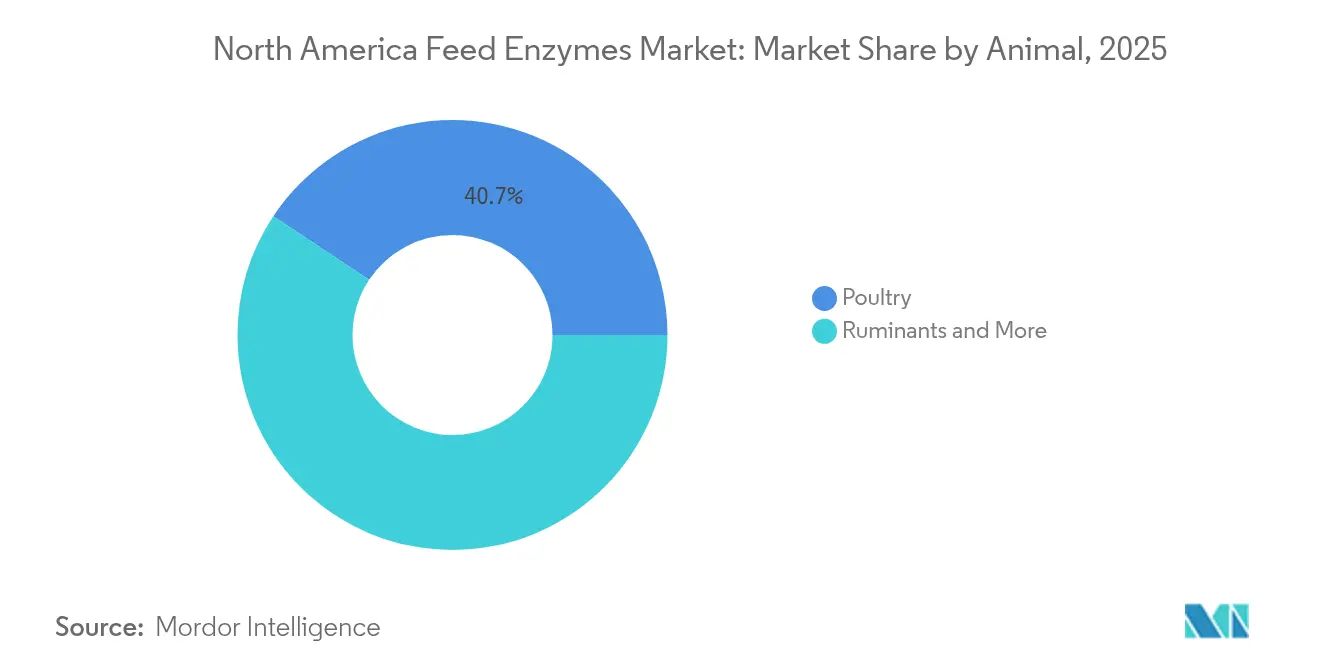
- By animal, poultry applications represented 40.68% of the North America feed enzymes market in 2025, while ruminants are poised for the fastest 6.21% CAGR through 2031.
- By geography, the United States accounted for 69.85% of regional revenue in 2025 and leads expansion with a 6.08% CAGR to 2031.
Note: Market size and forecast figures in this report are generated using Mordor Intelligence’s proprietary estimation framework, updated with the latest available data and insights as of 2026.
North America Feed Enzymes Market Trends and Insights
Drivers Impact Analysis*
| Driver | (~) % Impact on CAGR Forecast | Geographic Relevance | Impact Timeline |
|---|---|---|---|
| Surging phytase adoption for phosphorus mitigation | +1.2% | United States and Canada | Medium term (2-4 years) |
| Expansion of protease blends for alternative-protein diets | +0.8% | Global, North America leading | Medium term (2-4 years) |
| R&D in heat-stable enzyme encapsulation | +0.9% | North America and Europe | Long term (≥ 4 years) |
| Rise in antibiotic-reduction regulations in feed | +1.1% | United States with state variations | Short term (≤ 2 years) |
| Growth of precision livestock-farming data analytics | +0.7% | United States early adoption | Medium term (2-4 years) |
| Increasing penetration of direct-fed microbials-integrated enzymes | +0.5% | Emerging in North America | Long term (≥ 4 years) |
| Source: Mordor Intelligence | |||


Surging Phytase Adoption for Phosphorus Mitigation
Tighter watershed regulations in California and the Great Lakes compel feed mills to replace costly inorganic phosphates with phytase supplementation. Current phytase formulations unlock more than 70% of intrinsic phosphorus in grains, enabling a 40% reduction in external phosphate use while sustaining animal performance. Higher phosphate rock price swings intensify the cost-saving appeal, and integrated livestock companies capitalize on environmental compliance incentives that offer preferred financing rates for nutrient-efficient operations. Broadening adoption spans broilers, layers, and expanding swine finishers, with phytase cocktails increasingly paired with carbohydrase activities to address multi-grain rations. The regulatory-economic harmony positions phytase as the fastest-growing component of the carbohydrase family. Feed-formulation software modules now auto-calculate phytase matrix credits, confirming its mainstream status across U.S. and Canadian commercial mills.
R&D in Heat-Stable Enzyme Encapsulation
Pelleting temperatures above 90 °C once destroyed enzyme activity, but core-shell and pan-coating advances now secure functional survival through conditioning and cooling. Kemin offers a GEM coating system in the region that locks the active site of protease and carbohydrase molecules until pH triggers dissolution in the gastrointestinal tract [1]Source: Kemin Industries, “Delivering Optimal Nutrition with Encapsulation Technologies,” Kemin, kemin.com . Feed mills can therefore broaden enzyme inclusion in high-temperature pelleted poultry and swine diets without post-pellet spraying, which reduces labor and contamination risks. Encapsulation further enables inclusion of lipase and specialty enzymes formerly considered too sensitive, expanding addressable feed volumes across integrated manufacturers. The innovation comes as large broiler complexes standardize on pellet durability indexes above 90, opening a vast installed base for heat-stable enzyme solutions through 2030.
Rise in Antibiotic-Reduction Regulations in Feed
Following the 2024 expiration of the FDA-AAFCO Memorandum of Understanding in the United States, new discretionary enforcement allows a quicker transition away from routine antibiotic growth promoters. States, including California and Maryland, impose additional stewardship limits, and federal Veterinary Feed Directive updates reduce prophylactic use windows. Enzymes that improve gut integrity by lowering digesta viscosity or enhancing short-chain fatty acid production gain traction as scientifically validated alternatives. Independent poultry integrators report measurable declines in feed conversion when carbohydrase-accompanied diets replace bacitracin, prompting broader rollouts. Regulatory momentum fosters sustained enzyme demand, and suppliers bundle data packages demonstrating health and performance outcomes to expedite approval for novel formulations.
Increasing Penetration of Direct-Fed Microbials-Integrated Enzymes
Co-formulations combining xylanase with Bacillus probiotics deliver synergistic improvements in gut morphology and pathogen exclusion, appealing to integrators aiming to meet “no antibiotics ever” label claims. Novus International collaborates with Resilient Biotics to accelerate the commercialization of swine respiratory solutions that blend microbial and enzymatic modes of action [2]Source: Feed Strategy Staff, “Novus, Resilient Biotics Partner on New Swine Health Solution,” Feed Strategy, feedstrategy.com . Although regulatory pathways remain complex, early approvals spur R&D into dairy and aqua combinations. Customers view multi-functional premixes as a route to simplification, replacing three or four standalone additives with a single granular product. Manufacturers using encapsulation ensure survival of both enzymes and live microbial spores through pelleting, extending shelf life, and broadening distribution reach.
Restraints Impact Analysis*
| Restraint | (~) % Impact on CAGR Forecast | Geographic Relevance | Impact Timeline |
|---|---|---|---|
| Volatility in raw-material prices of microbial fermentation | -0.9% | United States supply chain pressures | Short term (≤ 2 years) |
| Regulatory uncertainty around GMO-derived enzyme strains | -0.7% | State and federal oversight variability | Medium term (2-4 years) |
| High cost barriers for small-scale feed mills | -0.6% | Rural independents in North America | Long term (≥ 4 years) |
| Competition from non-enzymatic feed additives (organic acids) | -0.5% | United States and Canada | Medium term (2-4 years) |
| Source: Mordor Intelligence | |||
Volatility in Raw-Material Prices of Microbial Fermentation
Corn and sugar substrates critical for fungal and bacterial fermentations face price swings linked to weather events and biofuel policy shifts in the North American region. Enzyme margins compress when carbon source costs rise faster than contract price escalators allow, forcing smaller suppliers to either absorb losses or cede share. Spot shortages in pharmaceutical-grade glucose further complicate production planning, with downstream effects on lead times for feed mills. Larger manufacturers hedge through multi-region procurement, but smaller facilities lack balance-sheet capacity for forward buying, propagating sporadic product outages that erode customer trust.
Regulatory Uncertainty Around GMO-Derived Enzyme Strains
Differing state-level GMO labeling rules create patchwork compliance challenges that slow commercial rollouts. Some jurisdictions mandate explicit disclosure on feed tags, while others follow federal exemptions for processing aids. The inconsistency inflates legal review and package redesign costs, prompting manufacturers to weigh non-GMO production strains that may sacrifice yield. FDA guidance in 2024 clarified federal pathways yet left room for state variation, keeping risk premiums elevated in pro-labeling markets. The uncertainty discourages smaller innovators from entering the feed enzymes market until harmonization materializes.
*Our forecasts treat driver/restraint impacts as directional, not additive. The impact forecasts reflect baseline growth, mix effects, and variable interactions.
Segment Analysis
By Sub Additive: Carbohydrases Lead Multi-Enzyme Innovation
In 2025, carbohydrases generated 46.45% of the North America feed enzymes market revenue owing to proven improvements in digestible energy release from corn, wheat, and barley. Phytase-enriched carbohydrase blends now capture incremental value by freeing up stored phosphorus, reinforcing segment dominance. The North America feed enzymes market size for carbohydrases is projected to expand with a CAGR of 5.72% in line with regulatory pressure on phosphorus emissions and volatility in inorganic phosphate prices. Multi-enzyme cocktails that combine xylanase, amylase, and beta-glucanase simplify dosing for mills and reduce inventory complexity. Heat-stable encapsulation removes prior pelleting constraints, opening new volume in poultry growers and swine finishers that prefer high-conditioning temperatures.
Second-generation products like RONOZYME MultiGrain incorporate matrix values into formulation software, making net energy credits transparent for nutritionists and procurement teams. Enzyme suppliers increasingly offer assay services that quantify grain viscosity to fine-tune inclusion, elevating technical service as a competitive lever. With phytase acceleration and steady xylanase uptake, carbohydrases remain the lodestar for enzyme innovation over the forecast horizon.


By Animal: Poultry Dominance Faces Ruminant Growth Challenge
Poultry commanded 40.68% of the North America feed enzymes market share in 2025, reflecting the sector’s stringent feed conversion benchmarks and short grow-out cycles that magnify enzyme ROI. Broiler integrators embrace carbohydrase-protease packages that improve breast meat yield while maintaining liveability under antibiotic-free programs. Layer producers adopt phytase-rich blends to offset rising calcium-phosphorus costs, especially under California’s cage-free mandates. The North America feed enzymes market size for poultry continues to benefit from high pellet usage, which now leverages heat-stable encapsulation to maintain enzyme activity.
Ruminants register the fastest 6.21% CAGR through 2031 as dairy operators seek to maximize milk solids per kilogram of dry-matter intake. Starch-specific enzymes such as RumiStar offered in the region enhance rumen fermentation efficiency, reducing undigested grains in manure and improving feed efficiency indices. Beef feedlots explore enzyme use in high-moisture corn rations to accelerate weight gain, while small-grain dairies in Canada adopt fiber-degrading packages to capitalize on home-grown forages. Though starting from a lower base, ruminants’ growth trajectory challenges poultry supremacy over the forecast window.
Geography Analysis
The United States dominated the North America feed enzymes market with a 69.85% share in 2025, and leads expansion with a 6.08% CAGR to 2031, buoyed by the world’s most technologically advanced livestock systems and aggressive state-level phosphorus regulations. Accelerated adoption aligns with precision formulation platforms that model enzyme matrix values in real time, driving continuous optimization in broiler complexes across Georgia, Arkansas, and North Carolina. Legislative momentum, such as the Innovative FEED Act, reintroduced in March 2025, promises streamlined approval pathways that could entice additional entrants.
Canada reinforces regional expansion after modernized Feeds Regulations came into force in July 2024, delivering predictable approval timelines that lower go-to-market costs for suppliers. Dairy herds in Ontario and Quebec adopt carbohydrase-phytase packages to boost milk component efficiency, while Western Canadian broiler integrators leverage heat-stable enzymes to offset high winter energy costs linked to pelleting. Government-sponsored phosphorus credit programs in Manitoba further incentivize phytase inclusion.
Mexico’s feed industry modernizes through joint ventures with United States integrators, transferring enzyme dosing expertise to rapidly growing poultry and swine sectors. SENASICA clarifies additive registration guidelines, and rising corn prices make energy-releasing enzymes financially compelling. The rest of North America sees early trial programs in Central American broiler operations, indicating a downstream opportunity for enzyme suppliers once logistics and cold-chain infrastructure mature.
Competitive Landscape
The top five suppliers controlled a significant share of regional revenue in 2024, defining a moderately consolidated environment in which product differentiation and service depth outweigh pure scale. DSM-Firmenich AG led, followed closely by Archer Daniels Midland Company. Novonesis altered the hierarchy in February 2025 by acquiring DSM-Firmenich’s 50% stake in the Feed Enzymes Alliance for EUR 1.5 billion (USD 1.64 billion), integrating two decades of joint development under a single roof[3].Source: dsm-firmenich, “dsm-firmenich to Sell Stake in Feed Enzymes Alliance to Novonesis for €1.5 Billion,” dsm-firmenich, our-company.dsm-firmenich.com The move strengthens Novonesis’s fermentation efficiency and pipeline visibility, positioning the company to leverage DSM-Firmenich distribution agreements for rapid commercialization.
Suppliers deepen technical partnerships with precision-nutrition software firms to embed proprietary dose-response algorithms, locking in customer dependence on their data ecosystems. Competition remains fierce on service, with major players offering on-site assay labs and warranty programs that guarantee nutrient matrix claims.
Smaller innovators exploit white-space niches such as aquaculture-specific enzymes and swine gut-health combinations, although regulatory hurdles and capital intensity limit rapid scaling. Raw-material price volatility and GMO regulatory uncertainty add complexity, favoring incumbents with diversified manufacturing footprints and robust compliance teams.
North America Feed Enzymes Industry Leaders
Brenntag SE
Elanco Animal Health Inc.
IFF(Danisco Animal Nutrition)
DSM-Firmenich AG
Archer Daniels Midland Company
- *Disclaimer: Major Players sorted in no particular order

Recent Industry Developments
- April 2025: Novonesis announced a capital expansion at its Salem, Virginia, facility to enhance its North American manufacturing and supply capabilities for enzymes and biosolutions. This expansion aims to serve the United States feed formulators and integrators more effectively.
- February 2025: Novonesis acquired DSM-Firmenich's global feed enzyme sales and distribution operations. This acquisition enables Novonesis to control the complete value chain, from research and development through sales and distribution, including DSM-Firmenich's North American customer base.
- January 2025: AB Vista presented research findings on broiler gut health and phytase supplementation in animal diets at the International Production & Processing Expo (IPPE) in Atlanta, USA. The presentations highlighted research developments and formulation updates for phytase and multi-functional enzyme solutions in the U.S. poultry and swine industries.
- August 2024: DSM-Firmenich obtained approval from the Canadian Food Inspection Agency (CFIA) for its novel enzyme, Mycofix FUMzyme, which helps swine and poultry producers manage mycotoxins in animal feed. The enzyme product is now available for use in swine and poultry diets across Canada.


North America Feed Enzymes Market Report Scope
Carbohydrases, Phytases are covered as segments by Sub Additive. Aquaculture, Poultry, Ruminants, Swine are covered as segments by Animal. Canada, Mexico, United States are covered as segments by Country.
Sub Additive
| Carbohydrases |
| Phytases |
| Other Enzymes |
Animal
| Aquaculture | By Sub Animal | Fish |
| Shrimp | ||
| fish | ||
| Other Aquaculture Species | ||
| Poultry | By Sub Animal | Broiler |
| Layer | ||
| Other Poultry Birds | ||
| Ruminants | By Sub Animal | Beef Cattle |
| Dairy Cattle | ||
| Other Ruminants | ||
| Swine | ||
| Other Animals |
Geography
| Canada |
| Mexico |
| United States |
| Rest of North America |
| Sub Additive | Carbohydrases | ||
| Phytases | |||
| Other Enzymes | |||
| Animal | Aquaculture | By Sub Animal | Fish |
| Shrimp | |||
| fish | |||
| Other Aquaculture Species | |||
| Poultry | By Sub Animal | Broiler | |
| Layer | |||
| Other Poultry Birds | |||
| Ruminants | By Sub Animal | Beef Cattle | |
| Dairy Cattle | |||
| Other Ruminants | |||
| Swine | |||
| Other Animals | |||
| Geography | Canada | ||
| Mexico | |||
| United States | |||
| Rest of North America | |||


Market Definition
- FUNCTIONS - For the study, feed additives are considered to be commercially manufactured products that are used to enhance characteristics such as weight gain, feed conversion ratio, and feed intake when fed in appropriate proportions.
- RESELLERS - Companies engaged in reselling feed additives without value addition have been excluded from the market scope, to avoid double counting.
- END CONSUMERS - Compound feed manufacturers are considered to be end-consumers in the market studied. The scope excludes farmers buying feed additives to be used directly as supplements or premixes.
- INTERNAL COMPANY CONSUMPTION - Companies engaged in the production of compound feed as well as the manufacturing of feed additives are part of the study. However, while estimating the market sizes, the internal consumption of feed additives by such companies has been excluded.
| Keyword | Definition |
|---|---|
| Feed additives | Feed additives are products used in animal nutrition for purposes of improving the quality of feed and the quality of food from animal origin, or to improve the animals’ performance and health. |
| Probiotics | Probiotics are microorganisms introduced into the body for their beneficial qualities. (It maintains or restores beneficial bacteria to the gut). |
| Antibiotics | Antibiotic is a drug that is specifically used to inhibit the growth of bacteria. |
| Prebiotics | A non-digestible food ingredient that promotes the growth of beneficial microorganisms in the intestines. |
| Antioxidants | Antioxidants are compounds that inhibit oxidation, a chemical reaction that produces free radicals. |
| Phytogenics | Phytogenics are a group of natural and non-antibiotic growth promoters derived from herbs, spices, essential oils, and oleoresins. |
| Vitamins | Vitamins are organic compounds, which are required for normal growth and maintenance of the body. |
| Metabolism | A chemical process that occurs within a living organism in order to maintain life. |
| Amino acids | Amino acids are the building blocks of proteins and play an important role in metabolic pathways. |
| Enzymes | Enzyme is a substance that acts as a catalyst to bring about a specific biochemical reaction. |
| Anti-microbial resistance | The ability of a microorganism to resist the effects of an antimicrobial agent. |
| Anti-microbial | Destroying or inhibiting the growth of microorganisms. |
| Osmotic balance | It is a process of maintaining salt and water balance across membranes within the body's fluids. |
| Bacteriocin | Bacteriocins are the toxins produced by bacteria to inhibit the growth of similar or closely related bacterial strains. |
| Biohydrogenation | It is a process that occurs in the rumen of an animal in which bacteria convert unsaturated fatty acids (USFA) to saturated fatty acids (SFA). |
| Oxidative rancidity | It is a reaction of fatty acids with oxygen, which generally causes unpleasant odors in animals. To prevent these, antioxidants were added. |
| Mycotoxicosis | Any condition or disease caused by fungal toxins, mainly due to contamination of animal feed with mycotoxins. |
| Mycotoxins | Mycotoxins are toxin compounds that are naturally produced by certain types of molds (fungi). |
| Feed Probiotics | Microbial feed supplements positively affect gastrointestinal microbial balance. |
| Probiotic yeast | Feed yeast (single-cell fungi) and other fungi used as probiotics. |
| Feed enzymes | They are used to supplement digestive enzymes in an animal’s stomach to break down food. Enzymes also ensure that meat and egg production is improved. |
| Mycotoxin detoxifiers | They are used to prevent fungal growth and to stop any harmful mold from being absorbed in the gut and blood. |
| Feed antibiotics | They are used both for the prevention and treatment of diseases but also for rapid growth and development. |
| Feed antioxidants | They are used to protect the deterioration of other feed nutrients in the feed such as fats, vitamins, pigments, and flavoring agents, thus providing nutrient security to the animals. |
| Feed phytogenics | Phytogenics are natural substances, added to livestock feed to promote growth, aid in digestion, and act as anti-microbial agents. |
| Feed vitamins | They are used to maintain the normal physiological function and normal growth and development of animals. |
| Feed flavors and sweetners | These flavors and sweeteners help to mask tastes and odors during changes in additives or medications and make them ideal for animal diets undergoing transition. |
| Feed acidifiers | Animal feed acidifiers are organic acids incorporated into the feed for nutritional or preservative purposes. Acidifiers enhance congestion and microbiological balance in the alimentary and digestive tracts of livestock. |
| Feed minerals | Feed minerals play an important role in the regular dietary requirements of animal feed. |
| Feed binders | Feed binders are the binding agents used in the manufacture of safe animal feed products. It enhances the taste of food and prolongs the storage period of the feed. |
| Key Terms | Abbreviation |
| LSDV | Lumpy Skin Disease Virus |
| ASF | African Swine Fever |
| GPA | Growth Promoter Antibiotics |
| NSP | Non-Starch Polysaccharides |
| PUFA | Polyunsaturated Fatty Acid |
| Afs | Aflatoxins |
| AGP | Antibiotic Growth Promoters |
| FAO | The Food And Agriculture Organization of the United Nations |
| USDA | The United States Department of Agriculture |


Research Methodology
Mordor Intelligence follows a four-step methodology in all our reports.
- Step-1: IDENTIFY KEY VARIABLES: In order to build a robust forecasting methodology, the variables and factors identified in Step-1 are tested against available historical market numbers. Through an iterative process, the variables required for market forecast are set and the model is built on the basis of these variables.
- Step-2: Build a Market Model: Market-size estimations for the forecast years are in nominal terms. Inflation is not a part of the pricing, and the average selling price (ASP) is kept constant throughout the forecast period.
- Step-3: Validate and Finalize: In this important step, all market numbers, variables and analyst calls are validated through an extensive network of primary research experts from the market studied. The respondents are selected across levels and functions to generate a holistic picture of the market studied.
- Step-4: Research Outputs: Syndicated Reports, Custom Consulting Assignments, Databases & Subscription Platforms


