India Feed Enzymes Market Size and Share
Market Overview
| Study Period | 2018 - 2031 |
|---|---|
| Forecast Data Period | 2026 - 2031 |
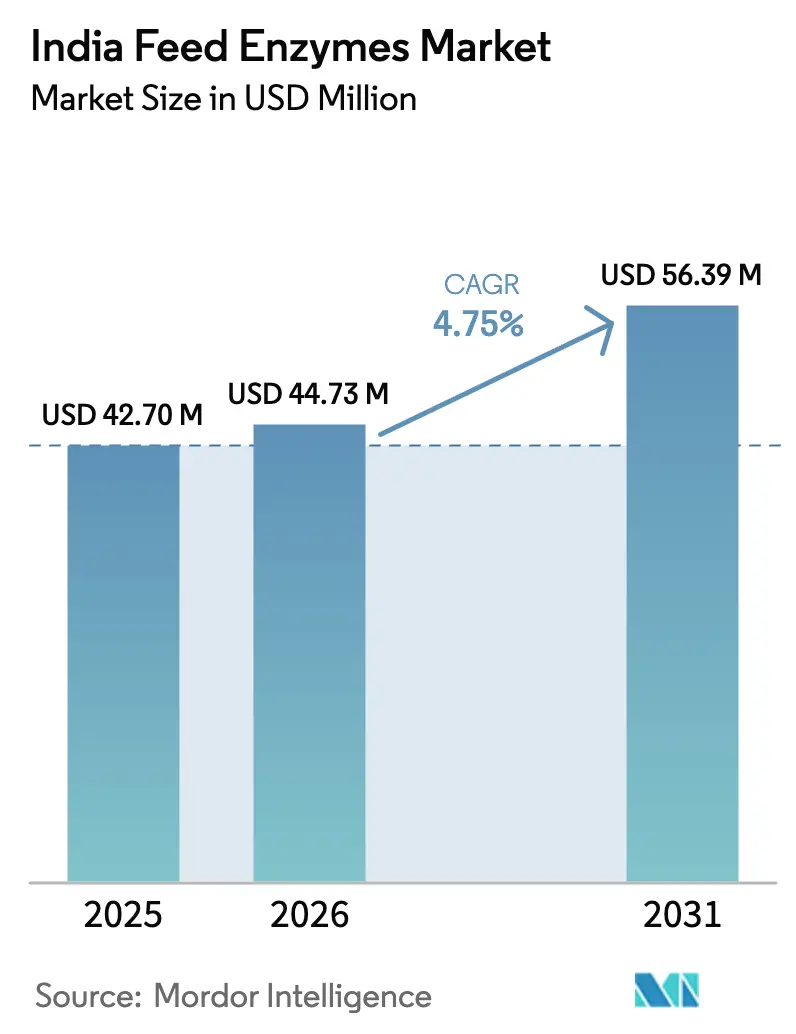
| Base Year Market Size (2025) | USD 42.70 Million |
| Market Size (2026) | USD 44.73 Million |
| Market Size (2031) | USD 56.39 Million |
| Growth Rate (2026 - 2031) | 4.75% CAGR |
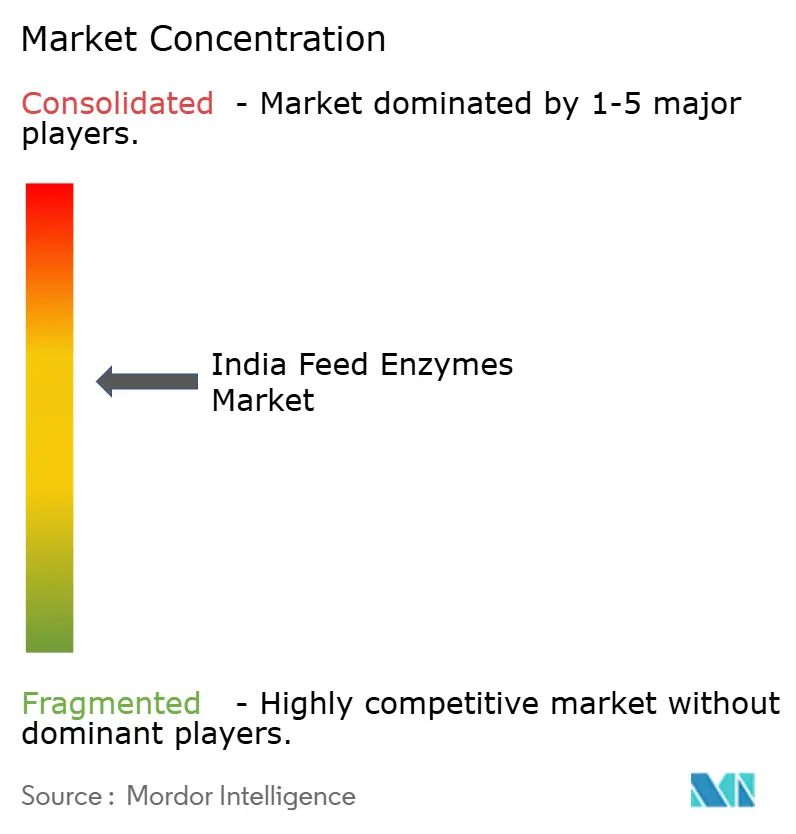
| Market Concentration | Medium |
Major Players *Disclaimer: Major Players sorted in no particular order Image © Mordor Intelligence. Reuse requires attribution under CC BY 4.0. | |
India Feed Enzymes Market Analysis by Mordor Intelligence
The India feed enzymes market size was valued at USD 42.70 million in 2025 and estimated to grow from USD 44.73 million in 2026 to reach USD 56.39 million by 2031, at a CAGR of 4.75% during the forecast period (2026-2031). Growth is propelled by the national phase-out of antibiotic growth promoters, the BioE3 bio-manufacturing policy, and a sustained rise in commercial poultry output. Intensifying demand for nutrient efficiency under volatile grain prices, rapid feed-mill modernization in southern states, and rising export-oriented aquaculture further accelerate adoption. Liquid formulations gain favor because they minimize dosing error in mash feeds, while thermostable variants defend enzymatic activity against India’s heat-humidity supply chains. Competitive dynamics are reshaping after Novonesis acquired DSM-Firmenich’s alliance stake.
Key Report Takeaways
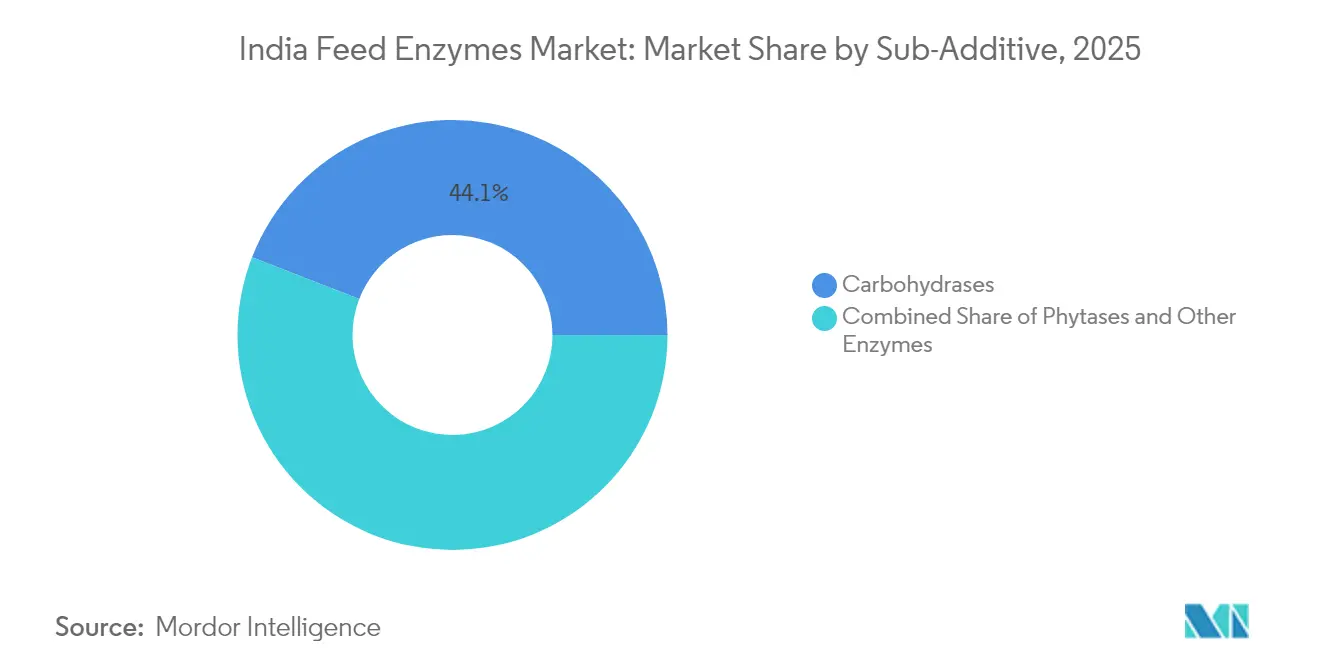
- By sub-additive, Carbohydrases led with 44.12% of the India feed enzymes market share in 2025, and Carbohydrases are forecast to expand at a 5.24% CAGR through 2031.
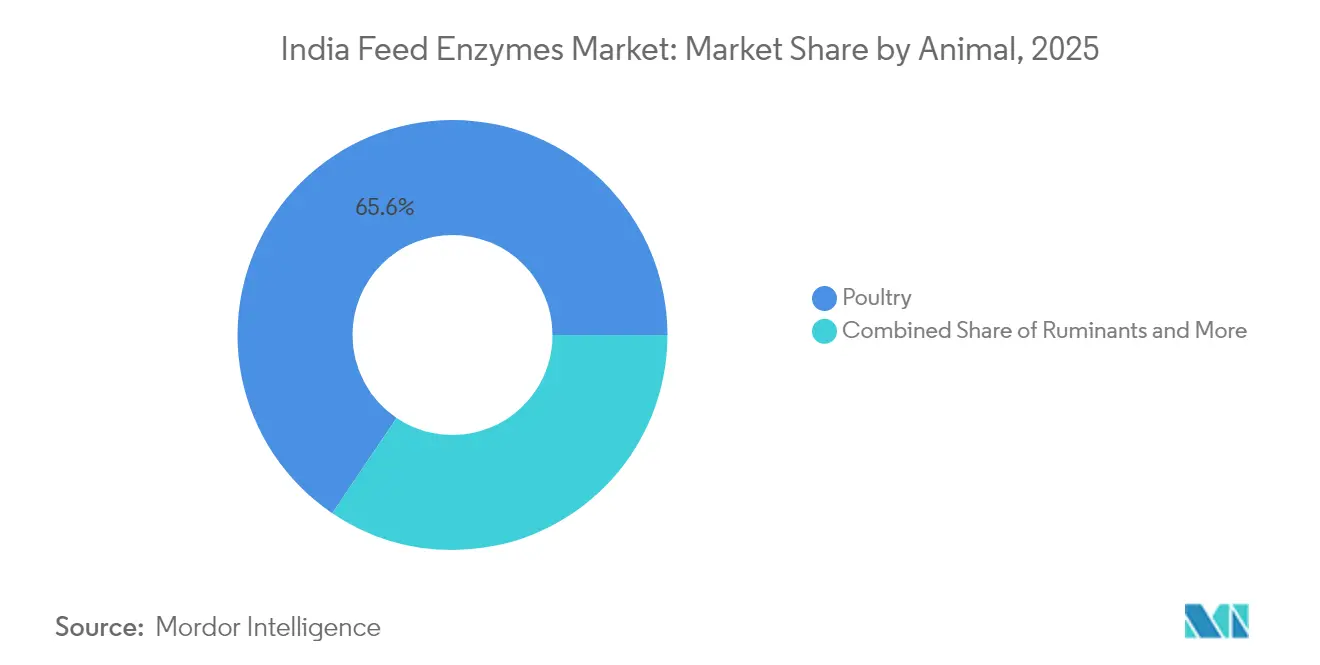
- By animal, poultry held 65.55% revenue share in 2025, and poultry is advancing at a 4.82% CAGR to 2031.
Note: Market size and forecast figures in this report are generated using Mordor Intelligence’s proprietary estimation framework, updated with the latest available data and insights as of 2026.
India Feed Enzymes Market Trends and Insights
Drivers Impact Analysis*
| Driver | (~) % Impact on CAGR Forecast | Geographic Relevance | Impact Timeline |
|---|---|---|---|
| Surging commercial poultry output and organized feed mill capacity additions | +2.8% | Andhra Pradesh, Tamil Nadu, Telangana | Medium term (2-4 years) |
| Phase-out of antibiotic growth promoters (AGPs) accelerating enzyme adoption | +2.1% | National, early compliance in organized sectors | Short term (≤ 2 years) |
| Feed-grain cost inflation pushing mills toward higher nutrient release solutions | +1.7% | National, acute in grain-deficient states | Short term (≤ 2 years) |
| Mandatory BIS (Bureau of Indian Standards) quality marks for compound feed, creating compliance pull-through | +1.4% | National, phased implementation | Medium term (2-4 years) |
| Shift to liquid enzymes for small-scale mash feed reduces dosing error and waste | +1.2% | Maharashtra, Punjab, Haryana | Medium term (2-4 years) |
| Expansion of domestic fermentation capacity under PLI (Production Linked Incentive) bio-manufacturing scheme | +1.0% | Gujarat, Karnataka, Andhra Pradesh | Long term (≥ 4 years) |
| Source: Mordor Intelligence | |||


Surging Commercial Poultry Output and Organized Feed-Mill Capacity Additions
Rapid annual growth in broiler and layer production elevates demand for enzyme-ready rations. Integrated producers prioritize feed conversion efficiency, deploying multi-enzyme blends that mitigate anti-nutritional factors in corn-soybean diets. Southern feed-mill clusters leverage scale to justify inclusion rates once deemed uneconomical for smaller operators. Consistency objectives favor standardized enzyme packages with verified thermostability. Suppliers deepen extension services to align dosing strategies with new pelleting capacities, reinforcing brand loyalty [1]Source: Food and Agriculture Organization, “Grain Market Review 2025,” FAO.ORG. Layer operations demonstrate growing acceptance of phytase supplementation as phosphorus availability becomes critical for shell quality and production longevity. The organized feed mill capacity additions, concentrated in Southern states, create economies of scale that justify enzyme inclusion rates previously considered uneconomical for smaller operations.
Phase-Out Of Antibiotic Growth Promoters Accelerating Enzyme Adoption
National bans on colistin, chloramphenicol, and nitrofurans compel mills to adopt alternatives that sustain animal performance without antimicrobial action. Enzyme supplementation stands out because it unlocks intrinsic nutrient value rather than masking inefficiencies. Proteases gain ground for their dual role in protein digestibility and gut integrity maintenance in post-antibiotic systems. Regulatory urgency speeds trials and adoption, rewarding vendors with robust field data and in-house application teams. Organized integrators report measurable parity between enzyme programs and former antibiotic regimes within two production cycles. Feed mills report that enzyme-based alternatives require more sophisticated technical support and application knowledge, favoring suppliers with established field service capabilities over commodity ingredient vendors.
Feed-Grain Cost Inflation Pushing Mills Toward Higher Nutrient-Release Solutions
The corn price surge during 2023-24 reprioritizes nutrient extraction. Phytase usage rises as mills seek phosphorus bioavailability, trimming costly dicalcium phosphate. Multi-enzyme cocktails that target fiber, protein, and starch barriers deliver cumulative feed-cost savings that outweigh additive expenses. Grain-deficient Eastern states show the sharpest uptake, as freight surcharges magnify cost pressure. Software-enabled least-cost formulations now routinely flag enzyme insertion as the economic optimum. Regional feed mills in grain-deficit areas demonstrate higher enzyme adoption rates as transportation costs amplify the economic benefits of improved feed conversion ratios.
Mandatory BIS (Bureau of Indian Standards) Quality Marks for Compound Feed, Creating Compliance Pull-Through
The 2024 mandate ties certification to verifiable nutrient claims, making consistent enzyme inclusion a compliance tool. Documentation-ready suppliers gain an edge because their dossiers align with BIS audit templates. Smaller mills lacking in-house laboratories gravitate toward turnkey enzyme packs bundled with dosing guides and certificate support. Downstream buyers increasingly specify BIS-certified feed, transferring compliance demands across the supply chain. This structural shift embeds enzymes into standard formulations rather than optional performance enhancers. The regulatory influence extends beyond direct compliance requirements as downstream customers increasingly specify BIS-certified (Bureau of Indian Standards) feeds, creating market access advantages for enzyme-supplemented products.
Restraints Impact Analysis*
| Restraint | (~) % Impact on CAGR Forecast | Geographic Relevance | Impact Timeline |
|---|---|---|---|
| High price sensitivity among smallholder livestock producers | -1.8% | UP, Bihar, West Bengal | Long term (≥ 4 years) |
| Tropic heat-humidity degrading enzyme activity across the supply chain | -1.2% | Coastal and high-humidity belts | Medium term (2-4 years) |
| Fragmented distribution limiting on-farm technical support for enzyme usage | -0.9% | Northern and eastern rural zones | Medium term (2-4 years) |
| Limited in-vivo validation on fiber-rich local by-products (rice bran, DDGS) | -0.6% | Rice-bran and DDGS (Distiller's Dried Grains with Solubles) intensive areas | Long term (≥ 4 years) |
| Source: Mordor Intelligence | |||
High Price Sensitivity Among Smallholder Livestock Producers
Nine out of ten poultry farms are smallholder units operating on thin margins, making upfront additive costs a major hurdle. Producers often resort to least-cost formulations focused on visible ingredient savings rather than latent efficiency gains. Limited access to credit and fluctuating live-bird prices reinforce short-term decision-making. Enzyme sellers must counter skepticism with demo trials and micro-pack sizes suited to batches under one metric ton. Cooperative procurement models are emerging to aggregate demand and negotiate volume discounts. Rural producers often lack access to the technical support necessary to optimize enzyme applications, reducing their confidence in achieving promised performance benefits that justify premium pricing. The constraint creates market segmentation where enzyme adoption concentrates in organized commercial operations while smallholder segments remain underserved despite representing the majority of production units.
Tropic Heat-Humidity Degrading Enzyme Activity Across the Supply Chain
Ambient temperatures exceeding 40°C and relative humidity above 80% can slash unprotected enzyme activity by up to 65%. Rural transport lacks cold-chain infrastructure, amplifying degradation risk during the last mile. Seasonal volatility drives inconsistent field performance, undermining farmer confidence. Vendors respond with coated granules and desiccant-lined liquid drums. Real-time activity assays at mill receipt points are gaining adoption, tying payment to post-transport potency [2]Source: Indian Council of Agricultural Research, “Thermostability of Feed Enzymes under Tropical Conditions,” ICAR.ORG.IN. Liquid enzyme formulations demonstrate superior stability under tropical conditions but require specialized handling equipment that many smaller operations lack.
*Our forecasts treat driver/restraint impacts as directional, not additive. The impact forecasts reflect baseline growth, mix effects, and variable interactions.
Segment Analysis
By Sub-Additive: Carbohydrases momentum reshapes category balance
Carbohydrases dominate the Indian feed enzymes market, holding approximately 44.12% market share in 2025. This segment's prominence is primarily attributed to the higher consumption and requirement for carbohydrates by all animal types for proper digestion. The segment is also experiencing the fastest growth trajectory, projected to grow at 5.24% CAGR through 2031, driven by its crucial role in improving feed efficiency and reducing costs.
Carbohydrases are particularly vital in the poultry sector, where they help break down non-starch polysaccharides (NSPs) in cereal grains, enhancing nutrient absorption and digestibility. The segment's strong performance is further supported by its ability to improve the digestibility of nutrients by enhancing gut performance across various animal species, including poultry, ruminants, and aquaculture. The increasing awareness among farmers about the benefits of carbohydrases in animal feed and their role in improving feed conversion ratios has also contributed to their market dominance.


By Animal: Poultry dominance the market
The poultry segment holds a 65.55% market share in 2025 and is projected to grow at a CAGR of 4.82% through 2031. This dominance stems from the poultry industry's widespread adoption of feed additives and well-developed infrastructure for enzyme integration. Broiler segments drive the majority of enzyme consumption through intensive production systems that prioritize feed conversion efficiency and growth rate optimization. Layer operations contribute substantially through phytase applications targeting shell quality and phosphorus utilization efficiency.
Poultry integrators, despite maturity, continue upselling toward dual-enzyme packages combining phytase and carbohydrase, defending their dominant consumption share while new species expand the market. The regulatory influence of aquaculture export requirements creates additional demand for enzyme-supplemented feeds that meet international quality standards for processed seafood products.
Geography Analysis
India's feed enzyme market demonstrates concentrated growth patterns aligned with commercial livestock production clusters and organized feed manufacturing infrastructure. Southern states, particularly Andhra Pradesh, Tamil Nadu, and Telangana, lead market development through intensive poultry integration operations that prioritize feed conversion efficiency over traditional cost-minimization approaches. These regions benefit from established technical support networks and proximity to major enzyme suppliers' distribution centers, facilitating the adoption of advanced feed additive technologies. The concentration of organized feed mills in these areas creates economies of scale that justify enzyme inclusion rates previously considered uneconomical for smaller operations.
Northern and western regions, including Punjab, Haryana, and Maharashtra, represent emerging growth opportunities driven by expanding dairy operations and increasing commercial poultry development. These areas demonstrate growing receptivity to enzyme applications as feed grain costs intensify and regulatory pressure mounts to eliminate antibiotic growth promoters. The regions benefit from proximity to grain production areas, creating logistics advantages for feed manufacturers willing to invest in enzyme-enhanced formulations. The prevalence of smallholder operations in these regions creates adoption challenges related to price sensitivity and limited technical support infrastructure.
Eastern states, particularly West Bengal and Bihar, remain underserved markets despite significant livestock populations due to fragmented production systems and limited organized feed manufacturing capacity. The regions demonstrate potential for enzyme adoption as commercial livestock operations expand and feed quality standards improve. Government initiatives promoting livestock sector modernization create opportunities for enzyme suppliers willing to invest in technical support infrastructure and farmer education programs. The BioE3 policy framework's emphasis on bio-manufacturing development accelerates enzyme production capacity in these regions, reducing supply chain costs and improving market access for local producers.
Competitive Landscape
The India feed enzymes market exhibits moderate concentration, with top players including Adisseo, Novonesis A/S (DSM-Firmenich), Archer Daniels Midland Co., Brenntag SE, and Kerry Group Plc. Maintaining dominant positions through technical expertise, regulatory compliance capabilities, and comprehensive product portfolios. Market leadership strategies emphasize multi-enzyme solutions that address diverse nutritional challenges in single formulations, reducing complexity for feed manufacturers while maximizing additive value per inclusion rate.
Technology deployment focuses on thermostable enzyme variants specifically engineered for tropical processing conditions and liquid formulation systems that improve dosing precision in small-scale operations. Emerging competitive dynamics reflect the February 2025 acquisition of DSM-Firmenich's Feed Enzyme Alliance by Novonesis for EUR 1.5 billion (USD 1.62 billion), creating new market consolidation pressures and opportunities for domestic players to capture market share through localized production and specialized technical support[3]Source: Pet Food Processing, “Novonesis Acquires DSM-Firmenich Feed Enzyme Alliance,” PETFOODPROCESSING.NET . Domestic manufacturers like Advanced Enzyme Technologies and Rossari Biotech leverage cost-competitive fermentation capacity and agricultural residue substrate availability to challenge international suppliers in price-sensitive market segments.
Opportunities exist in specialized applications for aquaculture feeds, organic livestock production, and enzyme cocktails optimized for locally sourced feed ingredients like rice bran and distillers dried grains. The PLI bio-manufacturing scheme creates strategic advantages for companies investing in domestic enzyme production capacity, potentially reshaping competitive dynamics through import substitution and localized technical support capabilities.
India Feed Enzymes Industry Leaders
Adisseo
Brenntag SE
Kerry Group Plc
Novonesis A/S (DSM-Firmenich)
Archer Daniels Midland Co.
- *Disclaimer: Major Players sorted in no particular order

Recent Industry Developments
- June 2025: Novonesis completed the acquisition of DSM-Firmenich's Feed Enzyme Alliance share for EUR 1.5 billion (USD 1.62 billion), creating the world's largest dedicated feed enzyme business. The transaction consolidates enzyme production capabilities and expands Novonesis's market presence in high-growth regions, including India, where integrated enzyme-probiotic solutions target post-antibiotic feed formulations.
- August 2024: India's Ministry of Science and Technology approved the BioE3 Policy (Biotechnology for Economy, Environment and Employment), explicitly targeting bio-based chemicals and enzymes as priority sectors for domestic manufacturing development. The policy framework establishes bio-manufacturing hubs and provides regulatory support for biotechnology scale-up initiatives relevant to feed enzyme production.
- January 2022: Hiphorius is a new generation of phytase introduced by the DSM-Novozymes alliance. It is a comprehensive phytase solution created to assist poultry producers in achieving lucrative and sustainable protein output.


India Feed Enzymes Market Report Scope
Carbohydrases, Phytases are covered as segments by Sub Additive. Aquaculture, Poultry, Ruminants, Swine are covered as segments by Animal.| Carbohydrases |
| Phytases |
| Other Enzymes |
| Aquaculture | By Sub Animal | Fish |
| Shrimp | ||
| Other Aquaculture Species | ||
| Poultry | By Sub Animal | Broiler |
| Layer | ||
| Other Poultry Birds | ||
| Ruminants | By Sub Animal | Beef Cattle |
| Dairy Cattle | ||
| Other Ruminants | ||
| Swine | ||
| Other Animals |
| Sub Additive | Carbohydrases | ||
| Phytases | |||
| Other Enzymes | |||
| By Animal | Aquaculture | By Sub Animal | Fish |
| Shrimp | |||
| Other Aquaculture Species | |||
| Poultry | By Sub Animal | Broiler | |
| Layer | |||
| Other Poultry Birds | |||
| Ruminants | By Sub Animal | Beef Cattle | |
| Dairy Cattle | |||
| Other Ruminants | |||
| Swine | |||
| Other Animals | |||


Market Definition
- FUNCTIONS - For the study, feed additives are considered to be commercially manufactured products that are used to enhance characteristics such as weight gain, feed conversion ratio, and feed intake when fed in appropriate proportions.
- RESELLERS - Companies engaged in reselling feed additives without value addition have been excluded from the market scope, to avoid double counting.
- END CONSUMERS - Compound feed manufacturers are considered to be end-consumers in the market studied. The scope excludes farmers buying feed additives to be used directly as supplements or premixes.
- INTERNAL COMPANY CONSUMPTION - Companies engaged in the production of compound feed as well as the manufacturing of feed additives are part of the study. However, while estimating the market sizes, the internal consumption of feed additives by such companies has been excluded.
| Keyword | Definition |
|---|---|
| Feed additives | Feed additives are products used in animal nutrition for purposes of improving the quality of feed and the quality of food from animal origin, or to improve the animals’ performance and health. |
| Probiotics | Probiotics are microorganisms introduced into the body for their beneficial qualities. (It maintains or restores beneficial bacteria to the gut). |
| Antibiotics | Antibiotic is a drug that is specifically used to inhibit the growth of bacteria. |
| Prebiotics | A non-digestible food ingredient that promotes the growth of beneficial microorganisms in the intestines. |
| Antioxidants | Antioxidants are compounds that inhibit oxidation, a chemical reaction that produces free radicals. |
| Phytogenics | Phytogenics are a group of natural and non-antibiotic growth promoters derived from herbs, spices, essential oils, and oleoresins. |
| Vitamins | Vitamins are organic compounds, which are required for normal growth and maintenance of the body. |
| Metabolism | A chemical process that occurs within a living organism in order to maintain life. |
| Amino acids | Amino acids are the building blocks of proteins and play an important role in metabolic pathways. |
| Enzymes | Enzyme is a substance that acts as a catalyst to bring about a specific biochemical reaction. |
| Anti-microbial resistance | The ability of a microorganism to resist the effects of an antimicrobial agent. |
| Anti-microbial | Destroying or inhibiting the growth of microorganisms. |
| Osmotic balance | It is a process of maintaining salt and water balance across membranes within the body's fluids. |
| Bacteriocin | Bacteriocins are the toxins produced by bacteria to inhibit the growth of similar or closely related bacterial strains. |
| Biohydrogenation | It is a process that occurs in the rumen of an animal in which bacteria convert unsaturated fatty acids (USFA) to saturated fatty acids (SFA). |
| Oxidative rancidity | It is a reaction of fatty acids with oxygen, which generally causes unpleasant odors in animals. To prevent these, antioxidants were added. |
| Mycotoxicosis | Any condition or disease caused by fungal toxins, mainly due to contamination of animal feed with mycotoxins. |
| Mycotoxins | Mycotoxins are toxin compounds that are naturally produced by certain types of molds (fungi). |
| Feed Probiotics | Microbial feed supplements positively affect gastrointestinal microbial balance. |
| Probiotic yeast | Feed yeast (single-cell fungi) and other fungi used as probiotics. |
| Feed enzymes | They are used to supplement digestive enzymes in an animal’s stomach to break down food. Enzymes also ensure that meat and egg production is improved. |
| Mycotoxin detoxifiers | They are used to prevent fungal growth and to stop any harmful mold from being absorbed in the gut and blood. |
| Feed antibiotics | They are used both for the prevention and treatment of diseases but also for rapid growth and development. |
| Feed antioxidants | They are used to protect the deterioration of other feed nutrients in the feed such as fats, vitamins, pigments, and flavoring agents, thus providing nutrient security to the animals. |
| Feed phytogenics | Phytogenics are natural substances, added to livestock feed to promote growth, aid in digestion, and act as anti-microbial agents. |
| Feed vitamins | They are used to maintain the normal physiological function and normal growth and development of animals. |
| Feed flavors and sweetners | These flavors and sweeteners help to mask tastes and odors during changes in additives or medications and make them ideal for animal diets undergoing transition. |
| Feed acidifiers | Animal feed acidifiers are organic acids incorporated into the feed for nutritional or preservative purposes. Acidifiers enhance congestion and microbiological balance in the alimentary and digestive tracts of livestock. |
| Feed minerals | Feed minerals play an important role in the regular dietary requirements of animal feed. |
| Feed binders | Feed binders are the binding agents used in the manufacture of safe animal feed products. It enhances the taste of food and prolongs the storage period of the feed. |
| Key Terms | Abbreviation |
| LSDV | Lumpy Skin Disease Virus |
| ASF | African Swine Fever |
| GPA | Growth Promoter Antibiotics |
| NSP | Non-Starch Polysaccharides |
| PUFA | Polyunsaturated Fatty Acid |
| Afs | Aflatoxins |
| AGP | Antibiotic Growth Promoters |
| FAO | The Food And Agriculture Organization of the United Nations |
| USDA | The United States Department of Agriculture |


Research Methodology
Mordor Intelligence follows a four-step methodology in all our reports.
- Step-1: IDENTIFY KEY VARIABLES: In order to build a robust forecasting methodology, the variables and factors identified in Step-1 are tested against available historical market numbers. Through an iterative process, the variables required for market forecast are set and the model is built on the basis of these variables.
- Step-2: Build a Market Model: Market-size estimations for the forecast years are in nominal terms. Inflation is not a part of the pricing, and the average selling price (ASP) is kept constant throughout the forecast period.
- Step-3: Validate and Finalize: In this important step, all market numbers, variables and analyst calls are validated through an extensive network of primary research experts from the market studied. The respondents are selected across levels and functions to generate a holistic picture of the market studied.
- Step-4: Research Outputs: Syndicated Reports, Custom Consulting Assignments, Databases & Subscription Platforms


