Automated Parcel Delivery Terminals Market Size and Share
Market Overview
| Study Period | 2018 - 2031 |
|---|---|
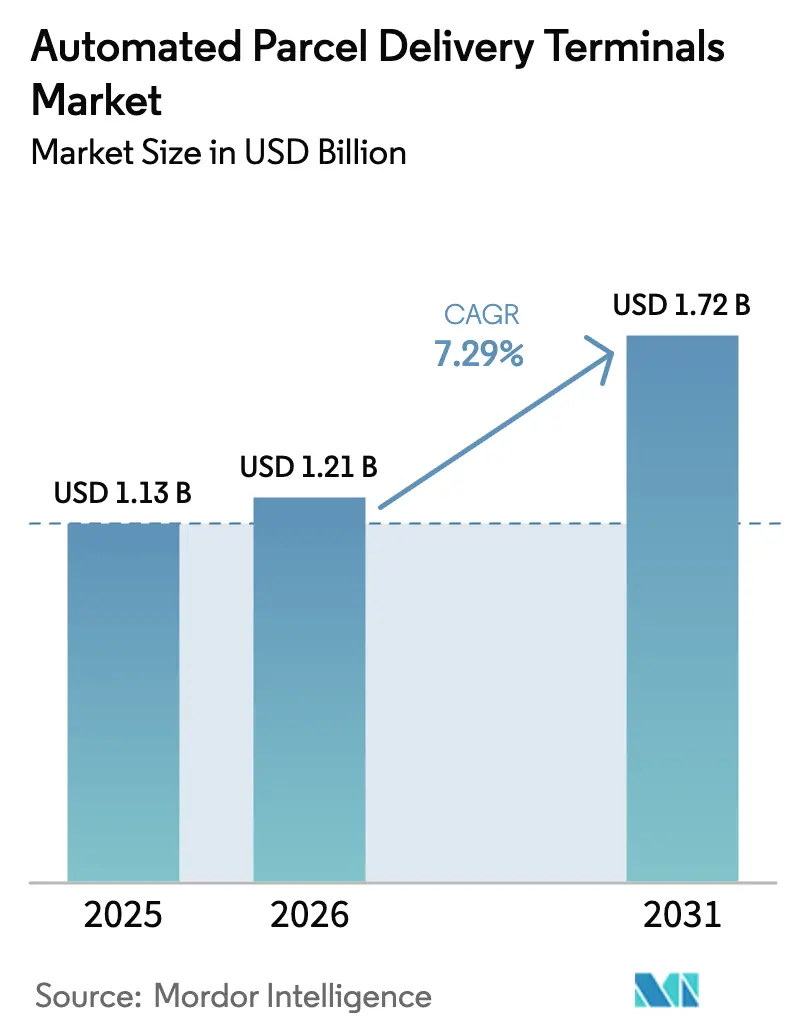
| Market Size (2026) | USD 1.21 Billion |
| Market Size (2031) | USD 1.72 Billion |
| Growth Rate (2026 - 2031) | 7.29% CAGR |
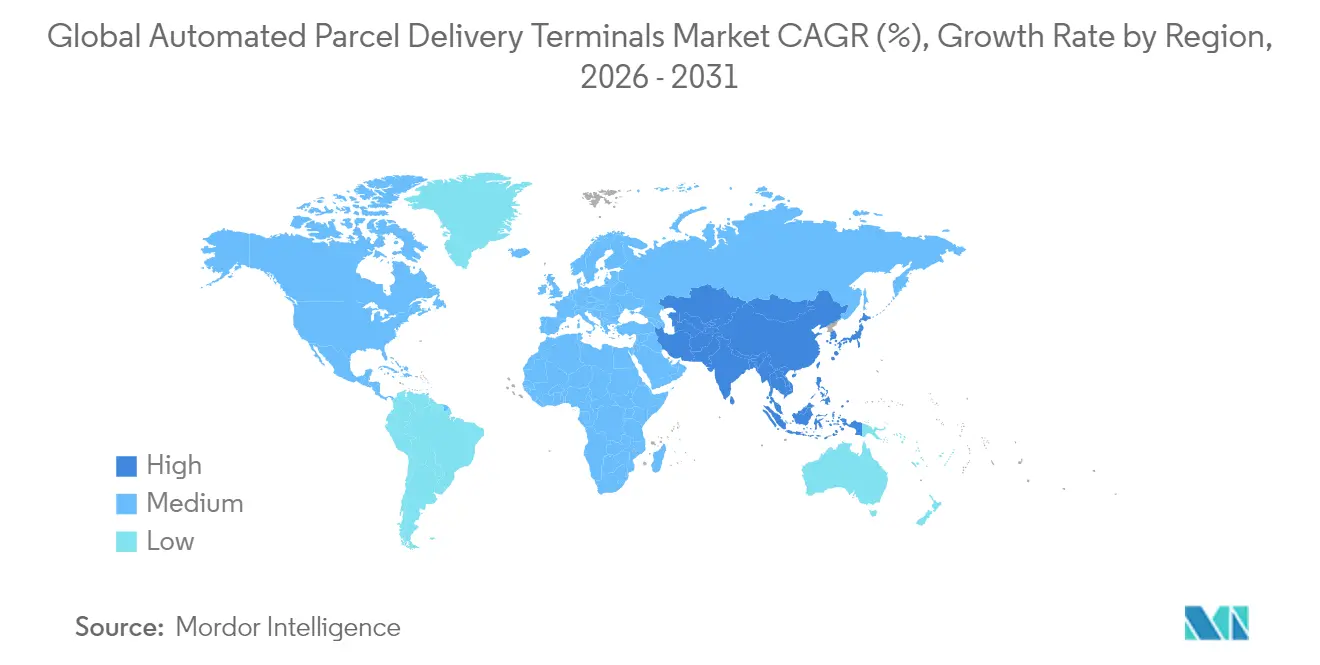
| Fastest Growing Market | Asia Pacific |
| Largest Market | Europe |
| Market Concentration | Medium |
Major Players *Disclaimer: Major Players sorted in no particular order Image © Mordor Intelligence. Reuse requires attribution under CC BY 4.0. | |
Automated Parcel Delivery Terminals Market Analysis by Mordor Intelligence
automated parcel delivery terminals market size in 2026 is estimated at USD 1.21 billion, growing from 2025 value of USD 1.13 billion with 2031 projections showing USD 1.72 billion, growing at 7.29% CAGR over 2026-2031. Rising urban density, e-commerce scale, and postal operators’ shift to carrier-agnostic infrastructure underpin the expansion, while AI-enabled routing reduces costly failed first-attempt deliveries, strengthening the business case[1]International Transport Forum, “The Cost of Failed First-Attempt Deliveries,” itf-oecd.org . Regulatory pressure for carbon-neutral last-mile services, hardware innovations that allow off-grid outdoor units, and retail investments in click-and-collect banks further accelerate network roll-outs. At the same time, security threats and fragmented U.S. permitting rules temper growth, prompting operators to prioritize indoor deployment and advanced surveillance. Competitive intensity is heightening as logistics firms, e-commerce giants, and hardware specialists all race to control customer touchpoints and delivery data.
Key Report Takeaways
- By deployment, indoor installations commanded 64.28% share of the automated parcel delivery terminals market size in 2025; outdoor banks are growing at 8.41% CAGR between 2026-2031.
- By business model, the business-to-consumer (B2C) segment held 87.55% of the automated parcel delivery terminals market share in 2025; consumer-to-consumer (C2C) transactions are poised for an 8.70% CAGR between 2026-2031.
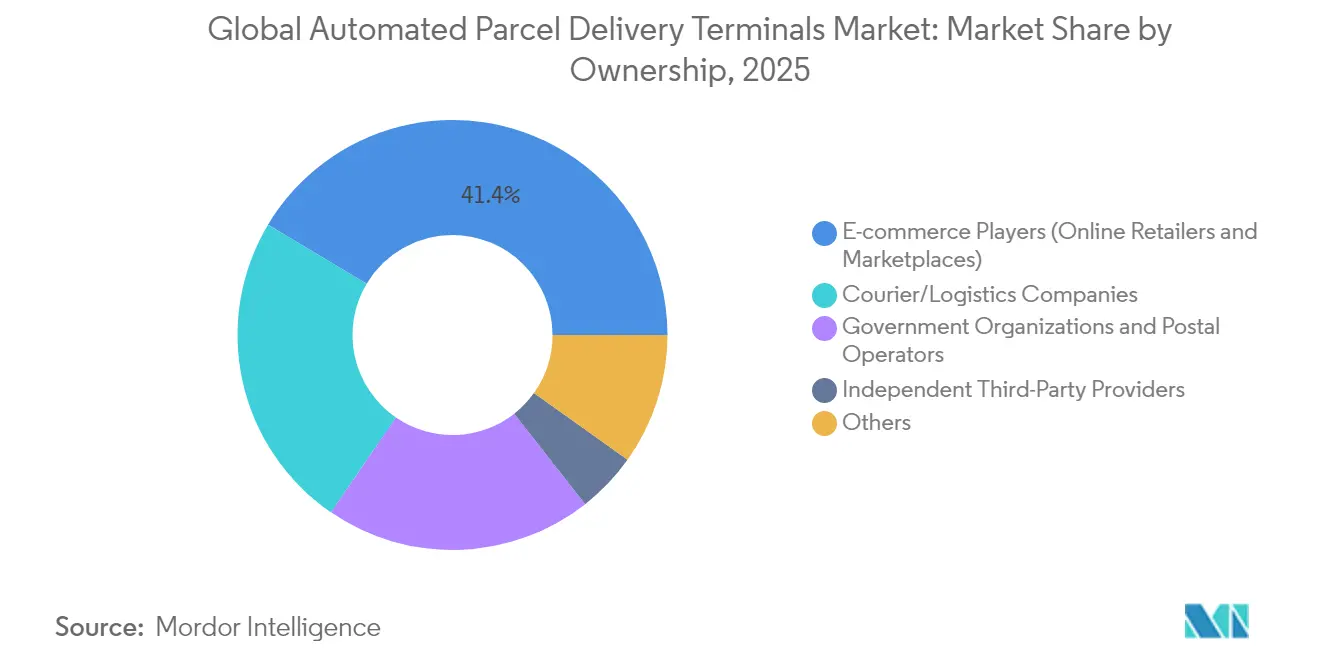
- By ownership, e-commerce platforms controlled 41.42% of installed units in 2025, while courier/ logistics companies-owned lockers represent the fastest-growing ownership group at 8.19% CAGR between 2026-2031.
- By configuration, modular parcel lockers captured 50.35% revenue share in 2025; cooling (fresh-food) lockers are advancing at a 8.94% CAGR between 2026-2031.
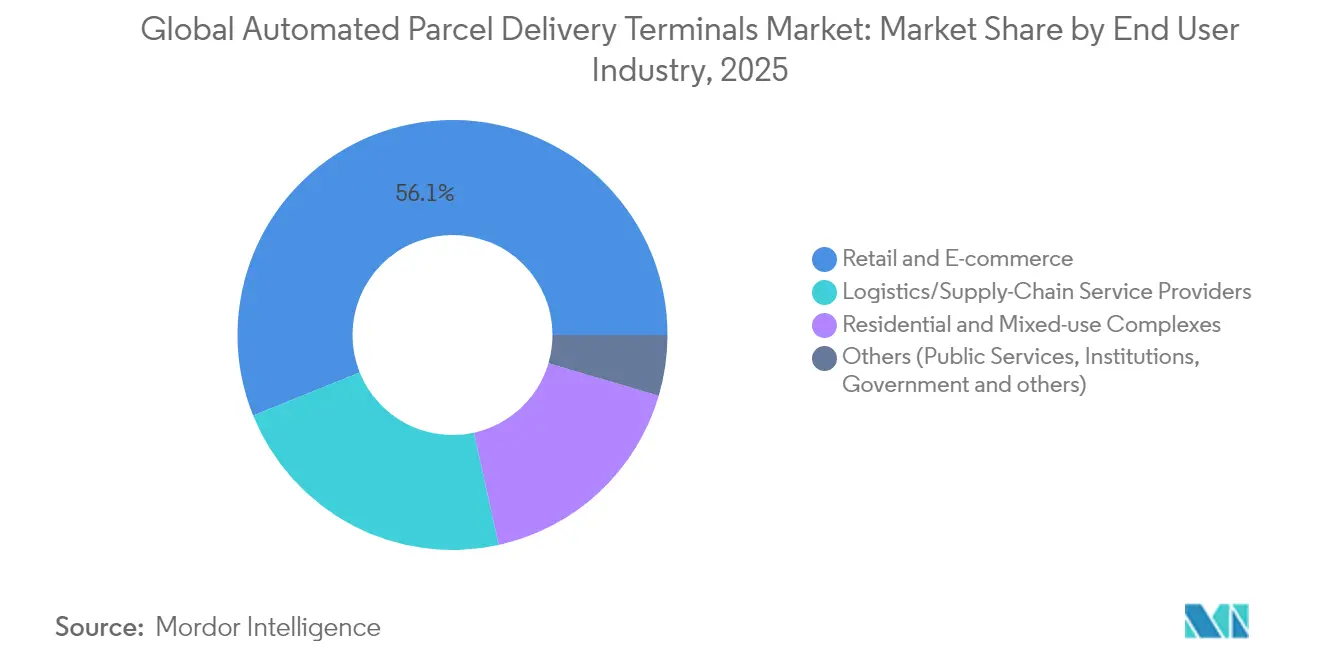
- By end user industry, the retail and e-commerce segment accounted for 56.10% share in 2025, whereas residential and mixed-use complexes are rising at an 8.79% CAGR between 2026-2031.
- By speed of delivery, non-express deliveries led with 68.75% of the automated parcel delivery terminals market share in 2025, while express parcels are projected to grow at an 8.29% CAGR between 2026-2031.
- By geography, Europe led with 33.07% of the automated parcel delivery terminals market share in 2025, while Asia-Pacific is forecast to expand at an 7.98% CAGR between 2026-2031.
Note: Market size and forecast figures in this report are generated using Mordor Intelligence’s proprietary estimation framework, updated with the latest available data and insights as of 2026.
Global Automated Parcel Delivery Terminals Market Trends and Insights
Drivers Impact Analysis*
| Driver | (~) % Impact on CAGR Forecast | Geographic Relevance | Impact Timeline |
|---|---|---|---|
| Rapid urban e-commerce fulfilment needs in densely populated Asian cities | +1.8% | Asia-Pacific core, MEA spill-over | Medium term (2-4 years) |
| Consolidation of carrier-agnostic locker networks by European postal operators | +1.2% | Europe, early North America | Long term (≥ 4 years) |
| Retailer investments in store-front click-and-collect banks across North America | +0.9% | North America, selective EU | Short term (≤ 2 years) |
| Carbon-neutral last-mile mandates accelerating locker roll-outs in the Nordics | +0.7% | Nordic region, broader EU | Medium term (2-4 years) |
| AI-enabled dynamic locker routing reducing failed first-attempt deliveries | +1.1% | Global, tech-advanced markets | Short term (≤ 2 years) |
| Temperature-controlled grocery locker pilots driving fresh-food use cases | +0.6% | Global urban grocery hubs | Medium term (2-4 years) |
| Source: Mordor Intelligence | |||
Rapid Urban E-commerce Fulfilment Needs
China processed more than 130 billion parcels in 2024, and megacities such as Shanghai see densities topping 50 parcels /km² daily, a scale that makes door-to-door models unsustainable[2]China.org.cn, “China Express Delivery Statistics 2024,” china.org.cn. Smart lockers in residential towers cut last-mile costs by up to 40%, while SingPost’s USD 22.72 million capacity upgrade quadruples parcel throughput and signals how operators are scaling to meet volume spikes. High utilization rates improve payback periods, reinforcing the automated parcel delivery terminals market as core urban infrastructure rather than a convenience feature.
Consolidation of Carrier-Agnostic Locker Networks
Deutsche Post DHL plans to double German Pack stations to 30,000 by 2030, investing EUR 500 million (USD 551.82 million) to harvest multi-carrier flows and lower per-parcel costs. Royal Mail, bpost, and Poste Italiane are following suit through joint ventures and retailer partnerships that densify networks without proportionate capex outlays. Consolidation erects entry barriers and positions incumbents as platform orchestrators, shifting competitive dynamics in the automated parcel delivery terminals market.
AI-Enabled Dynamic Locker Routing
Amazon’s locker-capacity algorithm cut unjustified rejections by 60%, proving how machine learning elevates compartment utilization and customer experience[3]INFORMS Journal on Applied Analytics, “Locker Capacity Optimization at Amazon,” pubsonline.informs.org. Autonomous delivery pilots in China integrate V2X communication with real-time traffic data to synchronize routes and locker availability, trimming failed first-attempt deliveries that otherwise inflate costs by 40-50%[4]MDPI Sustainability, “AI-Driven Urban Logistics Frameworks,” mdpi.com. AI, therefore, unlocks margin gains that accelerate global adoption.
Temperature-Controlled Grocery Lockers
Albertsons, Kroger, and European grocers deploy multi-temperature lockers that store ambient, chilled, and frozen items, enabling same-day pickup without staff intervention. Cleveron’s 501 unit holds 120 totes and shortens in-store handling time by up to 70%, highlighting how specialty hardware opens new revenue streams for operators and grocers alike. Rising online grocery demand is set to double by 2027, creating fertile ground for this niche within the automated parcel delivery terminals market.
Restraints Impact Analysis*
| Restraint | (~) % Impact on CAGR Forecast | Geographic Relevance | Impact Timeline |
|---|---|---|---|
| Ongoing vandalism and security breach incidents in public-access locker sites | -1.4% | Global urban centers | Short term (≤ 2 years) |
| Fragmented regulatory approvals for curb-side installations in US cities | -1.1% | United States | Short term (≤ 2 years) |
| Limited grid-power access for rural and suburban outdoor banks | -0.8% | Rural North America, developing Asia-Pacific | Medium term (2-4 years) |
| High retrofit costs to integrate legacy postal infrastructure | -0.9% | Global mature postal markets | Medium term (2-4 years) |
| Source: Mordor Intelligence | |||
Ongoing Vandalism and Security Breaches
Package theft in the UK totals GBP 376 million (USD 478.65 million) annually, and USPS recorded over 1,200 mail theft arrests in 2024, forcing operators to invest in hardened enclosures and video analytics that add 15-20% to operating costs. Elevated risk weighs on deployment economics, particularly for outdoor banks situated in high-crime districts.
Fragmented Regulatory Approvals in U.S. Cities
New York City’s LockerNYC program requires four-to six-month consent processes and long-term fee agreements, delaying scale-up and skewing the automated parcel delivery terminals market toward operators with established municipal ties. A patchwork of state rules governing delivery robots and sidewalk use further complicates nationwide roll-outs.
*Our forecasts treat driver/restraint impacts as directional, not additive. The impact forecasts reflect baseline growth, mix effects, and variable interactions.
Segment Analysis
By End-User Industry: Retail First, Residential Next
Retail and e-commerce sectors commanded a 56.10% share in 2025, leveraging lockers to cut in-store handling and attract omnichannel shopper footfall. Residential and mixed-use complexes deliver the fastest growth at 8.79% CAGR (2026-2031), with developers installing lobby banks that eliminate concierge burden and differentiate property amenities. Case studies show 52% CO₂ savings and 60-hour monthly labor reductions per building after smart-box adoption Citibox.
For logistics providers, residential deployments unlock consolidated drop-off routes that shrink stop counts. The automated parcel delivery terminals market, therefore, straddles commercial and living spaces, embedding itself in daily routines and urban design codes.


By Deployment: Indoor Installations, Anchor Network Economics
Indoor sites accounted for 64.28% of 2025 revenue, a dominance underpinned by lower vandalism exposure and climate control that extends hardware life. This share equals USD 0.78 billion of the automated parcel delivery terminals market size in 2026, with retail foyers and mixed-use lobbies offering constant footfall and minimal permitting friction. Insurance premiums fall as much as 30% compared with outdoor banks, reinforcing indoor preference. On the flip side, the outdoor sites' growth of 8.41% CAGR (2026-2031) reflects battery- and solar-powered designs that bypass grid constraints. CTT’s solar lockers in Lisbon and Cleveron’s battery modules allow operators to fill suburban and rural coverage gaps. As security technology matures, outdoor nodes will form the mesh that complements dense indoor clusters, expanding geographic reach without duplicating legacy branch networks.
Second-order effects include data monetization: indoor units provide anonymized shopper traffic insights that retailers leverage for in-aisle promotions. Outdoor units gather environmental telemetry valuable to municipal planners optimizing curbside use. Consequently, deployment decisions now balance direct parcel revenue with adjacent data-service potential, broadening the return profile for investors in the automated parcel delivery terminals market.
By Speed of Delivery: Non-Express Parcels Dominate but Express Usage Climbs
Standard/ non-express parcels represented 68.75% of 2025 revenue, reflecting consumers’ willingness to exchange speed for flexible pickup windows. Express parcels grew 8.29% CAGR (2026-2031) and now tap lockers to guarantee time-definite retrieval without surcharge for failed delivery. AI-backed slot reservation tools allocate compartments dynamically between service levels, improving occupancy and revenue per cubic foot. Carriers trial predictive rerouting that diverts overflow express parcels to nearby banks in real time, minimizing throttle during peak seasons. These innovations keep capacity elastic, protecting service quality as e-commerce order cycles shorten.
Rising express share also changes site economics: higher-value goods justify premium locker fees, accelerating payback in central business districts where real estate costs are steep. The automated parcel delivery terminals market can therefore capture incremental margin by tiering compartment pricing based on dwell time and service urgency.
By Ownership: Platform Control Versus Shared Ecosystems
E-commerce (online retailers and marketplaces) owned 41.42% of installed lockers in 2025, motivated by brand stickiness and last-mile data capture. Courier/logistics companies owned estates, expanding at 8.19% CAGR (2026-2031), indicate rising carrier appetite to internalize locker costs rather than pay per-parcel access fees. Postal operators hold sizable footprints enabled by public-service mandates and municipal real-estate rights.
Independent specialists operate multi-carrier hubs that monetize access across all players, creating neutral infrastructure critical to parcel-dense city centers. Debates over open versus closed networks will shape investment allocation, but the automated parcel delivery terminals market increasingly rewards owners that blend scale with interoperability to maximize slot utilization.
By Model: B2C Still Reigns as C2C Momentum Builds
The business-to-consumer (B2C) channel held 87.55% share in 2025, fueled by omnichannel retailers and marketplaces that embed locker pickup at checkout. Consumer-to-consumer (C2C) activity, however, is the fastest climber at 8.70% CAGR (2026-2031), propelled by resale platforms and social-commerce communities that need neutral hand-off points. InPost’s Send service exemplifies how operators tailor user journeys with QR-code label generation and app-based locker booking.
Business-to-business (B2B) flows remain modest but strategic for spare-parts supply chains that require predictable, unattended pickup outside standard hours. As sellers diversify into re-commerce and repair services, mixed-flow sites will blur traditional segment lines yet keep B2C as the anchor tenant of the automated parcel delivery terminals market.
By Locker Configuration: Modular Builds Enable Rapid Scaling
Modular parcel lockers represented 50.35% of 2025 deployments, their flexible bays supporting incremental additions as parcel volumes climb. Configurable chassis shorten installation to less than four hours, limiting business-day disruption at host sites. Cooling (fresh-food lockers) designs, growing 8.94% CAGR (2026-2031), satisfy perishable-goods demand and uphold food-safety compliance. Advanced units integrate ozone sanitization for grocery applications, preserving shelf life during warmer months.
Specialty formats such as high-capacity mailroom towers and secure returns kiosks diversify revenue while leveraging the same cloud platform, cementing modular design as the foundation of the automated parcel delivery terminals market.
Geography Analysis
Europe accounts for 33.07% of global revenue in 2025, reaching USD 0.4 billion of the automated parcel delivery terminals market size in 2026. Dense postal networks, stringent emission targets, and widespread consumer familiarity drive high utilization. Investments such as Deutsche Post DHL’s Packstation expansion and the DHL-Poste Italiane joint venture mark a decisive push toward 100% carrier-agnostic coverage, reinforcing Europe’s structural lead.
Asia-Pacific is the growth pacesetter at an 7.98% CAGR between 2026-2031, supported by unparalleled parcel volumes and government backing for smart-city logistics. Cainiao’s infrastructure build-out in Southeast Asia and sustained locker infill in Tier 1 Chinese cities exemplify the region’s scale potential. Local hardware makers tailor ruggedized units for monsoon climates, and municipal authorities fast-track approvals to mitigate traffic congestion linked to doorstep deliveries. These factors create a virtuous cycle that solidifies the region’s long-term contribution to the automated parcel delivery terminals market.
North America maintains steady double-digit locker additions, though fragmented zoning rules prolong rollout timelines. Retailers spearhead uptake via click-and-collect hubs that merge parcel pick-up with curb-side grocery, while USPS pilots indicate federal momentum toward nationwide coverage. Emerging Latin American and Middle-East markets show nascent but accelerating adoption, often through public-private partnerships that leverage postal real estate to bridge infrastructural gaps.

Competitive Landscape
Competition remains moderately consolidated, with the top five operators controlling roughly 45% of installed bays worldwide. Postal incumbents exploit regulatory relationships to lock in prime curbside sites, while specialist operators pursue asset-light models that aggregate carrier demand. Hardware suppliers such as Cleveron and Quadient differentiate through rapid-install modular kits and temperature-controlled innovations, securing OEM alliances with retailers and grocers. E-commerce majors like Amazon integrate proprietary software stacks, achieving 60% fewer capacity rejections and using data insights to refine route orchestration.
Strategic moves in 2025 underscore consolidation and vertical integration. Deutsche Post DHL allocated EUR 500 million (USD 551.82 million) to network doubling, Cainiao opened cross-border facilities to cement presence in emerging trade lanes, and CTT unveiled solar-powered lockers that slash energy costs by up to 30%. Venture funding is flowing into AI-driven fleet-locker optimization startups, signaling that software capability is becoming the next competitive frontier within the automated parcel delivery terminals market.
Regulatory trends add another dimension: the EU’s incoming zero-emission zones favor operators able to validate carbon savings, whereas U.S. state-level robot-delivery statutes may soon encourage hybrid locker-bot ecosystems. Participants that harmonize hardware, software, and sustainability credentials will enjoy heightened bargaining power with retailers and carriers alike.
Automated Parcel Delivery Terminals Industry Leaders
Cainiao Network (Alibaba - Cainiao Smart Lockers)
InPost S.A. (InPost Parcel Lockers)
Amazon (Amazon Lockers)
Deutsche Post DHL Group (DHL Packstation)
SF Express (SF Lockers)
- *Disclaimer: Major Players sorted in no particular order

Recent Industry Developments
- May 2025: SingPost committed SGD 30 million (USD 22.72 million) to quadruple capacity at its Regional eCommerce Logistics Hub, lifting daily throughput to 400,000 parcels.
- May 2025: CTT Expresso’s Locky unit introduced the world’s first solar-powered parcel locker at a Lisbon Lidl store, advancing off-grid deployment capabilities.
- March 2025: Cainiao Network opened a Vietnamese facility and pledged long-term investment in Mexico to support Southeast Asian and Latin American e-commerce growth.
- February 2025: InPost rolled out “InPost Send” to boost UK Consumer-to-Consumer traffic following 20% Q4 2024 volume growth.


Research Methodology Framework and Report Scope
Market Definitions and Key Coverage
Mordor Intelligence defines the automated parcel delivery terminals market as the global sale, installation, and software support revenues of self-service lockers that let users drop off or collect parcels without staff assistance, operating 24/7 in indoor or outdoor public or private premises. These terminals combine secure compartments, barcode or RFID readers, cloud connectivity, and user interfaces that integrate with carrier tracking systems.
Scope exclusion: Our study intentionally leaves out manual staffed pickup points, conventional post boxes, and full-scale warehouse sortation equipment.
Segmentation Overview
- Deployment
- Indoor
- Outdoor
- Shipment Speed
- Express
- Non-Express
- Model
- Business-to-Business (B2B)
- Business-to-Consumer (B2C)
- Consumer-to-Consumer (C2C)
- Ownership
- E-commerce (Online Retailers and Marketplaces)
- Courier/Logistics Companies
- Government Organizations
- Postal Operators
- Independent Third-Party Providers
- Others
- Locker Configuration
- Modular Parcel Lockers
- Cooling (Fresh-Food Lockers)
- Postal (Mailroom Lockers )
- Laundry and Service-Based Lockers
- Others
- End-User Industry
- Retail and E-commerce
- Logistics/Supply-Chain Service Providers
- Residential and Mixed-Use Complexes
- Others (Public Services, Institutions, Government and Public Sector Among Others)
- Geography
- North America
- United States
- Canada
- Mexico
- Rest of North America
- South America
- Brazil
- Argentina
- Rest of South America
- Europe
- Germany
- United Kingdom
- France
- Spain
- Italy
- Netherlands
- Nordics
- Central and Eastern Europe (CEE)
- Rest of Europe
- Asia-Pacific
- China
- Japan
- India
- Australia
- ASEAN
- Rest of Asia-Pacific
- Middle East And Africa
- United Arab Emirates
- Saudi Arabia
- Rest of Middle East and Africa
- North America
Detailed Research Methodology and Data Validation
Primary Research
Our team interviewed postal operators, third-party locker network managers, shopping-mall facility heads, and software platform providers across North America, Europe, and Asia-Pacific. These dialogues validated utilization rates, average door counts, service fees, and replacement cycles, and they tested early assumptions drawn from desk work.
Desk Research
Analysts first map industry fundamentals using freely available tier-1 sources such as Universal Postal Union parcel traffic dashboards, Eurostat e-commerce share of retail sales, U.S. Census online retail data, World Bank Logistics Performance indicators, and municipal smart-city tender portals. Company 10-Ks, investor decks, listed carrier shipment reports, and patent filings on locker designs enrich technology cost curves. Select insights from paid repositories, including D&B Hoovers for operator financials and Dow Jones Factiva for strategic news, help us gauge vendor scale and expansion pace. The sources named illustrate our evidence pool; a wider set was checked to cross-verify figures and fill gaps.
Market-Sizing & Forecasting
We apply a top-down model that rebuilds demand from parcel volumes and first-attempt failure rates, then layers adoption rates by locker doors per 10,000 parcels. Sampled average selling prices multiplied by installed doors provide a bottom-up sense check, allowing us to adjust for regional service models. Key variables include domestic parcel volume growth, online retail penetration, urban population density, locker door utilization, and hardware cost decline. A multivariate regression anchors the forecast, while scenario analysis gauges upside from grocery cold-chain lockers. Data gaps in supplier roll-ups are bridged using regional shipment density proxies confirmed during interviews.
Data Validation & Update Cycle
Outputs pass two analyst reviews, variance checks against historical parcel traffic, and logical stress tests. We refresh every twelve months and reopen the model sooner if material events, such as policy shifts or large network rollouts, occur. A final pre-publication sweep ensures clients receive the latest view.
Why Mordor's Automated Parcel Delivery Terminals Baseline Earns Trust
Published estimates often diverge because firms choose different device mixes, price assumptions, and refresh timings.
Key gap drivers in this space include whether studies merge 'smart parcel lockers' with broader smart-locker categories, how aggressively growth from on-demand grocery delivery is priced in, currency conversion cut-offs, and the cadence at which network expansions are captured before or after fiscal year-end.
Benchmark comparison
| Market Size | Anonymized source | Primary gap driver |
|---|---|---|
| USD 1.13 B (2025) | Mordor Intelligence | - |
| USD 0.91 B (2024) | Global Consultancy A | Combines lockers and smaller countertop pickup boxes; excludes software service revenue |
| USD 1.06 B (2025) | Industry Publication B | Uses static ASP, no adjustment for falling hardware costs; indoor deployments only |
| USD 1.01 B (2024) | Market Research Group C | Labels segment as 'smart parcel lockers,' thereby adding laundry and postal variants |
In sum, by anchoring volumes to verified parcel flows, aligning scope precisely with automated terminals, and updating the model yearly, Mordor provides a balanced, transparent baseline that decision-makers can replicate and trust.


Key Questions Answered in the Report
How big is the automated parcel delivery terminals market in 2026?
The market is valued at USD 1.21 billion in 2026 and is forecast to reach USD 1.72 billion by 2031 at a 7.29% CAGR (2026-2031).
Which region is growing the fastest?
Asia-Pacific registers the highest growth, advancing at an 7.98% CAGR (2026-2031) on the back of soaring e-commerce volumes and supportive logistics investments.
Why are indoor lockers still preferred?
Indoor installations account for 64.28% of 2025 deployments because controlled environments reduce vandalism, cut insurance costs, and extend equipment life by 3-5 years.
What share do express parcels hold in locker traffic?
Express parcels remain a minority but are the fastest-growing category, expanding at 8.29% CAGR (2026-2031) as carriers leverage lockers to guarantee time-definite pickup without failed delivery risk.
Who owns most locker networks today?
E-commerce platforms lead with 41.42% ownership in 2025, but courier-controlled estates are the fastest-rising group, growing at 8.19% CAGR (2026-2031) as carriers pursue direct infrastructure control.
What technologies are shaping future growth?
AI-driven capacity management, battery- and solar-powered outdoor units, and temperature-controlled compartments for perishable goods are the key innovations enhancing locker economics and user adoption.
Page last updated on:


