
Market Overview
| Study Period | 2021 - 2031 |
|---|---|
| Forecast Data Period | 2026 - 2031 |
| Base Year Market Size (2025) | USD 16.20 Billion |
| Market Size (2026) | USD 17.15 Billion |
| Market Size (2031) | USD 22.78 Billion |
| Growth Rate (2026 - 2031) | 5.85 % |
| Market Concentration | High |
Major Players *Disclaimer: Major Players sorted in no particular order Image © Mordor Intelligence. Reuse requires attribution under CC BY 4.0. | |
North America Breakfast Cereals Market Analysis by Mordor Intelligence
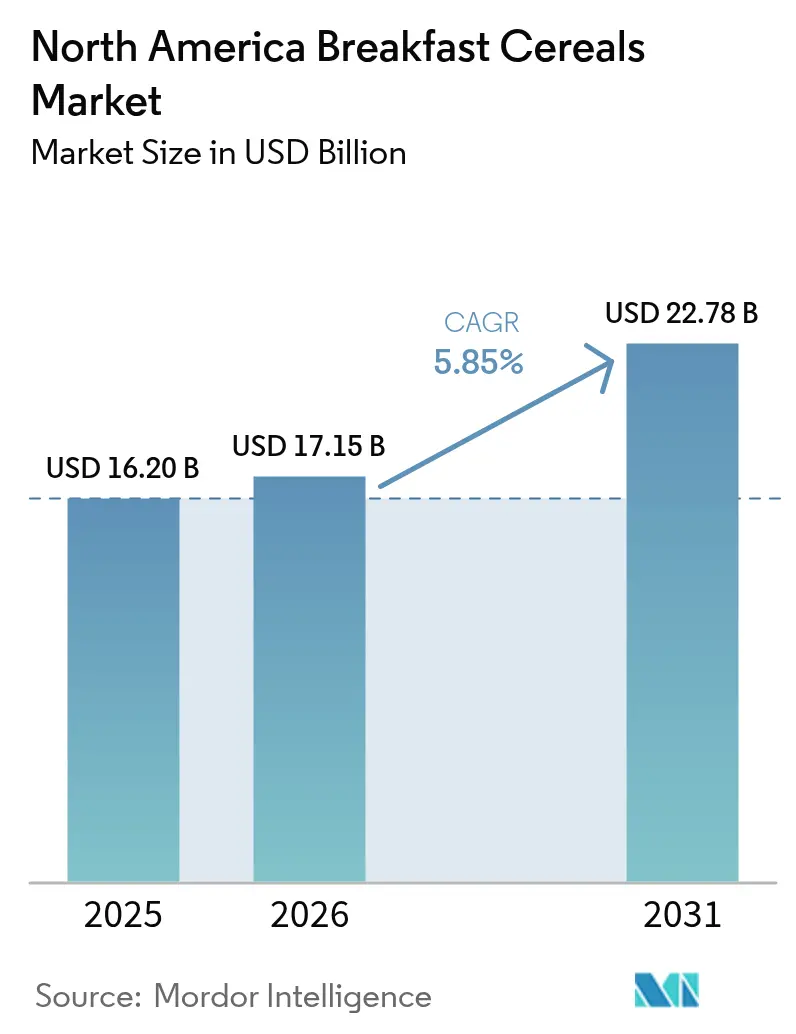
The North America breakfast cereal market size was valued at USD 16.20 billion in 2025 and estimated to grow from USD 17.15 billion in 2026 to reach USD 22.78 billion by 2031, at a CAGR of 5.85% during the forecast period (2026-2031). Following a period of slower growth, the market is now driven by steady premiumization, regulatory initiatives promoting healthier formulations, and advancements in supply chain modernization. Growing health awareness is boosting demand for cereals high in fiber, protein, and added nutrients. The increasing popularity of gluten-free, organic, and functional cereals is also contributing to market expansion. Protein-fortified SKUs, priced 15-25% higher than mainstream options, are expanding their reach among households. Furthermore, the FDA's revised definition of the “healthy” claim in February 2025 has spurred a wave of low-sugar and whole-grain product reformulations. While ready-to-eat cereals remain dominant, ready-to-cook options like oatmeal and muesli are gaining traction among consumers seeking customizable and minimally processed choices. The growth of online grocery shopping is eroding the shelf-space advantage traditionally held by supermarkets, enabling digital-first brands to capture market share without the need for physical store listings. Consumer demand for clean-label products, such as non-GMO, organic, and free-from artificial additives, has prompted companies to reformulate their offerings.
Key Report Takeaways
- By product type, ready-to-eat cereals held a 70.92% share of the North America breakfast cereal market in 2025, while ready-to-cook lines are projected to grow at a 6.62% CAGR through 2031.
- By ingredient source, corn-based recipes led with 36.74% of the North America breakfast cereal market share in 2025; oat-based SKUs are poised for the fastest 7.82% CAGR to 2031.
- By product nature, conventional offerings accounted for 72.05% of the North America breakfast cereal market size in 2025, whereas organic variants are forecast to expand at 7.31% CAGR through 2031.
- By distribution channel, supermarkets and hypermarkets commanded 58.98% of 2025 sales, but online retailing is set to record an 8.57% CAGR through 2031.
- By country, the United States retained 49.12% market share in 2025, yet Mexico is expected to register the region’s quickest 7.29% CAGR to 2031.
Note: Market size and forecast figures in this report are generated using Mordor Intelligence’s proprietary estimation framework, updated with the latest available data and insights as of 2026.
Market Trends and Insights
Drivers Impact Analysis of North America Breakfast Cereals Market*
| Driver | ( ~ ) % Impact on CAGR Forecast | Geographic Relevance | Impact Timeline |
|---|---|---|---|
| Health-and-wellness reformulations | +1.2% | United States and Canada | Medium term (2-4 years) |
| Premiumization via protein-fortified SKUs | +0.9% | North America, emerging in Mexico | Short term (≤ 2 years) |
| Rising demand for ready-to-eat cereals | +1.5% | North America | Long term (≥ 4 years) |
| Increasing dual-income households | +0.8% | United States metro areas, Canadian cities | Long term (≥ 4 years) |
| Shift toward clean-label products | +1.1% | North America | Medium term (2-4 years) |
| Innovation in product ingredients | +0.6% | Research and development clusters in North America | Short term (≤ 2 years) |
| Source: Mordor Intelligence | |||
Health-and-wellness reformulations drive market premiumization
Manufacturers are realigning their product portfolios to comply with the FDA's updated "healthy" claim criteria. Effective February 25, 2025, these criteria exclude highly sweetened cereals from health positioning while allowing whole grain and low-sugar options to achieve premium pricing. This regulatory change is driving significant reformulation investments. For instance, Kellogg's has committed to removing petroleum-based artificial colorings by 2027, despite expected cost increases of 20-30% per unit. Additionally, the USDA's Child and Adult Care Food Program will require breakfast cereals to contain no more than 6 grams of added sugars per dry ounce starting October 2025[1]. These regulatory measures provide a competitive edge to manufacturers focusing on clean-label reformulations, while penalizing those adhering to traditional high-sugar formulations. Reformulations often involve reducing or eliminating artificial additives, preservatives, and sugars. Clear labeling of attributes such as organic, non-GMO, and allergen-free helps build consumer trust and attract discerning buyers. The result is cereals positioned as premium products, supported by claims of healthfulness, sustainability, and purity.
Protein fortification captures consumer wellness priorities
Protein fortification in breakfast cereals is increasingly aligning with consumer wellness priorities. This shift addresses the growing demand for foods that support active lifestyles, muscle health, and balanced nutrition. Consequently, manufacturers are developing protein-rich cereals tailored to health-conscious demographics, including athletes, busy professionals, and fitness enthusiasts. The protein fortification trend has gained significant traction, with 71% of U.S. consumers in 2024 actively seeking to increase their protein intake, according to the International Food Information Council[2]. In April 2024, General Mills responded to this demand by launching Wheaties Protein, featuring over 20 grams of protein per serving. This marked the brand's first line extension in over a decade. Additionally, the company introduced Cheerios Protein, offering 8 grams per serving. Priced at a premium of USD 5.39-5.69, these cereals cater to families seeking nutritious breakfast options, surpassing traditional variants. This protein-focused approach enables manufacturers to command 15-25% price premiums while addressing the nutritional needs of health-conscious consumers, particularly those on GLP-1 medications who require higher protein and fiber intake.
Ready-to-eat convenience aligns with accelerated lifestyles
Modern consumers, driven by increasingly fast-paced lifestyles, are showing a growing preference for ready-to-eat (RTE) convenience breakfast cereals. These products effectively address the need for speed, efficiency, and minimal effort in meal preparation. Designed to be consumed quickly without requiring any cooking, RTE cereals have become particularly popular among busy professionals, students, and dual-income households. The demand for convenience has fueled significant product innovations, including portable packaging formats and formulations that extend shelf life. Despite their premium pricing, these cereals are gaining traction among higher-income households that face greater time constraints. By offering time-saving, nutritious, and flexible breakfast solutions, RTE convenience cereals have secured a dominant position in the market. As lifestyles continue to accelerate, these cereals are expected to maintain robust growth, further solidifying their market leadership.
Dual-income household growth sustains convenience demand
The growing number of dual-income households is driving demand for quick breakfast solutions. In Japan, dual-income households increased from 12.78 million in 2023 to 13 million in 2024, according to the Ministry of Internal Affairs and Communications[3]. Families with all adults employed are opting for ready-to-eat foods from grocery stores while reducing visits to full-service restaurants, benefiting the packaged cereal market. Millennial households, a significant consumer segment, are showing a preference for convenience foods. Although they allocate less of their budget to grain products, their spending on fruits and vegetables is rising with higher incomes. This group favors fewer grocery trips but spends more per visit, creating opportunities for premium cereal brands that focus on convenience and nutrition. Additionally, dual-income lifestyles influence brand loyalty, as busy families increasingly prefer trusted brands that consistently deliver quality and convenience.
Restraints Impact Analysis of North America Breakfast Cereals Market*
| Restraint | ( ~ ) % Impact on CAGR Forecast | Geographic Relevance | Impact Timeline |
|---|---|---|---|
| Volatile specialty-grain input costs | -0.7% | North America | Short term (≤ 2 years) |
| Challenges in product reformulation | -0.4% | North America | Medium term (2-4 years) |
| Lack of standardization for specialty ingredients | -0.3% | North America | Long term (≥ 4 years) |
| Substitution by yogurt and breakfast sandwiches | -0.9% | Urban North America | Medium term (2-4 years) |
| Source: Mordor Intelligence | |||
Grain commodity volatility pressures manufacturing margins
Manufacturers in North America's breakfast cereals market grapple with the volatility of grain commodity prices. This unpredictability not only disrupts production planning but also tightens profit margins. Key grains like wheat, corn, oats, and barley are essential for cereal production. Yet, these commodities face fluctuations driven by global supply disruptions, trade policies, extreme weather, and geopolitical tensions. The U.S. has reinstated tariffs, imposing 25% levies on imports from Canada and Mexico, and a staggering 104% on select Chinese goods. This move jeopardizes the competitiveness of cereal exports, with projected losses reaching USD 5-7 billion by mid-2025. Furthermore, global grain yields are susceptible to weather pattern volatility, such as La Niña, adding another layer of uncertainty in ingredient procurement. To navigate price unpredictability, firms find themselves frequently adjusting inventory, sourcing strategies, and production schedules. This results in operational inefficiencies and challenges in supply chain management. The effects include smaller batch sizes, reduced product innovation, and a heightened risk of stockouts or overstocking.
Substitution threats from alternative breakfast formats
Consumer preferences are increasingly shifting towards protein-rich and portable breakfast options, intensifying competition for the cereal category from yogurt and breakfast sandwiches. The market's transition to all-day breakfast consumption has created opportunities for non-cereal alternatives. Companies are capitalizing on this trend by expanding into high-protein and nontraditional breakfast offerings. Rising awareness of the high sugar content and artificial ingredients in many cereals has driven consumers to opt for alternatives such as lower-sugar, nutrient-dense options like Greek yogurt, smoothies, and eggs. Additionally, plant-based shakes and overnight oats are heavily marketed for their nutritional benefits, including probiotic content and clean labels. This approach has drawn consumers away from traditional cereals, which are increasingly perceived as less trendy or healthy. Moreover, beverage-only morning occasions are on the rise, with health-focused drinks gaining traction as meal replacements. This shift continues to fragment the traditional breakfast cereals market.
*Our forecasts treat driver/restraint impacts as directional, not additive. The impact forecasts reflect baseline growth, mix effects, and variable interactions.
North America Breakfast Cereals Market Segment Analysis
By Product Type:
Ready-to-Cook Variants Accelerate GrowthReady-to-eat cereals maintained dominance with 70.92% market share in 2025. Catering to the demands of modern consumers, ready-to-eat (RTE) breakfast cereals are driving market growth. Within the RTE segment, granola and clusters are positioned as premium offerings, thanks to their artisanal branding and clean-label formulations. In contrast, traditional flakes are feeling the heat from innovations like General Mills' Wheaties Protein, which boasts over 20 grams of protein per serving. Meanwhile, ready-to-cook cereals are on a rapid ascent, projected to grow at a 6.62% CAGR through 2031, as consumers lean towards wholesome and customizable breakfast options. Categories like hot oatmeal and muesli are capitalizing on health-conscious branding and ingredient transparency, drawing in those looking for alternatives to processed RTE cereals.
Puffed cereals enjoy consistent demand, bolstered by nostalgic brand loyalty and marketing aimed at children. However, they face challenges from updated FDA standards on "healthy" claims, especially those with higher sugar content. Coated and sugar-frosted cereals are under the most pressure to reformulate, as manufacturers juggle taste preferences with health considerations. The growth of the ready-to-cook segment mirrors a broader consumer trend: a desire for control over ingredients and preparation. Muesli and porridge mixes, with their customization potential, stand out against the more rigid ready-to-eat formats.


By Ingredient Source:
Oat-Based Products Lead InnovationCorn-based cereals command 36.74% market share in 2025, leveraging cost advantages and established supply chains. Corn flakes and other corn-based cereals have been breakfast staples in North America for years, deeply ingrained in consumer habits and valued for their consistent taste and convenience. Oat-based products are experiencing the fastest growth, with an 7.82% CAGR projected through 2031. This growth in the oat segment is supported by FDA-approved health claims that emphasize soluble fiber's role in reducing the risk of coronary heart disease, enabling manufacturers to market their products with scientific credibility.
Wheat-based cereals maintain a strong market presence by emphasizing whole grain benefits, supported by FDA guidelines that define whole grains as containing bran, germ, and endosperm in their natural proportions. Rice-based cereals cater to gluten-free consumers, while barley remains a niche ingredient despite its nutritional benefits. The "Others" category includes ancient grains and specialized formulations, appealing to health-conscious consumers who seek nutritional differentiation and are willing to pay a premium. Although corn leads the market, it faces challenges from volatile commodity prices and shifting consumer preferences toward perceived healthier alternatives. Meanwhile, oats benefit from advancements in protein fortification and clean-label marketing strategies.
By Product Nature:
Organic Segment Captures Premium GrowthConventional cereals held 72.05% market share in 2025. These products, known for their cost advantages and extensive retail distribution, primarily target price-sensitive consumers and institutional buyers. However, the segment is under increasing pressure from clean-label trends and reformulation demands. To address this, manufacturers are focusing on removing artificial ingredients to better compete with organic products.
Conversely, organic variants are experiencing rapid growth, with a projected 7.31% CAGR through 2031. This growth is driven by rising consumer health awareness and regulatory support. The USDA's "Strengthening Organic Enforcement" rule enhances supply chain transparency and fraud prevention, ensuring the consumer trust essential for the organic segment's development. Reinforcing this commitment, in May 2024, the USDA announced a USD 24.8 million grant program to expand organic markets and assist farmers in transitioning to organic practices. Research from the Organic Trade Association reveals that 70% of younger consumers trusted the organic seal in 2024. However, entering the organic market poses challenges. Regulatory frameworks, such as USDA organic certification standards, protect established organic brands while requiring substantial investments from conventional manufacturers seeking entry. As economies of scale improve, the price gap between conventional and organic cereals is narrowing. This, combined with consumers' willingness to pay a premium for perceived health benefits, continues to drive demand for organic products.
By Distribution Channel:
E-commerce Transforms Retail DynamicsSupermarkets and hypermarkets maintained a 58.98% market share in 2025, leveraging their extensive shelf space and promotional capabilities. At the same time, online retail stores demonstrated remarkable growth, with an 8.57% CAGR projected through 2031. The COVID-19 pandemic significantly accelerated this digital transformation. Convenience stores address immediate consumption needs but face challenges due to space constraints that limit their SKU variety. On the other hand, specialist stores cater to health-conscious consumers by offering organic and premium products. Other distribution channels, such as foodservice and institutional sales, also contribute to the market dynamics.
The growth of e-commerce highlights a shift in consumer preferences toward convenience and subscription-based models. This trend has enabled direct-to-consumer brands, such as Magic Spoon and Catalina Crunch, to bypass traditional retail gatekeepers. In response, traditional retailers are enhancing their online capabilities and introducing curbside pickup services to compete with dedicated e-commerce platforms. This shift in distribution channels creates opportunities for premium and niche brands to connect with targeted consumer segments without relying on extensive physical distribution networks. However, it also challenges established brands to strengthen their digital marketing strategies and optimize direct-to-consumer fulfillment systems.
Geography Analysis
North America Breakfast Cereals Market
North America's breakfast cereal market exhibits distinct regional growth patterns, with the United States maintaining 49.12% market share in 2025. As the US market matures, manufacturers are focusing on premiumization. This strategy is highlighted by General Mills' recent product launches, such as Wheaties Protein, which contains over 20 grams of protein per serving, and Cheerios Protein, both targeting health-conscious consumers. Meanwhile, Canada is steadily adopting organic and clean-label products. WK Kellogg has leveraged this trend, reporting market share growth through its "better-for-you" positioning. In contrast, Mexico is experiencing rapid growth, with a projected CAGR of 7.29% through 2031. This expansion is driven by urbanization, increasing disposable incomes, and the younger population's adoption of Western breakfast habits, creating significant opportunities for established brands seeking geographic diversification.
The regulatory environment across North America varies widely. In the US, the FDA's standards often influence product development throughout the region. A key change will occur in February 2025, when the FDA's updated "healthy" claim criteria will prevent highly sweetened cereals from being marketed as healthy. On the other hand, whole grain cereals will benefit by commanding premium prices. On the supply chain side, Mexico's drought has increased its reliance on corn imports, creating procurement challenges for manufacturers with cross-border operations. Additionally, trade policy uncertainties, such as the potential imposition of 25% tariffs on imports from Canada and Mexico, threaten to disrupt regional supply chains and raise costs. Consumer preferences across North America show distinct variations. US households prioritize convenience and protein-enriched options. Canadian consumers favor organic and sustainable products. Meanwhile, in Mexico, the rise of dual-income households has driven strong growth in ready-to-eat formats. Although the "Rest of North America" segment is smaller, it offers niche opportunities for premium brands. E-commerce adoption also varies by geography: the US and Canada lead in digital transformation, while Mexico is rapidly advancing as its infrastructure improves. Climate-related challenges, such as droughts impacting grain production, highlight regional vulnerabilities. To address these issues, manufacturers are diversifying sourcing strategies and optimizing inventory management across North America.
Regulatory Landscape
In the United States, the FDA finalized the updated definition for the implied nutrient content claim "healthy", effective February 25, 2025, aligning criteria with the 2020-2025 Dietary Guidelines for Americans and setting a compliance date of February 25, 2028. This change affects how ready-to-eat cereals with higher sugar content can be positioned, and it is pushing reformulation toward whole grains and lower added sugars to retain on-pack health messaging.
Institutional and public-program standards also shape formulation. Under USDA CACFP requirements, breakfast cereals served in the program must contain no more than 6 grams of added sugars per dry ounce starting October 1, 2025, and meet grain/fortification conditions. In Canada, Health Canada front-of-pack nutrition symbol labeling moved into full compliance on January 1, 2026, and interim policy guidance provides a pathway for dense ready-to-eat cereals (for example, granola formats) to assess thresholds using a 55 g reference amount rather than a 1-cup serving size, influencing label outcomes and pack architecture decisions.
Competitive Landscape
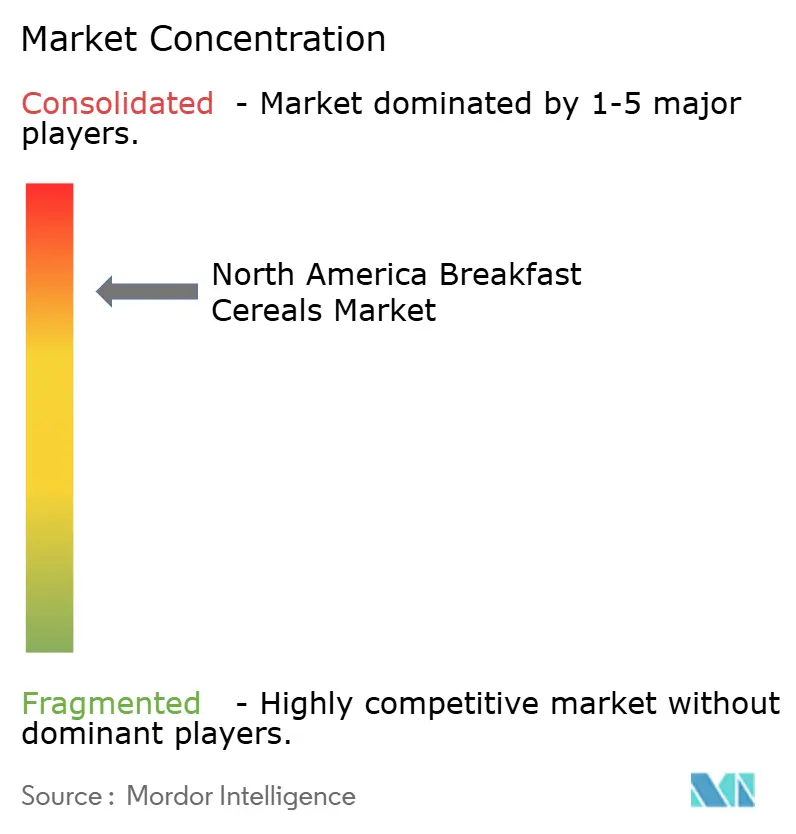
The North American breakfast cereal market is highly consolidated, primarily driven by Mars' USD 35.9 billion acquisition of Kellanova and Ferrero's USD 3.1 billion purchase of WK Kellogg. These moves not only consolidate the market but also empower the acquirers to harness global distribution networks and research and development capabilities, accelerating their innovation cycles. With an eye on the future, Mars aims to double its snacking business growth over the next decade. Yet, the landscape remains fiercely competitive. Smaller disruptors like Magic Spoon, Catalina Crunch, and Three Wishes Cereal are making significant inroads, leveraging direct-to-consumer models and a protein-centric approach that sidesteps traditional retail gatekeepers.
Key players in the North American breakfast cereal arena include General Mills Inc., PepsiCo, Inc., Bob’s Red Mill Natural Foods, Mars Inc., and Post Consumer Brands LLC. These industry giants are not just focusing on mergers, expansions, and acquisitions, but are also heavily investing in new product development. Such strategies bolster their brand presence in a crowded market. Furthermore, technology adoption is becoming a key differentiator. Manufacturers are channeling investments into modernizing their supply chains and enhancing digital marketing efforts to resonate with the evolving consumer base. In a testament to this trend, WK Kellogg announced a substantial investment of up to USD 500 million in January 2025, aiming to revamp its supply chain for heightened production and profit margins.
There's a burgeoning opportunity in the organic and clean-label segments. Here, stringent regulatory compliance acts as a double-edged sword: it shields established players from new entrants while simultaneously rewarding those willing to invest in innovation. Highlighting the industry's shift towards sustainability, General Mills forged a partnership with Ahold Delhaize in September 2024, focusing on emissions reduction in wheat and oats sourcing. Such initiatives not only underscore the importance of sustainability but also hint at the competitive edge it can provide through optimized supply chains. However, navigating the regulatory landscape isn't a level playing field. The FDA's revamped "healthy" claim standards impose stringent compliance requirements. This shift seems to favor larger manufacturers, equipped with the resources to adeptly handle complex reformulation processes, while posing significant challenges for smaller players who may lack such regulatory expertise.
North America Breakfast Cereals Industry Leaders
-
General Mills Inc.
-
PepsiCo, Inc.
-
Bob’s Red Mill Natural Foods
-
Post Consumer Brands, LLC
-
Mars Inc
- *Disclaimer: Major Players sorted in no particular order
North America Breakfast Cereals Market Companies Covered in this Report
- General Mills Inc.
- Mars Inc
- Post Consumer Brands LLC
- PepsiCo Inc. (Quaker)
- Nature's Path Foods
- Bob's Red Mill Natural Foods
- Umpqua Oats
- Kashi Company
- Catalina Crunch
- Magic Spoon
- Purely Elizabeth
- Seven Sundays
- Love Grown Foods
- Three Wishes Cereal
- Weetabix Ltd. (Barbara's Bakery)
- KIND Cereal
- Grain Berry (Silver Palate)
- Arrowhead Mills
- Malt-O-Meal (Post)
- Purely Simple Foods
Market Opportunities and Future Outlook
Regulatory-driven reformulation and clearer label signaling create room for cereals that can qualify for positive health positioning while remaining mainstream on taste and price. The FDA "healthy" claim update (effective February 2025, compliance by February 2028) and USDA CACFP added-sugar limits (6 g per dry ounce starting October 2025) favor portfolios built around whole grains, fiber, and reduced added sugars, which supports premiumization strategies already visible in protein-fortified lines.
Manufacturing modernization and co-manufacturing expansion are turning the demand shift into new capacity and formats, particularly for oats, granola, and functional ready-to-cook offerings. WK Kellogg outlined a USD 450-500 million supply chain modernization plan spanning facilities in Battle Creek (Michigan), Lancaster (Pennsylvania), and Belleville (Ontario), while Richardson International announced an expansion of granola packaging capabilities at its South Sioux City (Nebraska) oat processing facility targeted for completion by Q1 2026. On the capacity and partnering front, Cerealto disclosed a strategic majority investment in US co-manufacturer Fresca Foods (Boulder and Denver, Colorado) in November 2025, followed by a EUR 75 million capex plan to increase capacity at industrial sites in the United States and Spain, supporting faster scaling of private label and branded cereal programs without relying solely on legacy in-house lines.
Recent Industry Developments in North America Breakfast Cereals Market
- July 2026: General Mills announced a multi-year USD 3 billion cost-savings plan over four years to address inflationary pressures and help fund growth investments. The program supports continued portfolio renovation in center-aisle categories, including cereals, by freeing up resources for renovation, media, and supply chain productivity.
- November 2025: Cerealto disclosed a strategic majority investment in US co-manufacturer Fresca Foods (Boulder and Denver, Colorado), followed by a 2026 capital investment plan (EUR 75 million) to increase capacity at industrial sites in the United States and Spain. This supports faster scaling of private label and branded cereal programs without relying solely on legacy in-house lines.
- August 2024: Mars agreed to acquire Kellanova for USD 83.50 per share in cash, totaling USD 35.9 billion. The deal consolidates scale across snacks and breakfast-linked portfolios and strengthens route-to-market and brand investment capacity for cereal-adjacent platforms in North America.
North America Breakfast Cereals Market Report Scope and Research Methodology
Market Definition and Coverage
This market covers packaged breakfast cereals sold for home consumption across North America, counted in value terms based on what buyers pay through retail and online channels. It includes ready-to-eat cereals and ready-to-cook cereal products that are marketed and consumed as breakfast staples.
Scope exclusions: Excludes non-cereal breakfast foods such as bakery items, breakfast bars, dairy, and beverage-based breakfasts, even when they are positioned for morning consumption.
Segments Covered in This Report
- Product Type
- Ready-to-Eat Cereals
- Flakes
- Puffed Cereals
- Granola and Clusters
- Others (Coated/Sugar-Frosted Cereals, Shredded and Threaded)
- Ready-to-Cook Cereals
- Hot Oatmeal
- Muesli and Porridge Mixes
- Other Ready-to-Cook Cereals
- Ready-to-Eat Cereals
- Ingredient Source
- Wheat
- Corn
- Oats
- Rice
- Barley
- Others
- Product Nature
- Conventional
- Organic
- Distribution Channel
- Supermarkets / Hypermarkets
- Convenience Stores
- Specialist Stores
- Online Retail Stores
- Other Distribution Channels
- Country
- United States
- Canada
- Mexico
- Rest of North America
Data Sources, Market Sizing, and Validation
Desk Research
The desk stage starts by mapping demand and supply context for breakfast cereals in the United States, Canada, and Mexico, then aligning it to retail pricing realities. We used public sources such as USDA food availability and price series, Statistics Canada food retail and CPI tables, and Mexico INEGI releases on consumer prices and household consumption to build baseline consumption and inflation assumptions.
To keep scope and trade flows grounded, we also reviewed sources such as UN Comtrade for cereal-related trade, USITC trade statistics, and relevant food standards and labeling materials from FDA and Health Canada. Company annual reports, investor decks, earnings call remarks, and reputable press were used to confirm category mix shifts, especially between ready-to-eat and hot cereal. Where needed, paid subscriptions were used only for company financials and intelligence, patent lookups for ingredient or processing changes, and shipment-level import and export checks. These sources are illustrative rather than exhaustive, since the study also relied on additional references for cross-checks and clarification.
Primary Interviews and Surveys
Primary work was used to pressure-test the desk assumptions and to fill gaps that public data does not show clearly, such as pricing behavior by channel and how promotions changed realized prices. We spoke with cereal manufacturers, ingredient and packaging participants, distributors, and retail-facing category professionals across the United States, Canada, and Mexico. We also checked inputs with people familiar with organic and conventional product positioning.
Distribution of primary research fieldwork respondents
| Company type | Respondent position |
|---|---|
| Top tier: 28% | CXOs: 13% |
| Mid tier: 57% | Functional/Unit leaders: 31% |
| Smaller Players: 15% | Managers: 56% |
Market-Sizing & Forecasting
The market model is built mainly from a top-down demand pool, where consumption patterns and retail price movement are used to reconstruct category value for breakfast cereals across North America. We start with country-level category demand indicators and then apply price ladders and channel splits so the total reflects how cereals are purchased in practice.
To keep results realistic, we corroborate with selective bottom-up approximations, including sampled shelf prices and typical promotion depths multiplied by implied consumption volumes, followed by adjustments when mismatches show up. Key inputs in the model include the ready-to-eat versus ready-to-cook mix, inflation and promotion intensity, shifts between conventional and organic lines, changes in input costs that feed into pricing, and changes in distribution channel share, including online penetration. When some variables are not available for every country-year, we use proxy series such as food CPI movements and trade signals, then validate the implied trends through interviews.
For forecasting, we run scenario analysis around pricing and mix. The base case is supported with an ARIMA-style time series pass on historical value and key drivers, so short-term volatility does not overpower the mid-term trend. The forward view is refined using what primary respondents consider realistic for price progression, category premiumization, and demand stability in each major country.
Data Validation & Update Cycle
Validation is done through several checks so that no single data series drives the final number. We compare modeled totals against independent signals such as food inflation direction, cereal-related trade movement, and channel performance commentary, then review variances until they align with plain market terms.
Outliers are flagged at the country and subcategory level, and those items are reworked by revisiting assumptions such as realized price, mix, and the split between ready-to-eat and ready-to-cook. A separate analyst review is completed before sign-off, and re-contact is triggered when a data point moves materially or when a new event changes demand or pricing. Reports are refreshed annually, with interim updates when material events occur, and a final pass is completed before delivery so clients receive the latest updated view.
Mordor Intelligence's North America Breakfast Cereals Market Size Compared With Other Published Estimates
Published market sizes for North America breakfast cereals can be far apart even when the product topic name is the same, because the included countries, product boundaries, and pricing logic often differ. Variances also come from which year is used as the base, whether promotions are reflected in price, and how quickly the model is updated when inflation and mix shift.
Breakfast bars and other non-cereal morning foods sit outside Mordor Intelligence's scope, which tends to pull estimates down versus studies that blend adjacent breakfast categories into one revenue pool. The spread can also widen if an estimate excludes Mexico, relies on list prices instead of realized prices after promotions, or extends the forecast horizon with a faster price escalation path without re-checking it against CPI movement and channel behavior.
Benchmark comparison
| Source | Market Size | Gaps in Research Methodology |
|---|---|---|
| Mordor Intelligence | USD 17.15 B (2026) | |
| Industry Publisher A | USD 25.49 B (2025) | Uses a narrower country set, and the higher total suggests broader category aggregation and price assumptions that can lift value versus a cereal-only count across the full North America coverage. |
| Industry Publisher B | USD 34.00 B (2024) | Anchored to an earlier base year and likely applies wider category or pricing coverage, where promotion-adjusted realized prices and cereal-only boundaries are not clearly separated, which can inflate the reported market value. |
Looking across the three numbers, most of the gap can be explained by what gets counted as cereal, which countries are included, and whether pricing reflects real purchase conditions in stores and online. Our approach keeps the total traceable to clear demand signals, country coverage, and a repeatable price and mix build that is then cross-checked with independent indicators before finalizing.
Key Questions Answered in the Report
How big is the North America breakfast cereal market in 2026?
Sales are estimated at USD 17.15 billion, and the category is on track to reach USD 22.78 billion by 2031.
Which segment is growing fastest through 2031?
Oat-based cereals are forecast to post an 7.82% CAGR through 2031 thanks to protein and heart-health positioning.
Why is protein fortification important in cereals?
Seventy-one percent of consumers are boosting protein intake; fortified cereals deliver 8-20 g per serving with minimal prep time.
How will FDA sugar regulations affect cereal recipes?
Rules effective February 2025 limit added sugars, pushing brands to cut sweeteners and raise whole-grain content to retain “healthy” labeling.