
Non-Hodgkin Lymphoma Therapeutics Market Size and Share
Market Overview
| Study Period | 2020 - 2031 |
|---|---|
| Market Size (2026) | USD 11.93 Billion |
| Market Size (2031) | USD 16.69 Billion |
| Growth Rate (2026 - 2031) | 6.96 % |
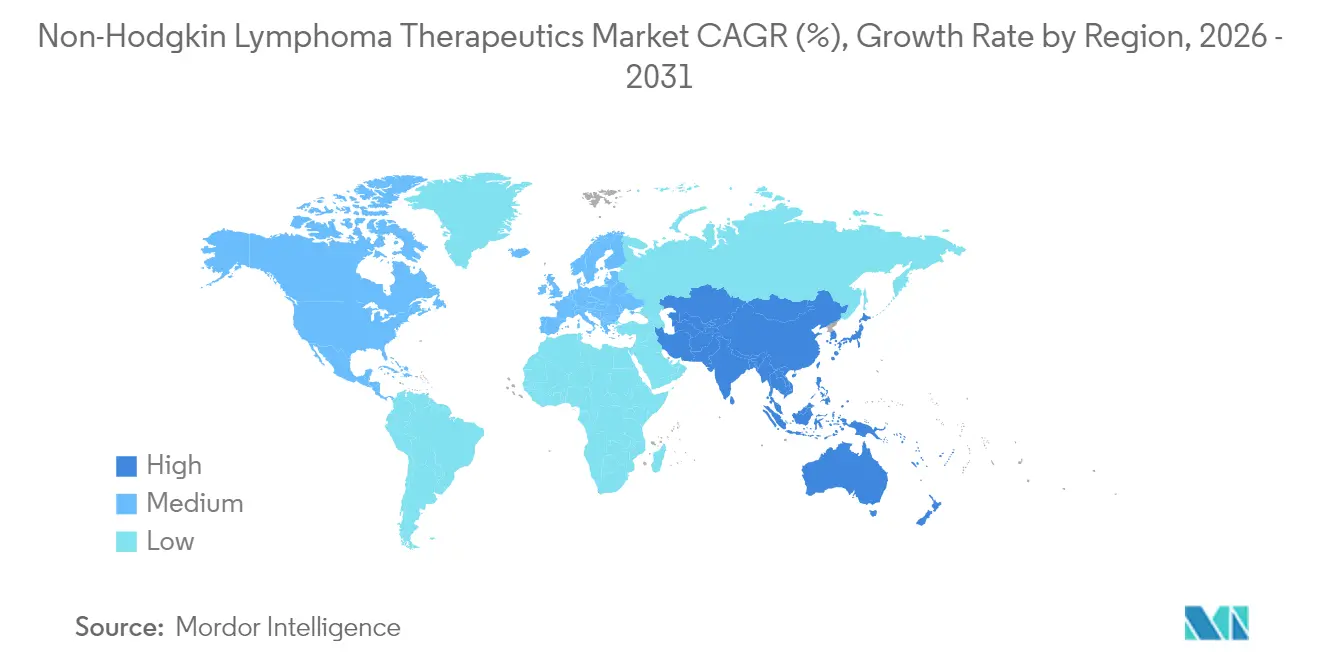
| Fastest Growing Market | Asia Pacific |
| Largest Market | North America |
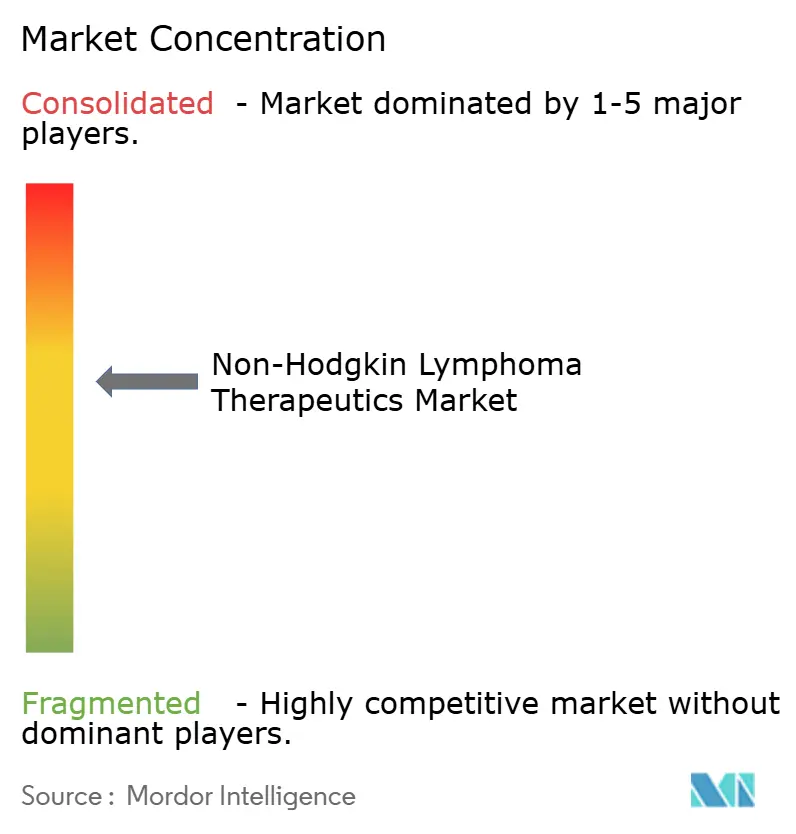
| Market Concentration | Medium |
Major Players *Disclaimer: Major Players sorted in no particular order Image © Mordor Intelligence. Reuse requires attribution under CC BY 4.0. | |
Non-Hodgkin Lymphoma Therapeutics Market Analysis by Mordor Intelligence
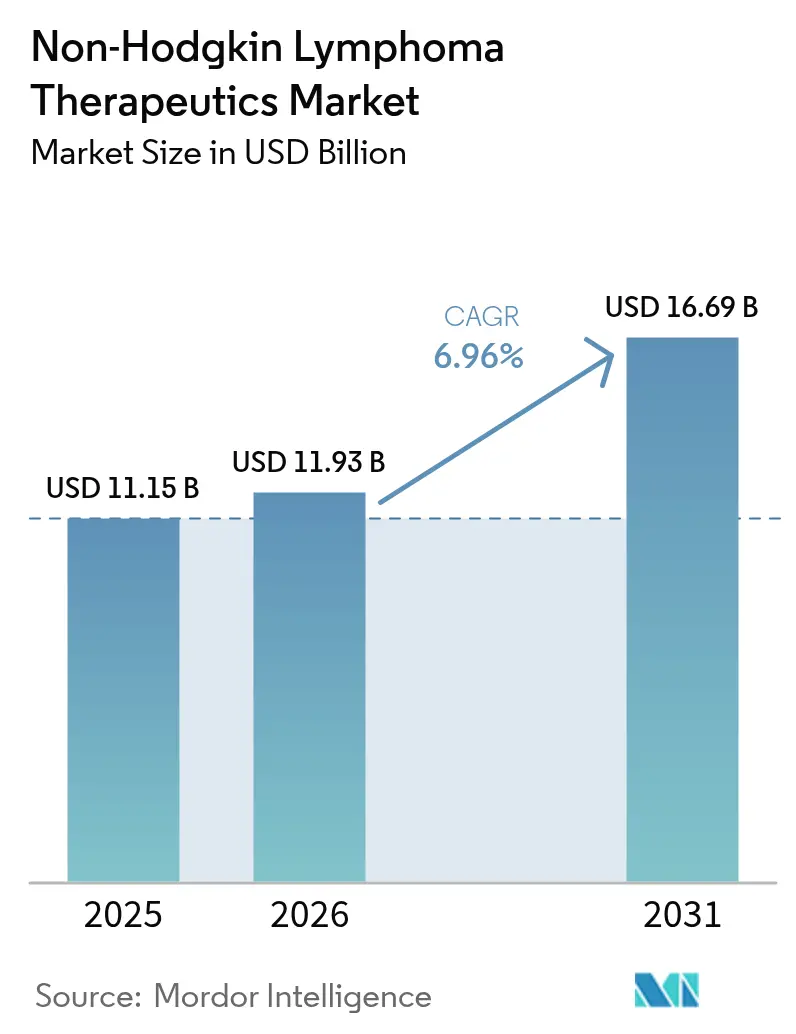
The Non-Hodgkin Lymphoma Therapeutics Market size was valued at USD 11.15 billion in 2025 and estimated to grow from USD 11.93 billion in 2026 to reach USD 16.69 billion by 2031, at a CAGR of 6.96% during the forecast period (2026-2031). Growth reflects a decisive shift away from single-agent chemotherapy toward precision immunotherapies, especially chimeric antigen receptor T-cell (CAR-T) products and bispecific antibodies that produce durable remissions in heavily pre-treated patients. North America sustains leadership on the back of robust expedited-approval programs, early reimbursement adoption, and a mature network of certified cell-therapy centers. Meanwhile, Asia-Pacific registers the fastest uptake as domestic manufacturers scale automated cell-processing lines and governments expand oncology coverage. Therapy-line dynamics underscore unmet need: first-line regimens retain dominance, yet third-line and refractory populations spur the bulk of incremental revenue as physicians exhaust conventional options. Competitive intensity rises as large pharma invests in closed, modular CAR-T production platforms that compress vein-to-vein intervals, directly improving progression-free survival outcomes. Regulatory harmonization between U.S. and EU agencies continues to streamline dossier requirements, accelerating global launches of next-generation constructs.
Key Report Takeaways
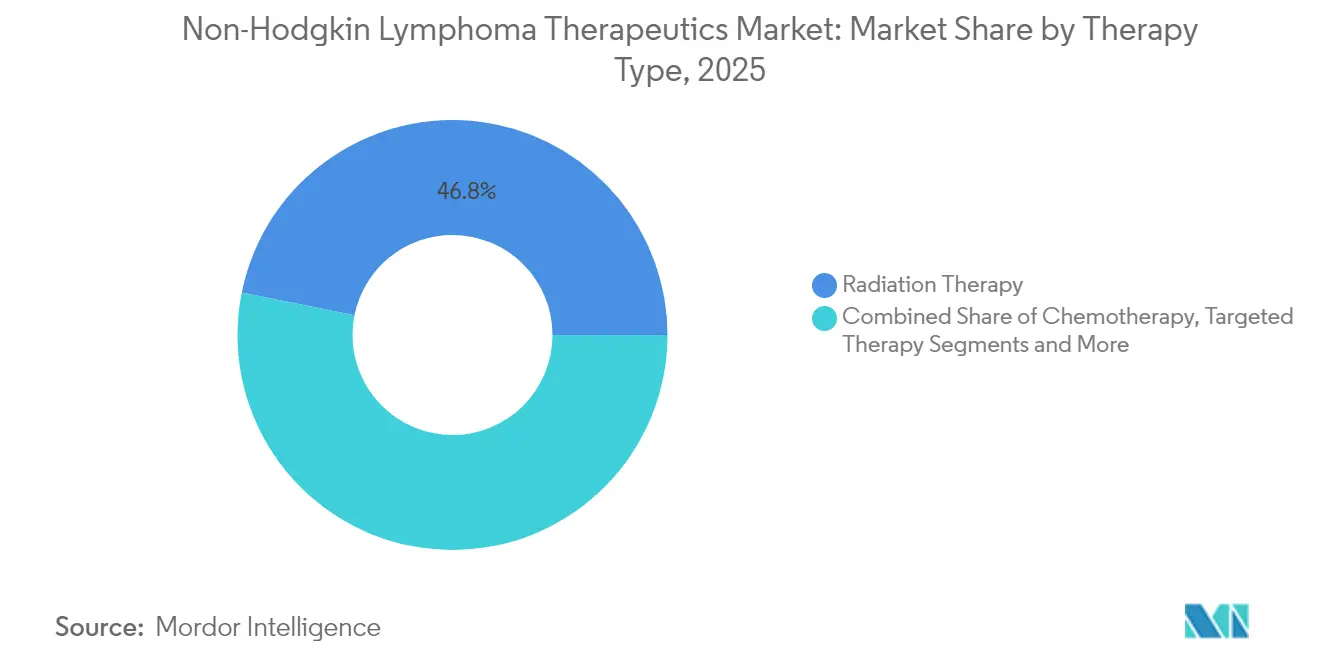
- By therapy type, radiation therapy led with 46.83% revenue share in 2025; chemotherapy is forecast to expand at a 8.28% CAGR through 2031.
- By cell type, B-cell lymphomas held 72.05% of the Non-Hodgkin lymphoma therapeutics market share in 2025, while T-cell lymphomas record the fastest 7.93% CAGR to 2031.
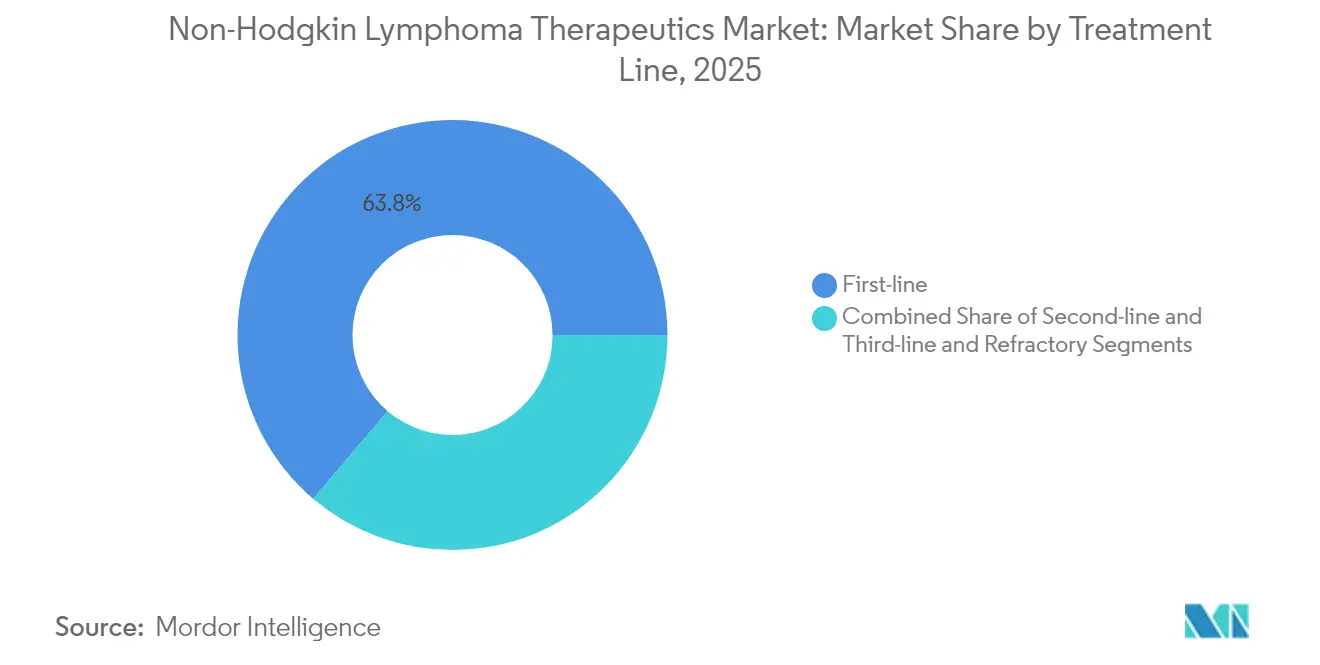
- By treatment line, first-line regimens accounted for 63.78% share of the Non-Hodgkin lymphoma therapeutics market size in 2025, yet third-line and refractory settings are advancing at a 7.62% CAGR through 2031.
- By geography, North America controlled 45.12% revenue in 2025; Asia-Pacific is projected to rise at an 8.63% CAGR over the same horizon.
Note: Market size and forecast figures in this report are generated using Mordor Intelligence’s proprietary estimation framework, updated with the latest available data and insights as of 2026.
Market Trends and Insights
Drivers Impact Analysis of Non-Hodgkin Lymphoma Therapeutics Market*
| Driver | (~) % Impact on CAGR Forecast | Geographic Relevance | Impact Timeline |
|---|---|---|---|
| Growing Burden of Non-Hodgkin Lymphoma (NHL) | +1.2% | Global, with highest incidence in North America and Europe | Long term (≥ 4 years) |
| Demand For Innovative Drugs & Novel Technologies | +1.8% | North America & EU leading, APAC emerging | Medium term (2-4 years) |
| Favourable Regulatory Approvals & Expedited Pathways | +1.5% | Global, with FDA and EMA harmonization efforts | Short term (≤ 2 years) |
| Expansion of Real-World Evidence Datasets Boosting Reimbursement | +0.9% | North America & EU primarily, expanding to APAC | Medium term (2-4 years) |
| Precision-Diagnostic Biomarkers Driving Earlier-Line Adoption | +1.1% | Global, with advanced markets leading implementation | Medium term (2-4 years) |
| Shift Toward Personalized Medicine | +1.3% | North America & EU core, spill-over to APAC | Long term (≥ 4 years) |
| Source: Mordor Intelligence | |||
Growing Burden of Non-Hodgkin Lymphoma Drives Market Expansion
Annual U.S. diagnoses of diffuse large B-cell lymphoma now exceed 18,000 and continue to rise with population aging and improved detection capabilities.[1] Relapse remains frequent, as 40% of patients fail to achieve durable remission after standard R-CHOP. Each subsequent therapy line raises failure risk, reaching 80% by the fifth attempt. Expanding incidence increases hospitalizations, infusion-center demand, and overall pharmaceutical spending, directly lifting Non-Hodgkin lymphoma therapeutics market revenue. Epidemiologic momentum is especially strong in middle-income economies where diagnostic imaging and immunohistochemistry capacity are scaling. Rising case volumes generate larger trial-ready patient pools that speed enrollment for innovative agents.
Innovative Drug Technologies Transform Treatment Paradigms
CAR-T constructs such as axicabtagene ciloleucel deliver 89% one-year progression-free survival in consolidation settings, far exceeding historical benchmarks. Subcutaneous bispecifics like epcoritamab achieve 38.9% complete responses in third-line large B-cell lymphoma versus 9.4% for chemo-immunotherapy. Automated stirred-tank bioreactors now reach cell densities above 5 × 10^6 cells/ml within seven days, cutting production time and contamination risk. Artificial-intelligence tools integrate genomic, biomarker, and outcomes data to guide sequencing, elevating response durability and reducing overtreatment. These advances strengthen clinical value propositions and reinforce payer willingness to reimburse premium list prices.
Regulatory Expedited Pathways Accelerate Market Access
The U.S. Food and Drug Administration has conferred Breakthrough Therapy or RMAT status on odronextamab, epcoritamab, and BGB-16673, trimming average review time to 6.7 months and allowing single-arm pivotal data when randomized trials are infeasible. Parallel scientific advice and rolling submissions between FDA and the European Medicines Agency create predictability, though EU health-technology assessment demands still elongate reimbursement decisions. Fast-track designations incentivize venture capital toward early-stage modalities, broadening the Non-Hodgkin lymphoma therapeutics market pipeline. Accelerated approvals also enable earlier revenue capture that funds post-marketing confirmatory trials.
Real-World Evidence Expansion Strengthens Reimbursement Decisions
Integrated health-system analyses show CAR-T therapy lowers cumulative inpatient days by 33% relative to sequential chemotherapy through 24 months post-infusion. Payers increasingly link payment to outcomes using milestone-based contracts that rebate cost if pre-specified survival thresholds are missed, mitigating budget-impact concerns. Community-practice data sets widen the evidence base to older and comorbid patients often excluded from trials, confirming generalizability and reinforcing clinician confidence. Wider dissemination of real-world evidence thus converts clinical success into broader commercial adoption, amplifying Non-Hodgkin lymphoma therapeutics market penetration.
Restraints Impact Analysis of Non-Hodgkin Lymphoma Therapeutics Market*
| Restraint | (~) % Impact on CAGR Forecast | Geographic Relevance | Impact Timeline |
|---|---|---|---|
| High Cost of Novel NHL Therapies | -0.8% | Global, particularly impacting emerging markets | Long term (≥ 4 years) |
| Adverse Effects & Safety Concerns (E.G., CRS, Neuro-Toxicity) | -0.6% | Global, with varying tolerance across regions | Medium term (2-4 years) |
| Autologous Cell-Therapy Manufacturing Bottlenecks | -1.1% | Global, with supply chain concentration in North America & EU | Short term (≤ 2 years) |
| Stringent Regulations and Guidelines Regarding the Treatments | -0.4% | Global, with EMA showing more stringent requirements than FDA | Long term (≥ 4 years) |
| Source: Mordor Intelligence | |||
High Therapeutic Costs Limit Market Penetration
Median U.S. acquisition prices for single-dose CAR-T products exceed USD 400,000, and supportive-care costs lift total episode spending above USD 500,000 in many centers.[2] Budget-impact models show that treating every eligible third-line patient would raise national oncology drug outlays by 3-4% annually, pressuring public and private payers. While value-based contracts temper financial exposure, their uptake remains patchy outside the United States. Emerging economies face steeper hurdles as limited specialized facilities and out-of-pocket payment structures restrict access, curbing the Non-Hodgkin lymphoma therapeutics market’s global reach. Price sensitivity also influences formulary placements for bispecific antibodies and antibody-drug conjugates, decelerating uptake despite clinical benefit.
Safety Concerns and Adverse Effects Constrain Adoption
Cytokine release syndrome occurs in up to 42% of axicabtagene recipients, with 11% experiencing grade ≥ 3 neurotoxicity. Hemophagocytic lymphohistiocytosis, although rare, carries 77% mortality and necessitates intensive critical-care resources.[3] Prolonged cytopenia lasting beyond 30 days affects 30-40% of patients, elevating infection risk. These complications compel treatment at accredited centers with 24/7 cellular-therapy teams, limiting geographical coverage. For some community oncologists, referral logistics and ongoing safety management requirements deter aggressive use, tempering Non-Hodgkin lymphoma therapeutics market expansion until next-generation constructs demonstrate improved tolerability.
*Our forecasts treat driver/restraint impacts as directional, not additive. The impact forecasts reflect baseline growth, mix effects, and variable interactions.
Non-Hodgkin Lymphoma Therapeutics Market Segment Analysis
By Therapy Type:
Immunotherapy Innovation Reshapes Treatment LandscapeRadiation therapy retained 46.83% share of the Non-Hodgkin lymphoma therapeutics market in 2025 owing to its established role in curative intent protocols and broad equipment availability. Yet chemotherapy posts the fastest 8.28% CAGR through 2031 as dose-dense regimens and novel maintenance schedules raise tolerability and extend use into older cohorts. The immunotherapy subset remains smaller but accelerates at 8.16% CAGR, supported by CAR-T and bispecific launches that address refractory disease gaps. A comparative real-world study reported 89% one-year progression-free survival for post-transplant CAR-T consolidation versus 54% under historical salvage, reinforcing clinical preference.
Broader adoption of closed, automated manufacturing has compressed production cycles from 22 days to 12 days, lowering facility overhead and making on-demand therapy more feasible. Bispecific antibodies deliver outpatient subcutaneous dosing, reducing chair-time and enabling administration in community clinics, which widens patient access. These advantages increase the immunotherapy contribution to overall revenue, steadily eroding chemotherapy dependence. Still, radiation remains entrenched for localized early-stage presentations, underlining a multimodal future in which novel biologics are layered onto foundational modalities.

By Cell Type:
B-cell Dominance with T-cell BreakthroughsB-cell entities accounted for 72.05% of 2025 revenue, reflecting higher incidence and multiple approved CD19 CAR-T products. Two constructs produced durable complete responses in 40% of large B-cell lymphoma cases at 24 months follow-up. The segment benefits from an expanding bispecific pipeline addressing CD20, CD22, and CD79b, which may shift some market volume from autologous products to off-the-shelf antibodies. The Non-Hodgkin lymphoma therapeutics market size for B-cell subtypes is forecast to rise steadily with 6.38% CAGR on the back of these incremental launches.
T-cell lymphomas generate a smaller absolute base but advance fastest at 7.93% CAGR. Emerging constructs target TRBC1/2 and CCR4, overcoming previous antigen-sharing obstacles that risked self-fratricide. Phase I data on CD30-directed CAR-T in relapsed anaplastic large-cell lymphoma demonstrated 71% overall response with manageable toxicity. Orphan-drug exclusivities and accelerated review incentives shorten commercial timelines, enticing biotech entrants that specialize in niche hematologic indications. Consequently, the segment promises outsized future contribution to overall Non-Hodgkin lymphoma therapeutics market growth relative to its current footprint.
By Treatment Line:
Refractory Settings Drive Innovation InvestmentFirst-line regimens, primarily R-CHOP variants, delivered 63.78% of 2025 revenue as clinicians follow evidence-based guidelines for newly diagnosed diffuse large B-cell lymphoma. Addition of novel agents such as polatuzumab vedotin to front-line combinations shows potential to lift complete response rates, although cost-effectiveness analyses remain ongoing. The Non-Hodgkin lymphoma therapeutics market size linked to first-line therapy therefore grows modestly with incident case numbers rather than price escalation.
Conversely, third-line and refractory cohorts post the steepest 7.62% CAGR, reflecting substantial unmet need among patients who cycle through multiple regimens. CAR-T and bispecifics command premium pricing, and consolidation strategies after autologous transplant increase treatment courses per patient. Real-world multicenter research documented a 38.9% complete response for epcoritamab after two or more prior lines, quadrupling rates seen with chemo-immunotherapy. High clinical value plus survival benefit support sustained reimbursement even in cost-constrained systems, cementing third-line dominance over forecast horizon.
Geography Analysis
North America Non-Hodgkin Lymphoma Therapeutics Market
North America contributed 45.12% of 2025 revenue, as widespread payer coverage and 105 certified cell-therapy centers under the U.S. FACT accreditation program enable rapid uptake. The region's non-Hodgkin lymphoma therapeutics market share is expected to remain stable through 2031 despite price headwinds, as new indications offset unit-cost pressure. Regional real-world data networks such as CIBMTR feed continuous safety updates that refine protocols and sustain clinician confidence.
Europe Non-Hodgkin Lymphoma Therapeutics Market
Europe follows with a mature yet slower-growing base where health-technology assessments shape adoption. While EMA approval lags FDA by roughly three quarters, outcome-based reimbursement pilots in Germany and Spain are unlocking incremental access. National programs invest in domestic cell-manufacturing hubs, reducing cross-border logistical delays and aligning with sustainability targets. The Non-Hodgkin lymphoma therapeutics market size linked to key EU5 countries is anticipated to rise in the coming years, primarily from bispecific uptake that requires no leukapheresis.
APAC, LATAM and MEA Non-Hodgkin Lymphoma Therapeutics Market
Asia-Pacific registers the most vigorous 8.63% CAGR as China’s expedited local regulatory pathways and Medicare-style reimbursement pilot dramatically expand patient access. More than 20 Chinese manufacturers operate commercial CAR-T facilities, and point-of-care production models shorten turnaround to seven days in top oncology hospitals. Japan’s Pharmaceutical and Medical Device Agency supports conditional approvals with post-marketing surveillance, accelerating earlier patient availability. These initiatives combine with rising middle-class insurance penetration to elevate overall regional demand. Latin America and the Middle East & Africa remain nascent but improving as regional centers of excellence emerge in Brazil, Saudi Arabia, and South Africa. Cross-border patient flow, collaborative training programs, and technology-transfer partnerships gradually enhance localized treatment capacity, broadening the Non-Hodgkin lymphoma therapeutics market footprint beyond traditional high-income geographies.
Regulatory Landscape
Regulatory oversight for NHL therapeutics continues to be shaped by accelerated oncology pathways in the United States and assessment reforms across Europe. In the United States, the FDA maintains accelerated approvals and other expedited programs for hematologic malignancies, while the July 2026 HHS announcement of Operation TrialBlazer aims to modernize clinical development from IND through pivotal trials, supporting more efficient evidence generation for complex modalities such as bispecific antibodies and CAR-T products. The FDA also issued oncology-focused draft guidance in 2026 to streamline nonclinical safety expectations for certain biologic and conjugated products, reflecting a broader push to reduce nonclinical burden while maintaining patient safety oversight.
In Europe, authorization remains centralized through EMA and the European Commission, with access increasingly influenced by region-wide reforms. The European Commission approved Tepkinly (epcoritamab) in June 2026 in combination with lenalidomide and rituximab for relapsed or refractory follicular lymphoma, illustrating continued willingness to clear combination immunotherapy regimens for refractory disease. The EU Health Technology Assessment Regulation (HTAR) rollout is changing the authorization-to-reimbursement workflow, adding a new layer of coordination intended to reduce cross-country access disparities, even as national pricing and reimbursement decisions remain locally controlled.
Value Chain Analysis
The NHL therapeutics value chain spans discovery and development, sourcing biologic materials, GMP manufacturing, quality control and release, and distribution through specialty channels to hospital and infusion-center sites. For monoclonal antibodies, bispecifics, and ADCs, the chain is anchored in high-complexity bioprocessing and fill-finish, followed by specialty distribution and cold-chain logistics to oncology centers. For autologous CAR-T, the chain is more fragmented and time-critical, linking leukapheresis at qualified treatment centers to centralized (or point-of-care) cell processing, chain-of-identity and chain-of-custody controls, release testing, and return shipment for infusion, which makes operational execution a differentiator for manufacturers and treatment networks.
Key bottlenecks sit in manufacturing reliability, site capacity, and logistics synchronization. Autologous CAR-T programs face manufacturing failure risks reported to reach 25% in NHL, increasing re-manufacturing needs, prolonging time-to-treatment, and raising cost-to-serve. At the same time, conventional chemotherapy supply remains exposed to shortages. A NCCN survey from June 2024 highlighted continued shortages affecting agents including vinblastine, etoposide, and topotecan, forcing providers to use shortage-management protocols and occasionally substitute regimens. These constraints increase the importance of diversified supplier qualification, buffer inventories for critical generics, and more automated, closed, and traceable manufacturing systems for advanced therapies.
Competitive Landscape
The landscape shows moderate consolidation. Leaders leverage scale to underwrite multipronged pipelines, global clinical networks, and capital-intensive manufacturing upgrades. Gilead-owned Kite Pharma expanded capacity with a 67,000-ft² modular plant that supports automated closed processing, cutting release testing from 13 to seven days. Novartis deepened its autologous cell-therapy expertise while simultaneously licensing allogeneic platforms to diversify risk.
Strategic differentiation pivots on speed and reliability. Firms integrating robotic cell-culture clusters report 30% labor savings and higher batch reproducibility. Others pursue trispecific antibodies that engage dual B-cell antigens plus CD3, potentially overcoming antigen-loss relapse. T-cell malignancy portfolios attract venture funding because competitive whitespace remains comparatively uncrowded.
Partnering activity intensifies: manufacturing technology specialists enter long-term supply deals, and diagnostics companies co-develop biomarker assays that secure companion-diagnostic approvals. These alliances create high switching costs and protect incumbents from price-only competition, underpinning profitability even as additional participants enter the Non-Hodgkin lymphoma therapeutics market.
Non-Hodgkin Lymphoma Therapeutics Industry Leaders
-
AstraZeneca PLC
-
Bayer AG
-
F. Hoffmann La-Roche Ltd
-
Seagen Inc
-
Gilead Sciences Inc. / Kite Pharma
- *Disclaimer: Major Players sorted in no particular order
Non-Hodgkin Lymphoma Therapeutics Market Companies Covered in this Report
- Roche
- Novartis
- Gilead Sciences Inc. / Kite Pharma
- Bristol-Myers Squibb
- Seagen
- Takeda Pharmaceuticals
- AstraZeneca
- Janssen Biotech / Johnson & Johnson
- BeiGene Ltd.
- Genmab
- Regeneron Pharmaceuticals
- ADC Therapeutics
- Incyte Corp.
- Eli Lilly and Company
- Bayer
- Amgen
- Abbvie
Read Analysis of Non-Hodgkin Lymphoma Therapeutics Companies
Market Opportunities and Future Outlook
A major opportunity lies in expanding effective options for relapsed or refractory B-cell NHL using new mechanisms and combination regimens that reduce dependence on autologous manufacturing. Evidence from regulatory actions and company programs points to active whitespace for outpatient-ready immunotherapies and next-generation payloads: AbbVie secured European Commission approval in July 2026 for Tepkinly (epcoritamab) plus lenalidomide and rituximab in relapsed or refractory follicular lymphoma, reinforcing the commercial pathway for bispecific-led combinations in B-cell disease. In parallel, Daiichi Sankyo initiated first-in-human phase 1/2 development in February 2026 for DS3790, a CD37-directed DXd ADC, signaling continued modality expansion beyond CD19 and CD20 and creating options where resistance or intolerance limits current regimens.
A second whitespace is improving access and throughput for cellular therapy by moving from bespoke autologous workflows toward scalable approaches, including allogeneic platforms and process automation that tighten vein-to-vein constraints. CARsgen reported allogeneic CAR-T data for relapsed or refractory B-cell NHL at EHA 2026 and outlined phase 1b trial initiation plans within 2026, reinforcing industry movement toward off-the-shelf constructs that can reduce manufacturing bottlenecks and referral friction. Real-world evidence and outcomes-linked reimbursement models, already visible in parts of North America and Europe in the current report context, also provide a practical route to broaden adoption of premium-priced immunotherapies by tying payment to measurable patient outcomes rather than relying solely on list-price concessions.
Recent Industry Developments in Non-Hodgkin Lymphoma Therapeutics Market
- June 2026: Roche reported that the FDA accepted a supplemental Biologics License Application for a subcutaneous formulation of Lunsumio VELO (mosunetuzumab) in combination with Polivy (polatuzumab vedotin) for relapsed or refractory large B-cell lymphoma. The filing supports outpatient administration and expands treatment settings for bispecific-based regimens, reinforcing Roche's leadership in CD20xCD3 combinations.
- December 2025: Roche announced FDA approval of the subcutaneous formulation of Lunsumio VELO (mosunetuzumab) for adults with relapsed or refractory follicular lymphoma after two or more lines of systemic therapy. Subcutaneous dosing supports broader site-of-care flexibility and strengthens Roche's positioning in CD20xCD3 bispecific therapy as payers and providers evaluate total episode burden alongside efficacy.
- June 2024: Roche disclosed positive Phase III STARGLO results showing an overall survival benefit for Columvi (glofitamab) plus gemcitabine and oxaliplatin versus R-GemOx in relapsed or refractory diffuse large B-cell lymphoma. The readout elevates the role of bispecific-antibody combinations as a chemo-immunotherapy backbone alternative in salvage settings and informs regimen selection where transplant and CAR-T pathways are constrained.
Non-Hodgkin Lymphoma Therapeutics Market Report Scope and Research Methodology
Market Definition and Coverage
This market covers the value of prescription therapies used to treat non-Hodgkin lymphoma across care settings, counted as manufacturer level drug revenues. It is aligned to how therapies are used by subtype and line of treatment.
Scope exclusions: diagnostics, imaging, supportive care drugs used mainly for side effect management, and non-therapeutic hospital services are excluded.
Segments Covered in This Report
- By Therapy Type
- Chemotherapy
- Radiation Therapy
- Targeted Therapy
- Immunotherapy (incl. CAR-T, Bispecifics)
- Other Therapies
- By Cell Type
- B-cell Lymphomas
- T-cell Lymphomas
- By Treatment Line
- First-line
- Second-line
- Third-line & Refractory
- By Geography
- North America
- United States
- Canada
- Mexico
- Europe
- Germany
- United Kingdom
- France
- Italy
- Spain
- Rest of Europe
- Asia-Pacific
- China
- Japan
- India
- Australia
- South Korea
- Rest of Asia-Pacific
- Middle East and Africa
- GCC
- South Africa
- Rest of Middle East and Africa
- South America
- Brazil
- Argentina
- Rest of South America
- North America
Data Sources, Market Sizing, and Validation
Desk Research
Desk research was used to build the NHL disease and treatment context, and to anchor model inputs that can be observed publicly. We reviewed sources such as the World Health Organization, the International Agency for Research on Cancer, US NIH and NCI publications, the US CDC, and peer-reviewed clinical journals to understand incidence, subtype mix, and treatment pathway shifts.
On the market side, we relied on public company filings, investor presentations, product labels, and regulatory and reimbursement updates to track launches, label expansions, and pricing direction. Where helpful, we also referenced paid subscriptions for company financial intelligence and patent databases to sanity check pipeline progress and timing signals. This desk source list is illustrative only, and other public and paid sources were also used for collection, validation, and clarification.
Primary Interviews and Surveys
Primary work focused on oncology and hematology experts, hospital pharmacists, payers, and industry participants who monitor therapy adoption and access. These interviews were used to validate line-of-therapy splits, assess uptake curves for newer immunotherapies, and clarify how treatment choices differ for B-cell versus T-cell disease across APAC, EMEA, and the Americas.
Distribution of primary research fieldwork respondents
| Company type | Respondent position | Region |
|---|---|---|
| Top tier: 38% | CXOs: 14% | APAC: 38% |
| Mid tier: 43% | Functional/Unit leaders: 31% | EMEA: 36% |
| Smaller Players: 19% | Managers: 55% | Americas: 26% |
Market-Sizing & Forecasting
Sizing starts with a top-down build that reconstructs the treated demand pool by geography, then applies therapy and line-of-treatment splits to translate patients into revenue by class. To keep totals grounded, we corroborate the result with selective bottom-up approximations, such as sampled brand sales run rates where disclosed, price per course proxies, and channel checks with hospitals and specialty pharmacies. These checks are then used to adjust outliers.
Key inputs in the model include NHL incidence and diagnosed pool trends, B-cell versus T-cell share, treated rate by line of therapy, regimen mix shifts toward targeted therapies and immunotherapy, and the timing of label expansions that broaden eligible patients. Pricing assumptions use a simple ASP progression logic that reflects expected list price stability and the net impact of payer pressure, generics, and competitive alternatives. Forecasts are produced using scenario analysis, where adoption curves and access assumptions are stress-tested with primary feedback before the final path is chosen.
Data Validation & Update Cycle
Outputs are checked against independent signals, including therapy class mix, expected patient volumes, and known inflection points such as launches and major guideline updates. When a variance is seen at a country or class level, assumptions are revisited. Respondents are re-contacted if the gap appears tied to access, dosing duration, or pricing.
A multi-step analyst review is followed before sign-off so inconsistencies are identified early and corrected with clear documentation. The report is refreshed annually, with interim updates when material events occur, including approvals, safety warnings, or meaningful pricing shifts. Before delivery, a final pass is completed so the published view reflects the latest available information.
Mordor Intelligence's Non Hodgkins Lymphoma Therapeutics Market Estimate Compared With Other Published Estimates
Published market sizes for non-Hodgkin lymphoma therapeutics can differ even when sources describe the same disease, because boundaries and counting rules are not always consistent. Differences typically come from what is included as therapy revenue, how lines of treatment are handled, and whether pricing is modeled using list price or closer to net realized levels.
By tracking treated patient pools by line of therapy, checking therapy class mix against guideline practice, and refreshing pricing timing assumptions, Mordor Intelligence keeps the 2025 value tied to observable adoption and access patterns, rather than broad oncology spend categories. Gaps also show up when some estimates include adjacent services (such as diagnosis and monitoring) or assume aggressive uptake for CAR-T and newer immunotherapies without confirming capacity and reimbursement constraints across regions.
Benchmark comparison
| Source | Market Size | Gaps in Research Methodology |
|---|---|---|
| Mordor Intelligence | USD 11.15 B (2025) | |
| Global Consultancy A | USD 11.59 B (2025) | Uses a treatment market framing that can apply higher revenue weighting to immunotherapy and may assume faster uptake without consistently separating eligible patients by line of therapy and access limits. |
| Industry Publisher B | USD 9.73 B (2025) | Often applies a narrower revenue capture for newer modalities and may simplify regimen duration and net price effects, which can compress totals when high-cost therapies are under-counted. |
The spread across sources mainly reflects how eligibility, duration of therapy, and pricing progression are treated in each model, not a disagreement that the market is growing. Our approach stays repeatable because it links revenue back to clear patient flow and therapy mix steps, which makes it easier for buyers to map assumptions to their own planning.
Key Questions Answered in the Report
How large is current global spending on Non-Hodgkin lymphoma therapeutics?
Global spending equals USD 11.93 billion in 2026 and will rise to USD 16.69 billion by 2031 at a 6.96% CAGR.
Which treatment modality is growing fastest after multiple relapses?
Immunotherapy, particularly CAR-T and bispecific antibodies, is advancing at 8.16% CAGR in third-line and refractory settings.
Why is Asia-Pacific the most attractive expansion region?
Accelerating regulatory timelines, domestic cell-therapy manufacturing, and expanding insurance coverage propel an 8.63% CAGR through 2031.
What limits broader adoption of CAR-T therapy?
High acquisition cost above USD 400,000 and severe adverse events such as cytokine release syndrome restrict access to accredited centers.
Which cell subtype offers the greatest unmet opportunity?
T-cell lymphoma shows an 7.93% CAGR with few approved options, presenting whitespace for targeted and cell-based approaches.