Market Overview
| Study Period | 2018 - 2031 |
|---|---|
| Forecast Data Period | 2026 - 2031 |
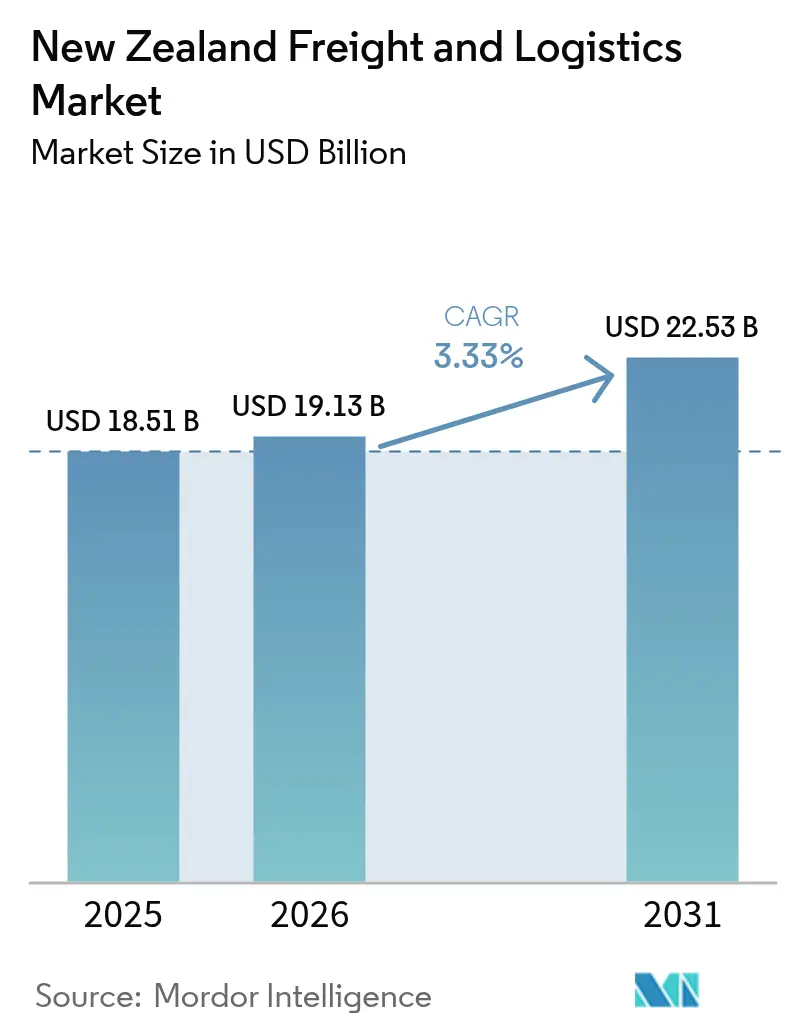
| Base Year Market Size (2025) | USD 18.51 Billion |
| Market Size (2026) | USD 19.13 Billion |
| Market Size (2031) | USD 22.53 Billion |
| Growth Rate (2026 - 2031) | 3.33% CAGR |
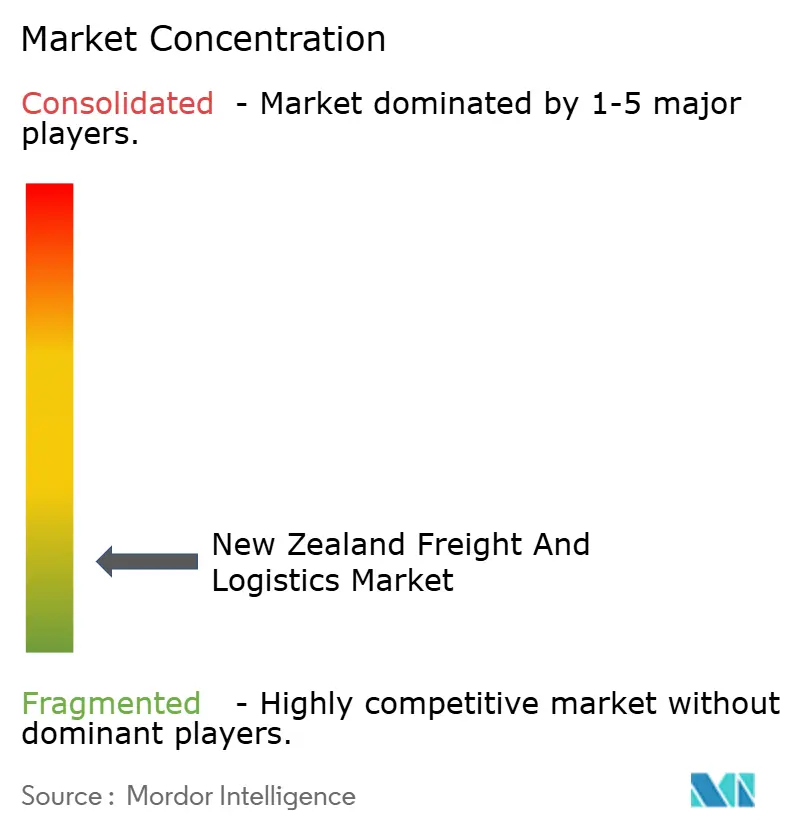
| Market Concentration | Low |
Major Players *Disclaimer: Major Players sorted in no particular order Image © Mordor Intelligence. Reuse requires attribution under CC BY 4.0. | |
New Zealand Freight And Logistics Market Analysis by Mordor Intelligence
The New Zealand freight and logistics market size in 2026 is estimated at USD 19.13 billion, growing from 2025 value of USD 18.51 billion with 2031 projections showing USD 22.53 billion, growing at 3.33% CAGR over 2026-2031. Robust infrastructure spending, fast-rising e-commerce volumes, and a renewed policy focus on supply-chain resilience keep the growth trajectory firmly positive for the New Zealand freight and logistics market. Continuous digitalization of warehousing, rising adoption of multimodal solutions, and the country’s farm-to-port export orientation collectively underpin demand for dependable freight services. At the same time, carbon-reduction targets and new modal‐shift incentives are triggering investment in rail and coastal shipping capacity, nudging the New Zealand freight and logistics market toward lower-emission transport mixes. Although the sector remains fragmented, recent high-profile mergers and rising automation capex signal the entrance of a more efficiency-driven competitive phase.
Key Report Takeaways
- By logistics function, freight transport led with 64.78% of New Zealand's freight and logistics market share in 2025; Courier, Express and Parcel (CEP) services are forecast to advance at a 3.92% CAGR between 2026-2031.
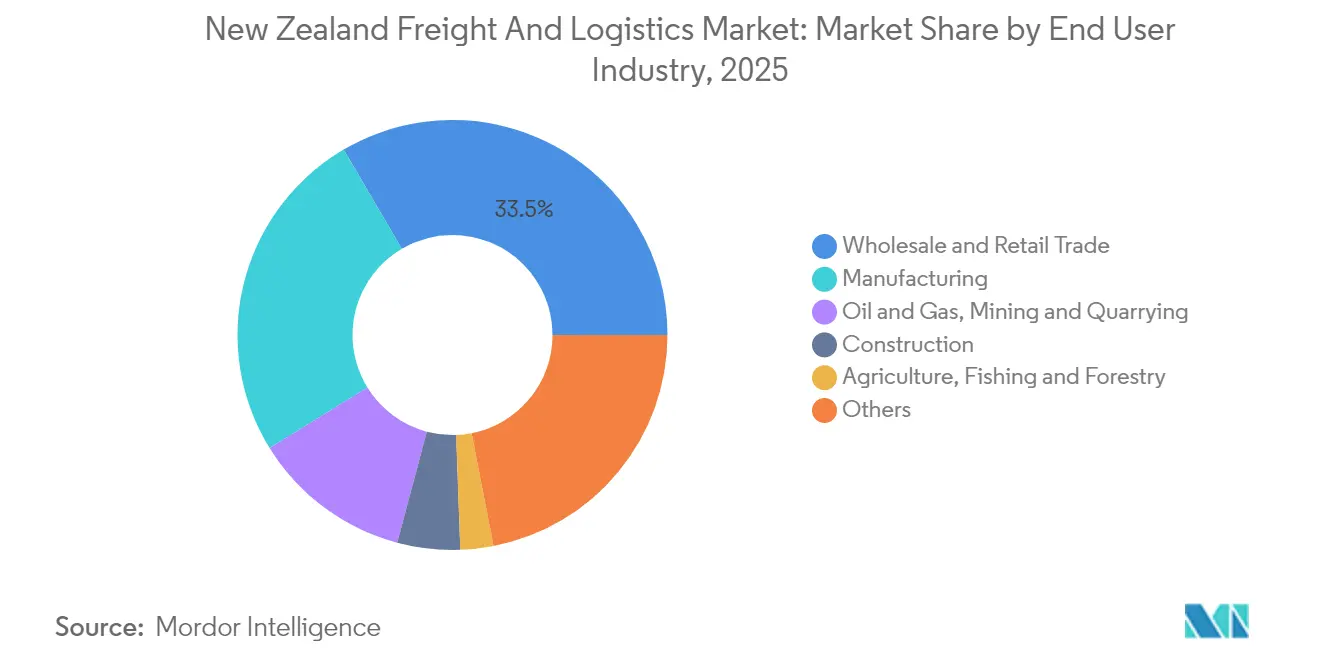
- By end user industry, wholesale and retail trade commanded 33.45% share of the New Zealand freight and logistics market size in 2025, while manufacturing is projected to grow at 3.95% CAGR between 2026-2031.
- By CEP type, domestic parcels accounted for a 62.52% revenue share in 2025; international parcels are expected to expand at a 4.03% CAGR between 2026-2031.
- By freight forwarding mode, sea and inland waterways handled 68.62% revenue share in 2025; air freight forwarding is projected to register the fastest 3.90% CAGR between 2026-2031.
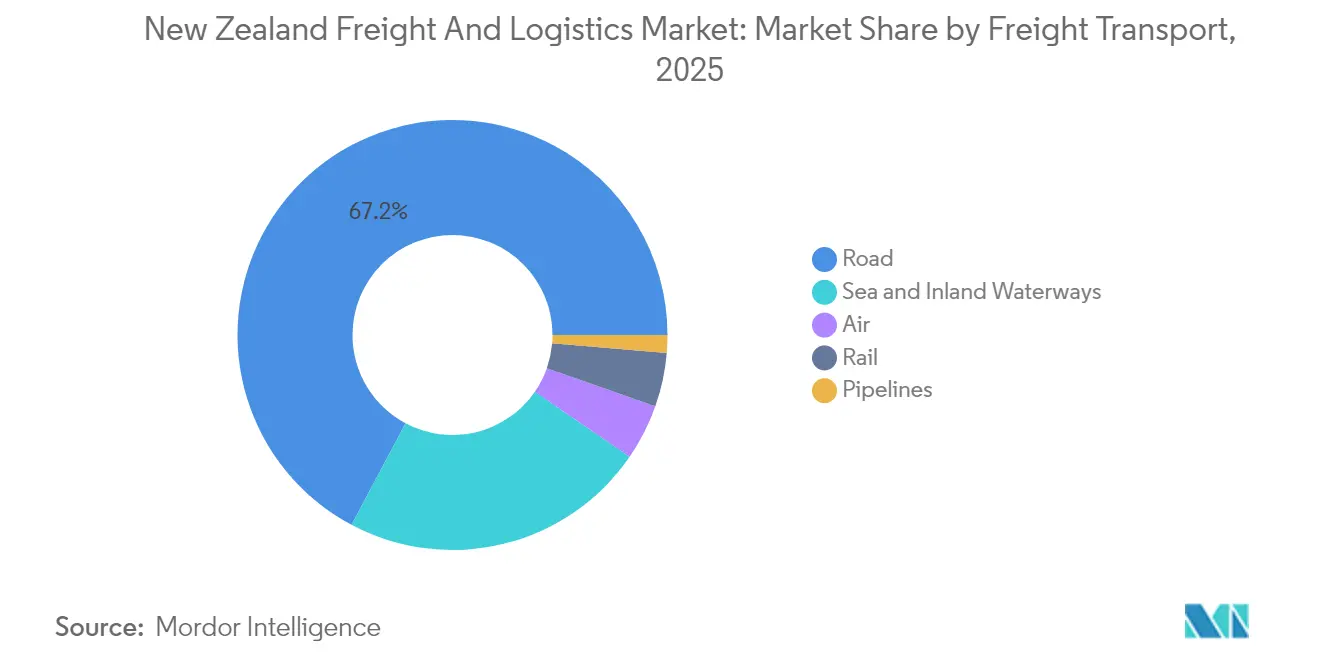
- By freight transport mode, road freight transport retained a 67.22% revenue share in 2025, whereas air freight transport is projected for a 4.29% CAGR between 2026-2031.
- By warehousing and storage, non-temperature controlled space represented 91.32% revenue share in 2025; temperature controlled facilities are expected to advance at a 3.84% CAGR between 2026-2031.
Note: Market size and forecast figures in this report are generated using Mordor Intelligence’s proprietary estimation framework, updated with the latest available data and insights as of 2026.
New Zealand Freight And Logistics Market Trends and Insights
Drivers Impact Analysis*
| Driver | (~) % Impact on CAGR Forecast | Geographic Relevance | Impact Timeline |
|---|---|---|---|
| Climate resilience and infrastructure adaptation initiatives driving growth | +0.8% | Auckland, Wellington, Christchurch | Short term (≤ 2 years) |
| Government’s NZD 7 billion (~USD 4.65 billion) p.a. transport infrastructure in pipeline | +1.2% | Nationwide; Auckland-Hamilton-Tauranga corridor | Medium term (2-4 years) |
| Diversification of agri-food export trade lanes witnessed | +0.4% | Canterbury, Waikato, Bay of Plenty | Long term (≥ 4 years) |
| Rapid adoption of warehouse automation and digital freight platforms | +0.6% | Major urban centers | Medium term (2-4 years) |
| Cook Strait resilience push driving multimodal growth | +0.3% | North-South Island connectivity | Long term (≥ 4 years) |
| Carbon-pricing accelerating shift to rail and coastal shipping | +0.2% | Nationwide | Long term (≥ 4 years) |
| Source: Mordor Intelligence | |||
Climate Resilience and Infrastructure Adaptation Initiatives Driving Growth
The National Adaptation Plan compels every large transport project to embed climate-risk criteria, elevating resilience from a design option to an approval prerequisite[1]“National Adaptation Plan,” Ministry for the Environment, environment.govt.nz. Auckland’s 2023 floods underscored the economic cost of route closures and port downtime, pushing private operators to invest in redundant capacity and elevated facility designs. Port of Tauranga has retrofitted cargo-handling areas with flood-resistant equipment, safeguarding berth productivity during storm surges. Insurance premiums on exposed assets are climbing, thereby incentivizing logistics firms to accelerate protective capital expenditure. The cumulative effect is a measurable improvement in network uptime and a shift toward asset-light contingency services able to route freight around climate-affected corridors.
Government's NZD 7 Billion (~USD 4.65 Billion) Transport Infrastructure in Pipeline
The 2025 Budget allocates NZD 6.8 billion (USD 4.3 billion) to logistics-relevant projects, including NZD 464 million (USD 293 million) earmarked for rail track renewal in the Auckland and Wellington corridors[2]“Investing in infrastructure for all New Zealanders,” New Zealand Government, beehive.govt.nz. Grade-separated highways under the Roads of National Significance program ease heavy-vehicle congestion, lowering operating costs and pushing payload efficiency higher. Integrated nodes such as the NZD 1.5 billion (USD 0.95 billion) Melling project bundle freight access and public-transport provisions into single schemes, shortening project lead times and amplifying network capacity[3]“Melling transport improvements to start this year,” New Zealand Government, beehive.govt.nz. Collectively, the pipeline is expected to shave transit times on critical corridors by up to 15%, directly supporting New Zealand's freight and logistics market competitiveness. Private operators, encouraged by clearer forward workstreams, have accelerated fleet renewal, with a noticeable uptick in low-emission truck orders.
Diversification of Agri-Food Export Trade Lanes Witnessed
Heightened geopolitical risk and changing consumer demand patterns are prompting exporters to widen destination portfolios beyond traditional East-Asian and North-American buyers. Container throughput at Port of Tauranga climbed 17% in 2024 to 292,860 TEUs, with emerging Southeast-Asian lanes contributing the bulk of incremental volumes. Cold-chain demand is rising in parallel; specialized storage capacity is witnessing a near-4% annual run-rate as high-value horticultural and premium meat exports proliferate. Exporters are adopting traceability tech and smart packaging, boosting demand for data-ready logistics services that can guarantee provenance and cold-chain integrity during longer voyages.
Rapid Adoption of Warehouse Automation and Digital Freight Platforms
Labor shortages and e-commerce order spikes have turbocharged automation investment. AS Colour’s Multishuttle deployment generated a 344% productivity gain, validating high-throughput goods-to-person models. Cardinal Logistics’ new ASRS site lifted order output fourfold while improving safety metrics. Payback periods are shortening as capital costs fall and financing solutions multiply. Parallel growth in digital freight marketplaces is expanding spot-rate transparency and dynamic routing options, allowing smaller shippers to secure capacity previously available only to larger accounts. Data-driven operations are therefore narrowing the efficiency gap between large and mid-tier market participants.
Restraints Impact Analysis*
| Restraint | (~) % Impact on CAGR Forecast | Geographic Relevance | Impact Timeline |
|---|---|---|---|
| Geographic isolation inflating ocean freight costs in New Zealand | -0.5% | Nationwide | Long term (≥ 4 years) |
| Driver shortage and ageing workforce impacting market efficiency | -0.4% | Auckland, Canterbury | Short term (≤ 2 years) |
| Rising insurance premiums after climate-event losses | -0.2% | Flood-prone regions | Medium term (2-4 years) |
| Volcanic and seismic disruption risk to key logistics hubs | -0.1% | Auckland, Wellington, Canterbury | Long term (≥ 4 years) |
| Source: Mordor Intelligence | |||
Geographic Isolation is Inflating Ocean Freight Costs
Being 1,800 km from its nearest major neighbor, New Zealand relies on ocean transport for 99% of trade by volume. Limited carrier competition and long transit times hardwire higher freight expenditure into supply chains, eroding margin headroom for exporters. New mega-alliances formed in 2025 now control around 80% of global container capacity, making rate volatility and capacity rollovers more acute for New Zealand shippers. Container imbalances linked to export-heavy flows further raise repositioning costs, while schedule recovery options remain scarce. The cumulative effect trims forecast growth for the New Zealand freight and logistics market by half a percentage point.
Driver Shortage and Aging Workforce Impacting Market Efficiency
Road freight transport, which still moves 67.95% of freight by value in 2024, faces an acute driver deficit as the average driver age tops 60 years, and fewer than 7% of drivers are under 25. Even after licensing reforms eliminated secondary practical tests, recruitment remains slow. Wage inflation and sporadic service disruptions elevate delivery costs and dampen the reliability metrics crucial for just-in-time inventory models. Fleet operators are responding with telematics-enabled safety programs and automation pilots, yet near-term labor tightness continues to cap capacity growth.
*Our forecasts treat driver/restraint impacts as directional, not additive. The impact forecasts reflect baseline growth, mix effects, and variable interactions.
Segment Analysis
By End User Industry: Retail Trade’s Scale Meets Manufacturing’s Momentum
Wholesale and retail trade contributed 33.45% of the New Zealand freight and logistics market size in 2025, reflecting the growing intricacy of omnichannel distribution networks and nationwide consumer penetration. E-commerce parcel counts surpassed 190 million in 2024 on NZ Post’s network expansions, adding last-mile density and driving warehouse localization strategies. Inventory repositioning nearer to urban clusters improved order cycle times but increased the number of intra-city freight movements, elevating CEP demand. The food retail subset links directly to cold-chain investments, encouraging cross-segment collaborations in warehousing and refrigerated transport.
Manufacturing, albeit a smaller contributor in 2025, is expected to register the market’s swiftest 3.95% CAGR expansion between 2026-2031. Government incentives for advanced manufacturing and value-added food processing are lifting the outbound tonnage of processed goods that command premium freight services. Automation in production lines mirrors warehouse digitization, requiring synchronized logistics scheduling to capture efficiency gains. Suppliers are adopting vendor-managed inventory programs, causing freight flows to become more predictable yet more time-sensitive. As policy shifts encourage higher local value capture, freight intensity per dollar of output is rising, deepening the sector’s engagement with the New Zealand freight and logistics market.


By Logistics Function: Freight Transport Dominance Under E-commerce Pressure
Freight Transport retained 64.78% of New Zealand's freight and logistics market share in 2025, anchored by bulk movement of goods to ports and metropolitan distribution hubs. Price-sensitive exporters continue to rely on full-truckload and intermodal solutions that combine road and sea legs, benefiting operators capable of orchestrating integrated networks. Road-to-port shuttles remain the linchpin, yet modal diversification is gathering pace as carbon-pricing reorders cost hierarchies.
Courier, Express and Parcel activity, however, is expected to advance at 3.92% CAGR (2026-2031), absorbing surging B2C volumes and rising SME cross-border export transactions. Automated sorting hubs with hourly throughputs above 30,000 parcels exemplify the scale of investment now flowing into CEP infrastructure. Competitive differentiation revolves around delivery-time guarantees and real-time visibility dashboards, compelling incumbents to partner with digital platforms and fine-tune last-mile routing algorithms. The dual speed of freight growth is thereby reshaping the revenue mix for integrated logistics providers that straddle multiple service silos.
By Courier, Express, and Parcel (CEP): Domestic Networks, Anchor International Upside
Domestic CEP services captured a 62.52% revenue share in 2025, driven by a dispersed population and the cost advantages of centralized processing. Rural delivery remains a structural challenge, prompting fleet allocations of smaller vans and drone-delivery trials for remote areas. Service providers balance coverage obligations against profitability by employing zonal pricing and rural delivery days.
International CEP, buoyed by marketplace integrations that simplify customs paperwork, is forecast to post a 4.03% CAGR (2026-2031), eclipsing domestic growth rates. Enhanced offerings such as FedEx International Connect Plus provide 1-3-day delivery to Europe, unlocking higher-margin lanes. Regulatory harmonization through trade agreements is loosening friction, yet capacity management at origin gateways remains critical during peak export seasons. Providers capable of aligning outbound parcel flows with inbound returns are well-positioned to capture scale efficiencies as international volumes rise.
By Warehousing and Storage: Non-Temperature Controlled Dominates, but Temperature Controlled Grows
Non-temperature controlled made up 91.32% of the segment revenue in 2025. Third-party logistics providers continue to automate pallet handling and deploy ASRS to compress operating costs and raise reliability. The New Zealand freight and logistics market benefits from these productivity gains as service quality lifts without proportional headcount growth.
Temperature controlled warehousing, projected to expand at a 3.84% CAGR (2026-2031), is riding a surge in premium dairy, meat, and horticultural exports, alongside heightened pharmaceutical storage needs. Alliance Group’s NZD 16 million (USD 10.1 million) automation retrofit demonstrates the capital committed to maintaining quality across longer global journeys. Sensor-based monitoring and traceability mandates elevate the technological bar, rewarding operators who integrate real-time temperature analytics into standard workflows.
By Freight Transport: Road Freight Transport Hegemony Faces Modal-Shift Incentives
Road freight transport handled 67.22% of the revenue share in 2025, with per-ton-km pricing at USD 0.194 in 2024. Network density and door-to-door flexibility keep roads indispensable, especially for intra-island distribution. Yet escalating driver shortages and carbon taxes are chipping away at its cost advantage. Fleet operators are piloting alternative fuels and advanced driver-assistance systems to curb emissions and mitigate labor gaps.
Air freight transport leads growth at 4.29% CAGR (2026-2031), catalyzed by time-critical export demand and cross-border e-commerce imports. Rate differentials versus sea freight are narrowing for select high-value commodities, spurring modal conversion. Rail and coastal shipping are acquiring a new share as carbon-pricing tilts total landed cost calculations. KiwiRail’s data shows avoidance of 229,000 tons of CO₂ emissions in the first half of 2024, supporting corporate ESG scorecards. Multimodal route planners, therefore, are recalibrating mode splits to capitalize on emerging incentives.
By Freight Forwarding: Sea and Inland Waterways Scale Meets Air’s Velocity
Sea and inland waterways freight forwarding accounted for 68.62% of the segment revenue share in 2025 as exporters leveraged favorable cost per ton-km economics. Consolidation around mega-alliances signals more standardized service windows, yet smaller shippers still face equipment availability challenges on backhaul legs. Value-added services, including origin consolidation and export documentation pre-clearance, are now table stakes for forwarders seeking to retain client stickiness.
Air freight forwarding is projected to expand at a 3.90% CAGR (2026-2031), benefits from the premium-product thrust of agri-food and pharmaceutical exporters. Global air-cargo capacity constraints have eased since mid-2024, and forwarders with block-space agreements capture rate stability advantages. Integrated temperature-controlled handling and visibility tech are core differentiators, particularly for high-value perishables with narrow shelf-life tolerances. Growth in this segment underscores the widening service spectrum defining the New Zealand freight and logistics market.
Geography Analysis
New Zealand’s elongated dual-island topography molds freight flows into a north-south axis centered on the Auckland–Hamilton–Tauranga triangle. This corridor hosts the highest GDP density and accommodates most import flows, making it the fulcrum of the New Zealand freight and logistics market. Auckland’s constrained port footprint amplifies reliance on road shuttles to inland depots, intensifying congestion at peak periods. Planned highway upgrades and rail-freight improvements are expected to unlock latent capacity, yet land-use conflicts remain a brake on rapid expansion.
Wellington occupies a strategic midpoint role as political capital and as the Cook Strait choke-point. Ferry capacity limitations today force scheduling buffers into inter-island logistics plans, reducing asset utilization. The two newly ordered rail-capable ferries will extend deck capacity and simplify wagon transfers, enabling freight operators to treat the islands as a more contiguous network once commissioned. The change is forecast to incrementally lift the rail’s share of the New Zealand freight and logistics market.
South Island logistics revolve around Christchurch’s multimodal hub, serving primary-industry clusters across Canterbury and Otago. DHL’s carbon-neutral gateway there expands international CEP throughput to 6,500 inbound parcels per hour, underlining corporate confidence in South Island growth prospects. Port diversification strategies centered on smaller harbors such as Northport and Timaru seek to relieve pressure on Tauranga and Auckland during peak export months. Government infrastructure-resilience plans further encourage multi-port redundancy to hedge seismic and flood risks, fostering a more distributed network topology across the New Zealand freight and logistics market.
Regulatory Landscape
New Zealand’s freight and logistics ruleset is shaped by the Ministry of Transport and NZ Transport Agency Waka Kotahi (NZTA). Government direction is set through the Government Policy Statement on land transport 2024 (GPS 2024), effective 1 July 2024 for the 2024/25 to 2033/34 period. GPS 2024 sets funding priorities that affect freight corridors, notably the Auckland-Hamilton-Tauranga triangle, and it continues to emphasize rail and network resilience. It also aligns with the Aotearoa New Zealand Freight and Supply Chain Strategy (August 2023) and NZTA’s Action Plan for Freight (2024-2027).
Heavy vehicle compliance and productivity settings are being reworked under the Land Transport Rules Reform Programme. NZTA ran Phase 1 consultation in October 2025 and opened Phase 2 consultation in February 2026, with Phase 2 focused on heavy vehicle productivity settings such as permit requirements (including for some unladen/rental movements) and licensing issues for new vehicle technologies. Separately, the Regulatory Systems (Transport) Amendment Act 2025 came into force on 1 April 2026, enabling digital alternatives for transport documentation (for example, digital options for certificates of fitness). From January 2026, the Government also introduced annual Motor Vehicle Registration fee increases to support the National Land Transport Fund.
Value Chain Analysis
New Zealand’s freight and logistics value chain starts with shippers across export-led primary industries (agri-food, forestry) and domestic wholesale and retail. The flows then pass through freight forwarders and shipping lines, ports and airports, inland freight hubs, and linehaul carriers (road, rail, coastal), before moving into 3PL/4PL providers, warehouses (ambient and cold chain), and last-mile CEP networks. Sea freight supports the import-export backbone, while domestic distribution remains road-dominant. Intermodal nodes and inland ports are used to consolidate containers and reduce port-area congestion. Digital orchestration layers increasingly cut across the chain, including freight management, booking/visibility, and cargo pooling platforms.
Participants include large integrators and specialists, such as Kotahi Logistics LP (cargo pooling and ocean freight solutions), Coda Group (freight management with intermodal road-rail integration), and Nexus Logistics (4PL container logistics and freight hub networks). The Aotearoa New Zealand Freight and Supply Chain Strategy (August 2023) and GPS 2024 drive the system toward more coordinated, data-driven investment across road, rail, and maritime links. Bottlenecks persist around port connectivity and network fragmentation, and industry commentary in 2025 pointed to port inefficiencies as a risk to export competitiveness. That view reinforces the case for stronger hub-and-spoke connectivity and better end-to-end data for capacity planning and disruption management.
Competitive Landscape
International forwarders and domestic carriers share a moderately fragmented arena where technology adoption differentiates performance. DSV’s EUR 14.3 billion (USD 15.8 billion) purchase of DB Schenker vaults the Danish group to global leadership and fortifies its presence in air and sea lanes serving New Zealand. Such scale advantages allow deeper digital investments, from AI-driven booking engines to predictive ETA models, elevating service expectations across the market.
Local champion Mainfreight retains niche strengths in integrated trans-Tasman services but reported a profit dip in 2024 as wage inflation and automation capex weighed on margins. Domestic road specialists are responding with fleet connectivity upgrades and driver-wellness programs to stem attrition. Automation pioneers such as Cardinal Logistics showcase the productivity leap attainable with ASRS, narrowing the cost gap against scale challengers.
Sustainability emerges as a competitive axis. Operators highlighting low-carbon transit modes and verifiable emissions reporting gain traction with export clients subject to Scope 3 disclosure. CMA CGM’s AI partnership with Google exemplifies how carriers seek digital solutions to optimize routing and cut fuel burn. Altogether, technology convergence and environmental mandates are pushing the New Zealand freight and logistics market toward a more capability-driven hierarchy.
New Zealand Freight And Logistics Industry Leaders
Mainfreight, Ltd.
DHL Group
Japan Post Co., Ltd. (Including Toll Group)
KiwiRail Holdings, Ltd.
DSV A/S (Including DB Schenker)
- *Disclaimer: Major Players sorted in no particular order

Market Opportunities and Future Outlook
Intermodal freight hubs and inland port capacity are a clearer investment whitespace as New Zealand looks to decongest seaport-adjacent networks and improve North-South and regional connectivity. In June 2026, the Government approved USD 22.4 million (NZD 22.4 million) in Regional Infrastructure Fund loans for the rail component of the Te Utanganui freight hub in Palmerston North, covering pre-construction and construction stages. This creates a tangible pipeline for rail-linked logistics real estate and terminal services. Activity around other hubs, such as the Southern Link Inland Port near Mosgiel (involving Port Otago and Dynes Transport, with plans that include large-scale warehousing and a container terminal), also supports opportunities for 3PL/4PL operators, container logistics specialists, and road-rail transfer services centered on inland nodes.
A second opportunity lane is built around data and productivity initiatives, particularly network visibility, compliance digitization, and heavy-vehicle efficiency. The Government’s October 2025 three-part freight initiative (NZTA Action Plan for Freight 2024-2027, reinstatement of the National Freight Demand Study, and formation of a Freight Advisory Council) elevates freight data as an input to investment decisions and travel-time predictability. That shift can benefit digital freight platforms and control-tower style services. On-road operating economics are also at an inflection point, as the Land Transport Rules Reform Programme consultations (Phase 1 in October 2025 and Phase 2 in February 2026) and the introduction of digital transport documentation from 1 April 2026 reduce frictional cost and create room for fleet compliance, permitting, and telematics solutions. In parallel, automation-led capacity additions in warehousing and CEP lift demand for integrated linehaul, sortation-adjacent transport, and time-definite delivery capabilities.
Recent Industry Developments
- May 2026: Toll Group renewed a five-year agreement to provide integrated 3PL services for Foot Locker across Australia and New Zealand, including an expanded operational footprint into New Zealand. The extension strengthens contract logistics density in the ANZ retail supply chain and supports larger-scale, multi-site warehousing and transport coordination for time-sensitive store replenishment and e-commerce flows.
- September 2025: DHL Express announced annual price adjustments for its New Zealand services for 2026, effective from 1 January 2026. The update signaled active yield management in international express amid changing operating costs, influencing shipper lane selection, service-tier mix, and CEP pricing strategies across the market.
- November 2024: DHL Express started development of an 8,500 sq m gateway facility at Christchurch International Airport with capacity for up to 6,500 inbound and 5,600 outbound parcels per hour. The project adds processing headroom and screening capability in the South Island, supporting faster international CEP flows and providing shippers a stronger alternative gateway outside Auckland-centric routing.


Research Methodology Framework and Report Scope
Market Definition and Coverage
For this study, the New Zealand freight and logistics market is defined as the revenue earned from moving, handling, and storing physical goods across domestic and international lanes, including freight transport, freight forwarding, warehousing, and value-added logistics services.
Scope exclusions: Passenger transport services, pure travel and tourism activity, and personal mobility services are excluded, even if the same operators also run freight fleets.
Segmentation Overview
- End User Industry
- Agriculture, Fishing, and Forestry
- Construction
- Manufacturing
- Oil and Gas, Mining and Quarrying
- Wholesale and Retail Trade
- Others
- Logistics Function
- Courier, Express, and Parcel (CEP)
- By Destination Type
- Domestic
- International
- By Destination Type
- Freight Forwarding
- By Mode of Transport
- Air
- Sea and Inland Waterways
- Others
- By Mode of Transport
- Freight Transport
- By Mode of Transport
- Air
- Pipelines
- Rail
- Road
- Sea and Inland Waterways
- By Mode of Transport
- Warehousing and Storage
- By Temperature Control
- Non-Temperature Controlled
- Temperature Controlled
- By Temperature Control
- Other Services
- Courier, Express, and Parcel (CEP)
Data Sources, Market Sizing, and Validation
Desk Research
We start by mapping New Zealand goods movement and trade patterns using public statistics and policy sources, and then aligning them with logistics service activity. Common reference points include sources such as Stats NZ transport and national accounts tables, New Zealand Customs and trade statistics, the Ministry of Transport publications, Waka Kotahi NZ Transport Agency network data, and port and airport operator traffic releases.
To connect macro signals to market value, annual reports and investor presentations are reviewed for local operators, along with reputable news coverage on capacity additions, network changes, and pricing updates. Where needed, we also use paid subscriptions for company financials and intelligence, logistics supply chain and freight rate snapshots, and shipment-level import and export records to cross-check trade-linked volumes. The sources listed here are illustrative only, and many other references were also used to collect data, validate assumptions, and clarify open questions.
Primary Interviews and Surveys
To close gaps that desk sources cannot fully explain, we validate assumptions through expert calls and structured questionnaires with freight carriers, freight forwarders, 3PL and warehouse operators, and large shipper groups. Our coverage focuses on New Zealand domestic corridors and key trade lanes, and it is also used to sanity check rate movement, capacity utilization, and the split between outsourced logistics and in-house shipper activity.
Distribution of primary research fieldwork respondents
| Company type | Respondent position | Region |
|---|---|---|
| Top tier: 36% | CXOs: 13% | |
| Mid tier: 42% | Functional/Unit leaders: 27% | |
| Smaller Players: 22% | Managers: 60% |
Market-Sizing & Forecasting
A top-down approach is applied first, where transport and trade indicators are used to reconstruct the demand pool for freight movement and supporting logistics services across New Zealand. The output is then corroborated with selective bottom-up approximations, such as rolling up a sample of operator revenues, doing channel checks on warehousing throughput, and testing typical price per shipment or price per ton assumptions, before totals are adjusted.
Inputs that tend to matter most include seaborne container and bulk throughput at major ports, air cargo tonnage, road freight intensity proxies (fuel use and freight task trends where available), rail freight volumes, and warehousing capacity additions and occupancy direction. We also track export and import mix shifts, e-commerce parcel intensity, and diesel and labor cost pressure because these flow into freight rates and contract renewals.
For forecasting, scenario analysis is used around trade growth and domestic activity, and the resulting path is smoothed and checked against historical patterns using time-series methods such as exponential smoothing. When data is thin for smaller functions, gaps are handled by applying conservative penetration and service mix assumptions that are confirmed in interviews, and then tested for reasonableness against the full-market totals.
Data Validation & Update Cycle
Findings are validated through triangulation across macro indicators, company disclosures, and interview feedback, and then variances are reviewed until the drivers are clear. Analysts run checks for outliers like sudden rate spikes, one-off volume shocks, and currency effects, followed by a structured internal review before sign-off.
The model is refreshed on an annual cycle, and interim updates are made when material events occur, such as major policy changes, port disruptions, or sharp shifts in fuel costs. Before delivery, we do a final pass to ensure the latest public statistics and key developments are reflected in the numbers and commentary.
Mordor Intelligence's New Zealand Freight and Logistics Market Size Compared With Other Published Estimates
Published market sizes for New Zealand freight and logistics can look different because the service scope is not always defined the same way, and the base year and currency handling can also vary. Some estimates emphasize transport-only revenues, while others mix in adjacent logistics services, which makes comparisons harder to interpret.
Key gaps usually come from what is counted inside the market, how rate and volume drivers are projected, and how recently trade and throughput datasets were refreshed. When growth is pushed mainly through assumed price uplift, without checking it against fuel, labor, and contract renewal behavior, totals can move meaningfully in either direction.
Benchmark comparison
| Source | Market Size | Gaps in Research Methodology |
|---|---|---|
| Mordor Intelligence | USD 18.51 B (2025) | |
| Regional Consultancy A | USD 16.86 B (2024) | Uses an earlier base year and may not fully align warehousing and forwarding revenue with updated trade and throughput indicators, which can depress the starting market value. |
| Global Consultancy B | USD 20.00 B (2024) | Scope detail is limited, and the sizing may include adjacent items like logistics software alongside core services, which can inflate the total versus service-only revenue. |
The benchmark table shows the spread is largely explained by scope and input refresh timing, and in Mordor Intelligence's model the market is counted across freight transport plus freight forwarding, warehousing, and value-added services, with transport-only revenues not treated as the full total. With that scope pinned down, the remaining variation mostly comes from how rate progression and trade-linked volumes are applied year to year, which can be rechecked using the same public indicators.


Key Questions Answered in the Report
How large is the New Zealand freight and logistics market in 2026?
The market is valued at USD 19.13 billion in 2026 and is projected to reach USD 22.53 billion by 2031.
Which logistics function currently leads sector revenue?
Freight Transport commands a 64.78% share in 2025, reflecting the critical role of bulk and containerized moves across the country.
What segment is growing fastest through 2031?
Courier, Express, and Parcel services are forecast to grow at a 3.92% CAGR (2026-2031) as e-commerce volumes surge.
How is government infrastructure spending influencing growth?
A NZD 7 billion (USD 4.65 billion) annual pipeline is reducing transit times and boosting multimodal capacity and industry CAGR.
Why is temperature-controlled warehousing seeing investment?
Diversifying agri-food exports and tighter pharmaceutical standards are driving a 3.84% CAGR (2026-2031) in cold-chain storage demand.
What is the outlook for rail freight?
Rail gains momentum from carbon-pricing incentives and upcoming Cook Strait rail-capable ferries, reinforcing its role in a more sustainable transport mix.
Page last updated on:


