
Market Overview
| Study Period | 2020 - 2031 |
|---|---|
| Market Size (2026) | USD 311.65 Billion |
| Market Size (2031) | USD 417.88 Billion |
| Growth Rate (2026 - 2031) | 6.04 % |
| Fastest Growing Market | Asia Pacific |
| Largest Market | North America |
| Market Concentration | High |
Major Players *Disclaimer: Major Players sorted in no particular order Image © Mordor Intelligence. Reuse requires attribution under CC BY 4.0. | |
Novel Drug Delivery Systems (NDDS) Market Analysis by Mordor Intelligence
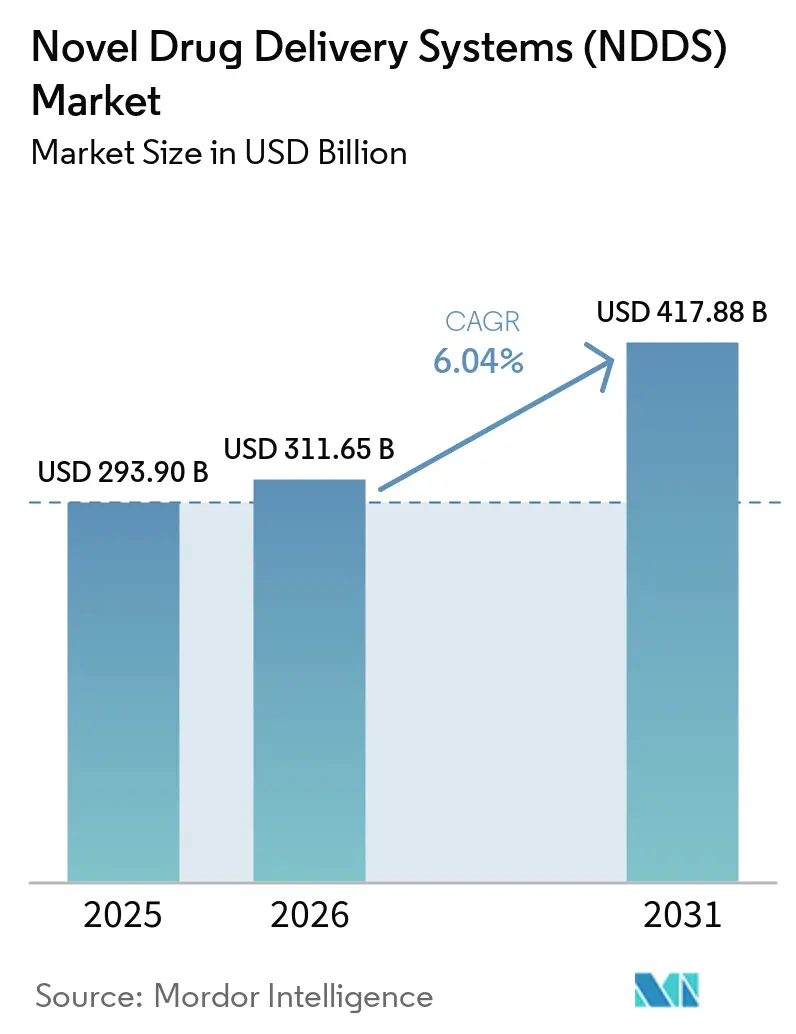
New Drug Delivery Systems market size in 2026 is estimated at USD 311.65 billion, growing from 2025 value of USD 293.9 billion with 2031 projections showing USD 417.88 billion, growing at 6.04% CAGR over 2026-2031. An acceleration in patient-centric therapeutics, the clinical shift toward biologics and gene therapies, and the convergence of connected health technologies collectively propel this trajectory. Heightened demand for self-administration devices, ongoing regulatory support for combination products, and rising ventures in smart delivery platforms sustain competitive momentum. Strategic acquisitions—such as Novo Nordisk’s purchase of Catalent—signal intensifying competition for advanced formulation know-how. Meanwhile, sustainability requirements in Europe are nudging vendors toward recyclable packaging that maintains temperature integrity.
Key Report Takeaways
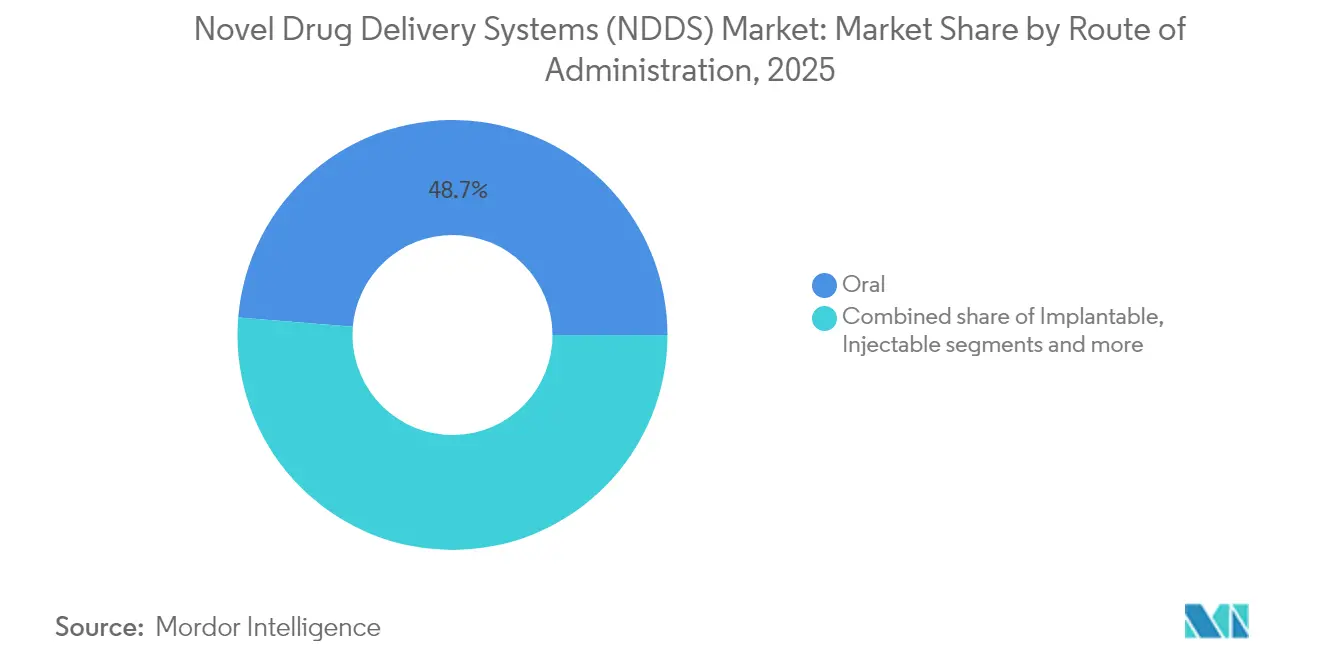
- By route of administration, oral systems led with 48.70% revenue share in 2025; implantable systems are projected to grow at a 8.72% CAGR through 2031.
- By technology, auto-injectors captured 22.05% of the New Drug Delivery Systems market size in 2025, whereas smart and connected devices are forecast to advance at 9.18% CAGR between 2026-2031.
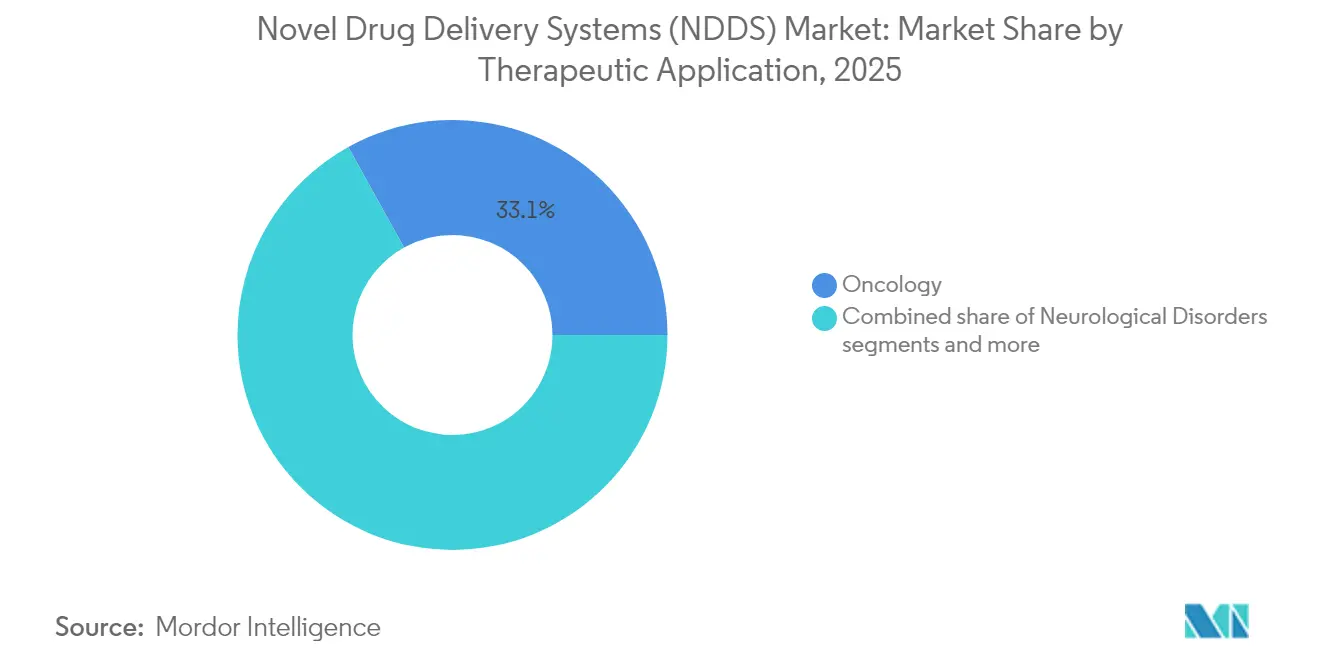
- By therapeutic application, oncology generated 33.05% share of the New Drug Delivery Systems market size in 2025, while neurological disorder applications are poised for a 9.36% CAGR through 2031.
- By end user, hospitals accounted for 53.10% of New Drug Delivery Systems market share in 2025; home-care settings are expected to expand at 10.12% CAGR over the forecast horizon.
Note: Market size and forecast figures in this report are generated using Mordor Intelligence’s proprietary estimation framework, updated with the latest available data and insights as of 2026.
Market Trends and Insights
Drivers Impact Analysis of Novel Drug Delivery Systems (NDDS) Market*
| Driver | (~) % Impact on CAGR Forecast | Geographic Relevance | Impact Timeline |
|---|---|---|---|
| Rising prevalence of chronic diseases | +1.5% | Global, with highest impact in North America & Europe | Medium term (2-4 years) |
| Growing adoption of biologics & large-molecule drugs | +2.1% | North America & EU leading, APAC accelerating | Long term (≥ 4 years) |
| Digital-therapeutic integration enabling smart delivery | +1.8% | North America & EU core, spill-over to APAC | Short term (≤ 2 years) |
| Expansion of mRNA / gene-therapy pipelines | +1.2% | North America & EU, selective APAC markets | Long term (≥ 4 years) |
| Patient preference for self-administration & home care | +0.9% | Global, accelerated in developed markets | Medium term (2-4 years) |
| Decarbonization push favoring long-acting formulations | +0.7% | EU leading, North America following, APAC emerging | Long term (≥ 4 years) |
| Source: Mordor Intelligence | |||
Rising Prevalence of Chronic Diseases
Cardiovascular and diabetic conditions affected more than 1.23 billion people globally in 2024 and continue to swell clinical demand for sustained-release therapies that reduce dosing frequency[1]. Long-acting platforms such as the intravesical TAR-200 device illustrate this shift, delivering gemcitabine continuously over multiple months and achieving median response duration of 25.8 months, markedly higher than intermittent regimens. Government initiatives to manage diabetes and cardiovascular disease intensify demand for long-acting patches in rural areas, boosting the transdermal drug delivery systems market. Regulators respond with guidance that favors integrated drug–device products able to improve adherence, reinforcing investment in implantable and transdermal formats.
Growing Adoption of Biologics & Large-Molecule Drugs
Escalation in monoclonal antibodies and RNA-based therapeutics elevates formulation complexity and stimulates nanoparticle innovation. Pfizer’s ponsegromab trial underscores the benefit—optimized delivery improved performance in cancer cachexia patients. Vendors consequently expand lipid nanoparticle capacity; Lonza added multiple dedicated suites in 2025 to ease supply shortages. Cold-chain logistics and patient ease-of-use remain critical, widening prospects for temperature-controlled packaging and self-injecting wearables.
Digital-Therapeutic Integration Enabling Smart Delivery
Connected devices advance from passive dispensing toward continuous data capture. Global revenue for smart delivery systems approached USD 12 billion in 2024. FDA cybersecurity guidelines released in 2024 impose secure-by-design requirements, prompting early-stage redesigns but ensuring long-term patient safety[2]. Artificial intelligence embedded in injectors and inhalers now supports algorithm-directed dose titration.
Expansion of mRNA / Gene-Therapy Pipelines
More than 200 gene-therapy trials launched in 2024, accentuating the bottleneck in vector and LNP capacity. Cytiva, Lonza and other suppliers committed multi-million-unit plants to satisfy projected demand to 2030. Tissue-targeting challenges and immunogenicity concerns sustain R&D in novel capsids and biodegradable carriers, while regulatory agencies maintain rigorous safety thresholds for viral or non-viral vectors. The Non-viral drug delivery systems market rewards platforms that pair scalable processes with tissue-targeting precision, and exosome engineering now benefits from improved purification and payload-loading methods.
Restraints Impact Analysis of Novel Drug Delivery Systems (NDDS) Market*
| Restraint | (~) % Impact on CAGR Forecast | Geographic Relevance | Impact Timeline |
|---|---|---|---|
| Stringent combination-product regulations | -1.8% | Global, most restrictive in EU & North America | Medium term (2-4 years) |
| High device cost in LMICs | -1.1% | APAC, Latin America, MEA primarily | Long term (≥ 4 years) |
| Cyber-security risk in connected injectors | -0.9% | North America & EU core, expanding globally | Short term (≤ 2 years) |
| Limited LNP manufacturing capacity | -0.7% | Global, concentrated in North America & EU | Medium term (2-4 years) |
| Source: Mordor Intelligence | |||
Stringent Combination-Product Regulations
Revised FDA and EMA guidelines require exhaustive drug–device interaction studies, inflating budgets by as much as USD 100 million and extending timelines up to two years. J&J secured Breakthrough Therapy Designation for TAR-200 yet still navigated extensive post-market commitments, highlighting the difficulty for smaller innovators. Divergent regional rules further complicate global launches.
High Device Cost in LMICs
Connected auto-injectors and implantables cost 10-20 times more than oral generics, limiting access in resource-constrained regions. Procurement agencies in Latin America and Africa require localized manufacturing or tiered pricing; however, limited regulatory capacity delays approvals for sophisticated devices. Companies are piloting simpler, single-function variants to lower cost while preserving core therapeutic benefit.
*Our forecasts treat driver/restraint impacts as directional, not additive. The impact forecasts reflect baseline growth, mix effects, and variable interactions.
Novel Drug Delivery Systems (NDDS) Market Segment Analysis
By Route of Administration:
Oral Dominance Faces Digital DisruptionOral therapies commanded 48.70% of New Drug Delivery Systems market share in 2025, yet growth moderates as digital implants and long-acting injectables demonstrate superior adherence. Implantable formats are projected to deliver a 8.72% CAGR to 2031, supported by breakthroughs such as Vivani Medical’s GLP-1 implant that filled its first human study in four weeks. Injectable routes benefit from the biologics wave, while inhaled delivery attracts neurological and respiratory pipeline investments.
Patient preference, manufacturing scalability and reimbursement convenience underpin oral system resilience through 2030. However, smart pill sensors and micro-fluidic implants that log dosing create fresh value propositions for chronic disease management. Nasal and ocular options prosper in niche neurological and ophthalmic settings. Ultimately, route selection is increasingly dictated by molecular characteristics and personalized care models rather than historical convenience.

By Technology/System Type:
Smart Connectivity Reshapes Traditional PlatformsAuto-injectors retained 22.05% share of the New Drug Delivery Systems market size in 2025 on entrenched supply chains and clinician familiarity. Smart and connected devices, however, are advancing at a 9.18% CAGR as cloud-linked patches and app-integrated pens transform medication into data streams. Nanoparticle carriers, essential for mRNA therapeutics, underpin capacity expansions at Lonza and similar CDMOs.
Needle-free jet injectors reduce vaccination anxiety and speed mass-immunization programs, while microneedle patches gain traction in dermatology and vaccine delivery. Wearable infusers capable of delivering 5-50 mL biologics at home remove infusion-center bottlenecks. The technology race increasingly favors modular platforms adaptable across molecules, thereby compressing development cycles and enhancing portfolio ROI.
By Therapeutic Application:
Oncology Leadership Challenged by Neurological InnovationOncology contributed 33.05% of New Drug Delivery Systems market revenue in 2025, supported by antibody–drug conjugates, radiopharmaceuticals and device-enabled intratumoral therapies. J&J’s pasritamig showcased early anti-tumor activity with outpatient dosing every six weeks. Neurological disorders, including Parkinson’s and Alzheimer’s, are forecast to record a 9.36% CAGR, as BBB-penetrating nanoparticles and continuous infusion pumps address unmet needs.
Diabetes maintains momentum through closed-loop insulin systems integrating real-time glucose data, while cardiovascular therapies shift toward once-quarterly depot injections. Infectious disease platforms leverage rapid-fill needle-free injectors for pandemic preparedness. Cross-application platforms permit scale economies, aligning R&D cost with expanded indication breadth.
By End User:
Hospital Infrastructure Supports Home-Care TransitionHospitals held 53.10% share of New Drug Delivery Systems market in 2025, reflecting embedded infusion suites and surgical implant capabilities. Home-care settings, anticipated to post a 10.12% CAGR, capitalize on reimbursement reforms that finance at-home biologic administration. Ambulatory centers exploit minimally invasive implants, enabling same-day discharge.
Specialty clinics partner with device makers for disease-focused programs. Remote monitoring dashboards linked to connected injectors reduce unscheduled hospital visits, further reinforcing the migration to decentralized care. Successful systems therefore must balance clinical precision with ease of patient self-use.
Geography Analysis
North America Novel Drug Delivery Systems (NDDS) Market
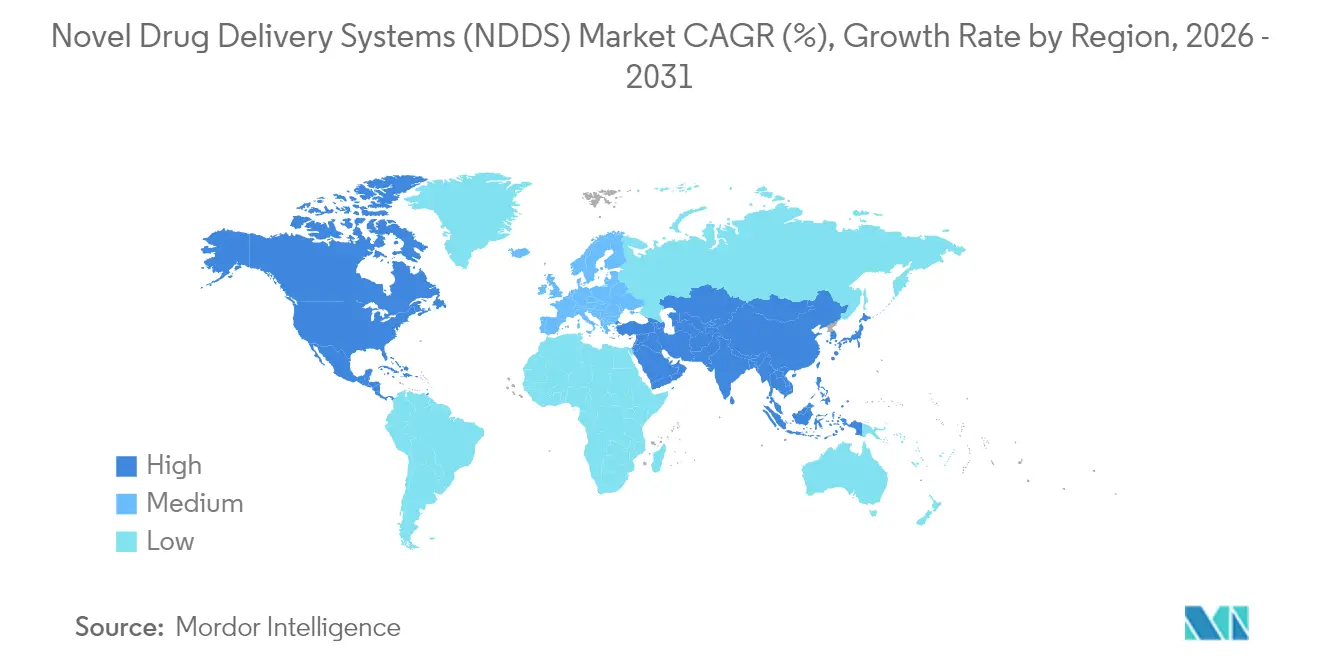
North America retained 41.90% of New Drug Delivery Systems market revenue in 2025, supported by fast regulatory pathways and payer acceptance of high-value devices. Breakthrough Therapy designations accelerate adoption, yet rising scrutiny of cybersecurity prolongs time-to-market for connected delivery tools. Capacity shortfalls for lipid nanoparticles prompt partnerships with Asian CDMOs.
APAC Novel Drug Delivery Systems (NDDS) Market
Asia-Pacific is projected to log a 10.66% CAGR through 2031. Regional governments expand universal health coverage and incentivize domestic manufacturing. China’s policy to localize high-end medical technology has spurred joint ventures for smart auto-injectors, while India’s generics producers eye value capture in cost-effective microneedle patches.
Europe Novel Drug Delivery Systems (NDDS) Market
Europe remains mature but regulation-intense. The Medical Device Regulation introduces dual compliance needs that delay launches but elevate safety standards. Sustainability imperatives accelerate interest in recyclable packaging and long-acting formulations. Brexit’s separate U.K. pathway demands parallel submissions, adding complexity but not materially eroding demand.
Regulatory Landscape
Regulation for novel drug delivery systems continues to focus on combination-product controls and harmonized quality systems across key markets. In the United States, the FDA Quality Management System Regulation (QMSR) became effective on February 2, 2026, incorporating ISO 13485:2016 by reference and setting new quality-system expectations for manufacturers of drug delivery devices and drug-device combination products.
For integral drug-device combinations in Europe, EU MDR Article 117 requires a Notified Body Opinion (NBOp) to confirm conformity with Annex I General Safety and Performance Requirements (GSPRs) when the device constituent does not hold a CE mark. That increases the importance of early Notified Body engagement for marketing authorization dossiers. Regulators also continue to emphasize performance and safety evidence, including FDA work around Essential Drug Delivery Outputs (EDDO) and guidance affecting transdermal systems, which raises documentation and verification requirements for delivery performance, human factors, and lifecycle risk management.
Value Chain Analysis
The NDDS value chain covers API and excipient suppliers (including specialized polymers, adhesives, and nanoparticle inputs), device component manufacturers (primary containers, needles, on-body mechanisms, sensors), platform developers, and integrated CDMOs that increasingly provide end-to-end services across formulation, device integration, and fill-finish. CROs and specialist test labs support clinical development through device performance, biocompatibility, and delivery verification work, while cold-chain and specialized logistics providers help distribute temperature-sensitive biologics, mRNA, and gene-therapy related products.
Bottlenecks cluster in scale-up and quality control for complex products, notably lipid nanoparticle manufacturing capacity and the characterization and batch-to-batch consistency testing needed for nanotechnology-enabled delivery systems. As portfolios shift toward self-administration and large-volume subcutaneous formats, platform standardization and supplier qualification become more important across the chain, from component traceability through post-market surveillance, particularly for connected devices that require secure digital tracking and lifecycle software controls.
Competitive Landscape
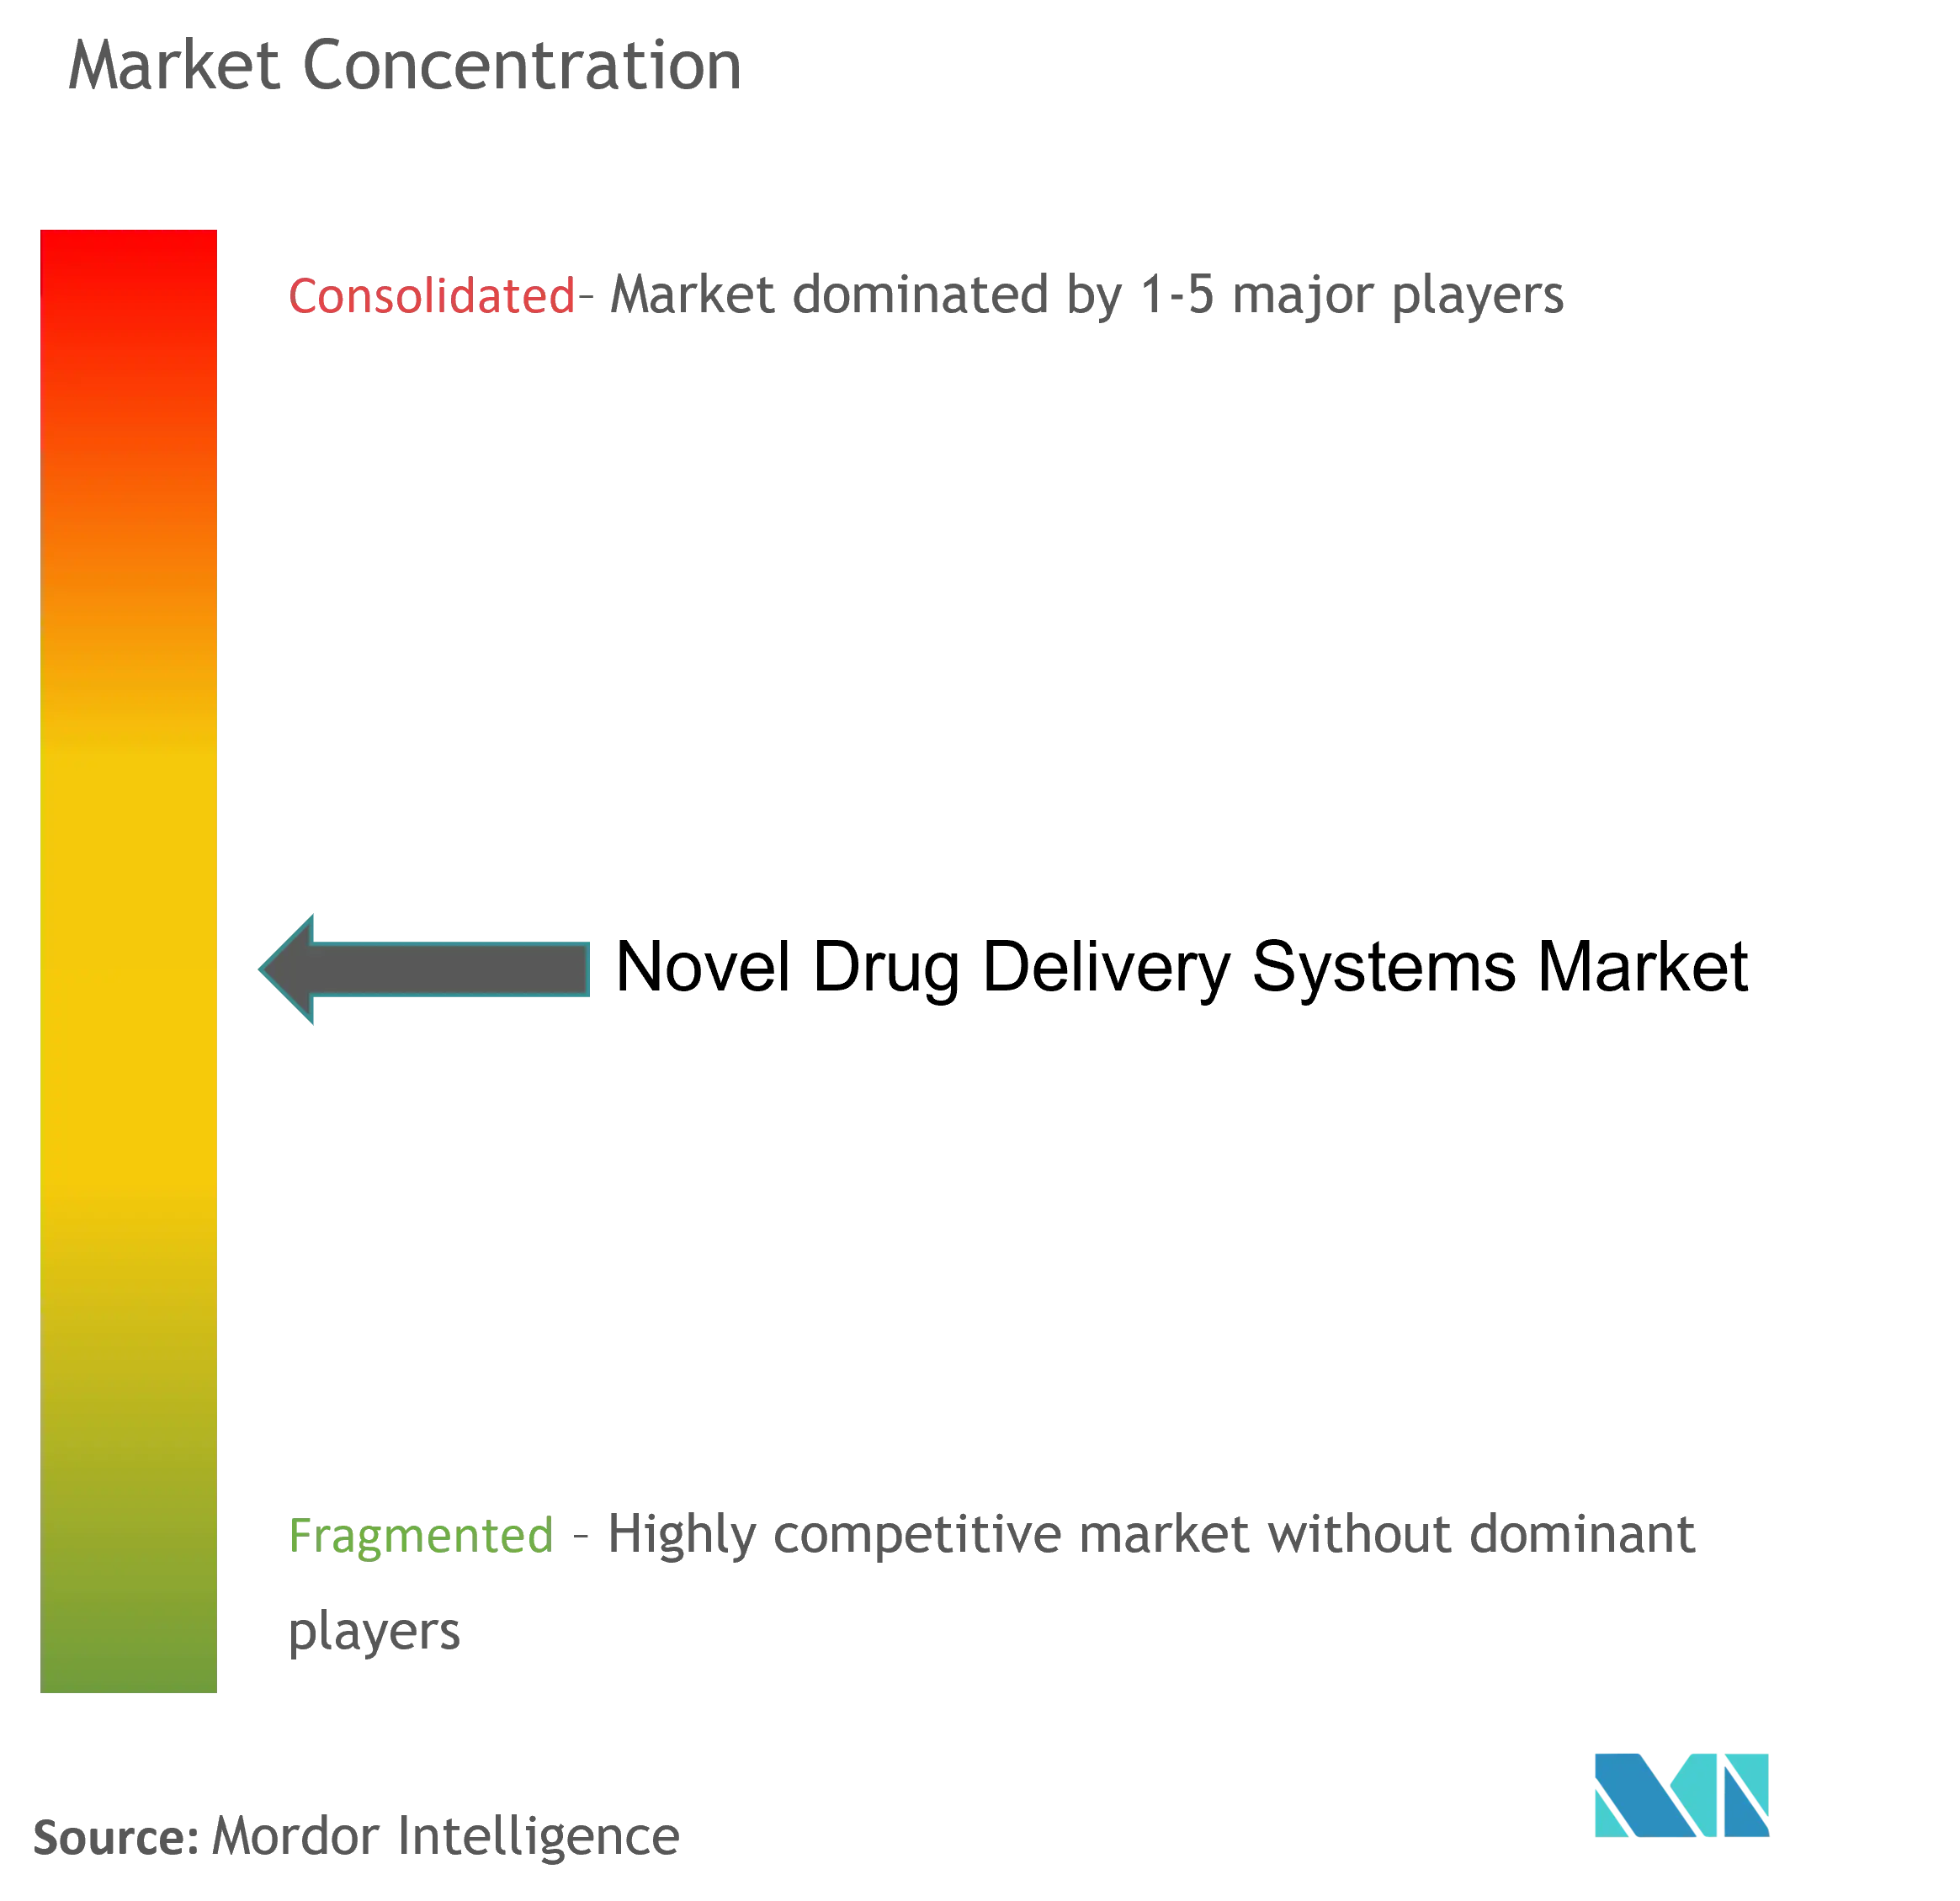
The New Drug Delivery Systems market is moderately fragmented, yet recent headline acquisitions demonstrate rising concentration. Novo Nordisk’s USD 16.5 billion Catalent deal provides integrated formulation and fill-finish capacity, while Lantheus’s radiopharmaceutical buyouts build vertical expertise. Larger firms leverage scale to navigate combination-product dossiers and absorb cybersecurity compliance costs.
Start-ups differentiate via AI-directed dosing algorithms, biodegradable carriers and user-centric industrial design. Strategic alliances between Pharma and MedTech accelerate prototyping, exemplified by Enable Injections collaborating with multiple biologic sponsors on high-volume wearable infusers. Platform technologies capable of accommodating multiple APIs now command premium valuations.
Customer purchasing decisions increasingly weigh clinical outcome data, economic evidence and environmental footprint. Consequently, suppliers that bundle real-world evidence with connected dashboards enjoy stronger formulary positioning. In this landscape, rapid regulatory clearance and modular production capacity emerge as the decisive competitive levers.
Novel Drug Delivery Systems (NDDS) Industry Leaders
-
Abbott Laboratories
-
Bayer AG
-
F. Hoffmann-La Roche AG
-
GlaxoSmithKline Plc
-
Merck & Co., Inc
- *Disclaimer: Major Players sorted in no particular order
Novel Drug Delivery Systems (NDDS) Market Companies Covered in this Report
- Johnson & Johnson
- Pfizer
- Novartis
- Roche
- Merck
- Sanofi
- GlaxoSmithKline
- AstraZeneca
- Bayer
- Beckton Dickinson
- 3M
- Medtronic
- Insulet
- Amgen
- Teva Pharmaceutical Industries
- Abbvie
- Eli Lilly and Company
- Boston Scientific
- Antares Pharma
- West Pharmaceutical Services
Read Analysis of Novel Drug Delivery Systems (NDDS) Companies
Market Opportunities and Future Outlook
Opportunity is increasing around high-volume subcutaneous administration and at-home delivery formats that shift complex biologics from infusion settings to self-administration. Recent company activity provides specific evidence of this direction, including Halozyme entering 2026 collaborations to apply ENHANZE for subcutaneous oncology targets with GSK (including antibody-drug conjugates) and to apply Hypercon technology with Vertex and Oruka to reduce injection volume.
Oral delivery of biologics is also showing near-term commercialization momentum through visible licensing activity. Novo Nordisk partnered with Vivtex (February 2026) to license oral drug-delivery technologies for oral biologic medicines in obesity and diabetes, reflecting demand for patient-centric, needle-sparing administration in chronic metabolic disease. In parallel, the FDA Office of Combination Products maintaining Essential Drug Delivery Outputs (EDDO) as a 2026 priority is increasing incentives for standardized verification and control of delivery performance, creating a clear need for platform device makers and CDMOs that can industrialize repeatable test methods, design controls, and compliant manufacturing for drug-device combinations and smart delivery systems.
Recent Industry Developments in Novel Drug Delivery Systems (NDDS) Market
- July 2026: Sanofi received US FDA approval for subcutaneous Sarclisa (isatuximab-irfc) Escena for multiple myeloma, delivered via an on-body injector using Enable Injections' enFuse platform. The approval highlights on-body delivery for oncology and supports broader adoption of wearable injectors for complex, clinic-originated regimens.
- March 2026: Abbott Laboratories completed its acquisition of Exact Sciences, expanding its position in oncology and diagnostics. The combined capabilities strengthen the ability to pair testing and monitoring with therapy pathways, supporting more integrated care models where connected delivery and patient management tools are increasingly central.
- August 2024: Abbott and Medtronic announced a global partnership to connect Abbott's FreeStyle Libre continuous glucose monitoring with Medtronic's automated insulin delivery and smart insulin pen systems. The integration advances closed-loop and data-enabled delivery ecosystems, reinforcing demand for interoperable, connected drug delivery platforms in diabetes management.
Novel Drug Delivery Systems (NDDS) Market Report Scope and Research Methodology
Market Definition and Coverage
This market covers revenue earned from technologies and platforms that change how a drug is delivered to the body so outcomes improve, such as better bioavailability, stability, safety, or adherence, across major routes and system types.
Scope exclusions: We exclude standard, non-novel versions of conventional dosage forms where there is no enabling delivery technology beyond routine formulation or packaging.
Segments Covered in This Report
- By Route of Administration (Value)
- Oral
- Injectable
- Inhalation
- Transdermal
- Implantable
- Ocular
- Nasal
- Others
- By Technology / System Type (Value)
- Nanoparticle-based Systems
- Wearable Injectors
- Smart / Connected Devices
- Needle-Free Injection Systems
- Microneedle Patches
- Auto-Injectors
- Enteric-Coated Capsules
- Others
- By Therapeutic Application (Value)
- Oncology
- Diabetes
- Cardiovascular Diseases
- Infectious Diseases
- Respiratory Diseases
- Neurological Disorders
- Others
- By End User (Value)
- Hospitals
- Ambulatory Surgical Centers
- Home-Care Settings
- Specialty Clinics
- Others
- By Geography (Value)
- North America
- United States
- Canada
- Mexico
- Europe
- Germany
- United Kingdom
- France
- Italy
- Spain
- Rest of Europe
- Asia-Pacific
- China
- India
- Japan
- South Korea
- Australia
- Rest of Asia-Pacific
- South America
- Brazil
- Argentina
- Rest of South America
- Middle East and Africa
- GCC
- South Africa
- Rest of Middle East and Africa
- North America
Data Sources, Market Sizing, and Validation
Desk Research
For this market, desk research is used to set the basic demand and supply context, followed by structured assumptions that can be tested in interviews. We mainly pull from public health and drug science sources such as the US FDA (including combination product guidance), CDC, WHO, OECD health statistics, and peer reviewed pharmaceutics journals that document delivery advances and adoption barriers.
We also review company annual reports, investor decks, and press releases to understand platform launches, manufacturing scale ups, and partnership activity, which helps when mapping which delivery routes are expanding faster. Where needed, we complement this with paid subscriptions for company financials and news, and patent databases to spot where technical focus is shifting (for example toward controlled and targeted formats). The desk sources listed here are not exhaustive, and many other public references were used for cross checks and clarification.
Primary Interviews and Surveys
Primary work focuses on validating how quickly specific delivery modes are being adopted, how pricing is moving, and what constraints are real in different regions, so the model does not rely only on published narratives. We spoke with a mix of delivery technology suppliers, drug developers, device and packaging linked stakeholders, and healthcare facing experts, with coverage spread across APAC, EMEA, and the Americas to reflect differences in regulation and uptake.
Distribution of primary research fieldwork respondents
| Company type | Respondent position | Region |
|---|---|---|
| Top tier: 39% | CXOs: 20% | APAC: 38% |
| Mid tier: 40% | Functional/Unit leaders: 39% | EMEA: 36% |
| Smaller Players: 21% | Managers: 41% | Americas: 26% |
Market-Sizing & Forecasting
Sizing starts with a top-down build where route of administration demand is reconstructed using country level pharma spending signals, therapy mix shifts, and the portion of new and lifecycle managed products that use enabling delivery systems. That demand pool is then split across delivery modes, and the totals are stress tested with selective bottom-up checks such as sampled revenue roll ups for delivery platform providers and an ASP x volume approximation for a few high visibility formats.
Key inputs that materially move the curve include biologics and complex therapy share, chronic disease treatment volumes, injectable versus non-injectable mix, regulatory momentum for combination products, and platform specific adoption in hospitals versus self administration settings. Forecasting uses scenario analysis supported by expert views on adoption speed, with the base case adjusted where constraints show up, such as manufacturing scalability, device compatibility, or slower reimbursement pull through. When bottom-up data is missing for smaller geographies, gaps are filled through penetration assumptions anchored to comparable markets and then rechecked in follow up calls.
Data Validation & Update Cycle
Outputs are validated through triangulation across independent signals, including healthcare spend trends, announced product approvals, and route level growth patterns, before final numbers are signed off. Large variances trigger an extra review pass where assumptions, currency timing, and growth drivers are re-tested, and respondents may be re-contacted if a shift looks structural.
The report is refreshed on an annual cycle, and interim updates are made when major events occur that can change adoption or pricing expectations. Before delivery, we do a final check of recent releases and policy changes so the view reflects the most current market conditions.
Mordor Intelligence's New Drug Delivery Systems Market Size Measured Against Other Published Estimates
Published values for new drug delivery systems often do not match because the scope line is drawn differently, and then the math follows different demand indicators and pricing logic. Differences also show up when one study uses a different base year, a faster adoption curve, or a less frequent refresh cadence.
The main gap comes from whether the estimate counts the full value of the drug, or only the delivery technology and enabling components, and in our approach Mordor Intelligence counts revenue tied to novel delivery systems across routes and modes rather than mixing in broader pharmaceutical sales that do not require an enabling platform.
Benchmark comparison
| Source | Market Size | Gaps in Research Methodology |
|---|---|---|
| Mordor Intelligence | USD 311.65 B (2026) | |
| Industry Publisher A | USD 89.74 B (2025) | Uses a narrower revenue lens that leans toward platform and device enabled delivery value, and the base year is earlier, which reduces the total when compared on a like for like scope. |
| Global Publisher B | USD 144.99 B (2025) | Applies a different segmentation cut and base year, and the scope appears closer to selected delivery mechanisms, which can undercount broader route level adoption captured in a route and mode mapped model. |
The spread in the table is mostly explained by scope and base year choices, followed by how adoption and pricing are carried forward into the forecast. By keeping the build tied to clear route demand signals, and then cross checking with supplier side approximations, the final number stays traceable and easier to reproduce when assumptions are updated.
Key Questions Answered in the Report
What revenue level does the New Drug Delivery Systems market reach in 2026?
The sector generated USD 311.65 billion in 2026 and is projected to climb to USD 417.88 billion by 2031.
Which administration route grows fastest through 2031?
Implantable systems are projected to register a 8.72% CAGR, outpacing other routes.
How quickly will smart and connected devices advance?
This technology segment is set for a 9.18% CAGR between 2026-2031 as data-enabled platforms gain acceptance.
Which therapeutic area leads 2025 revenue?
Oncology applications held 33.05% share of sector revenue in 2025.
Which region shows the highest forecast growth?
Asia-Pacific is poised for a 10.66% CAGR through 2031 thanks to expanding healthcare access.
What driver contributes most to CAGR uplift?
Adoption of biologics and large-molecule drugs adds roughly +2.1 percentage points to the forecast CAGR.