
Neuromarketing Market Size and Share
Market Overview
| Study Period | 2020 - 2031 |
|---|---|
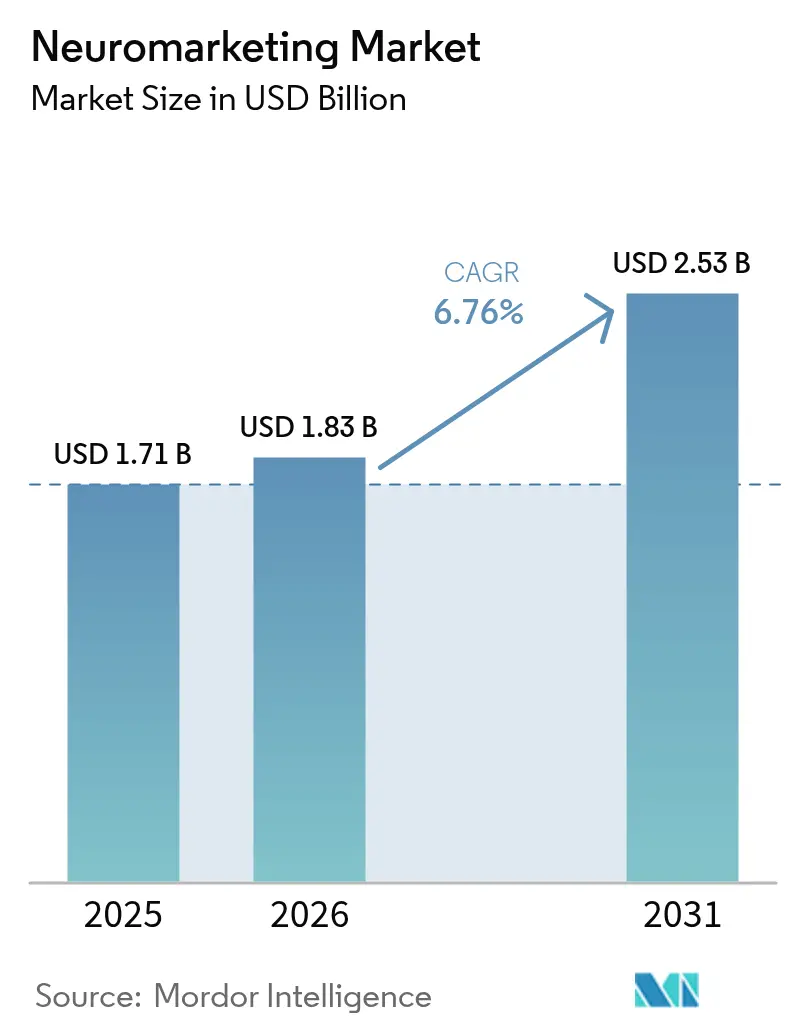
| Market Size (2026) | USD 1.83 Billion |
| Market Size (2031) | USD 2.53 Billion |
| Growth Rate (2026 - 2031) | 6.76 % |
| Fastest Growing Market | Asia Pacific |
| Largest Market | North America |
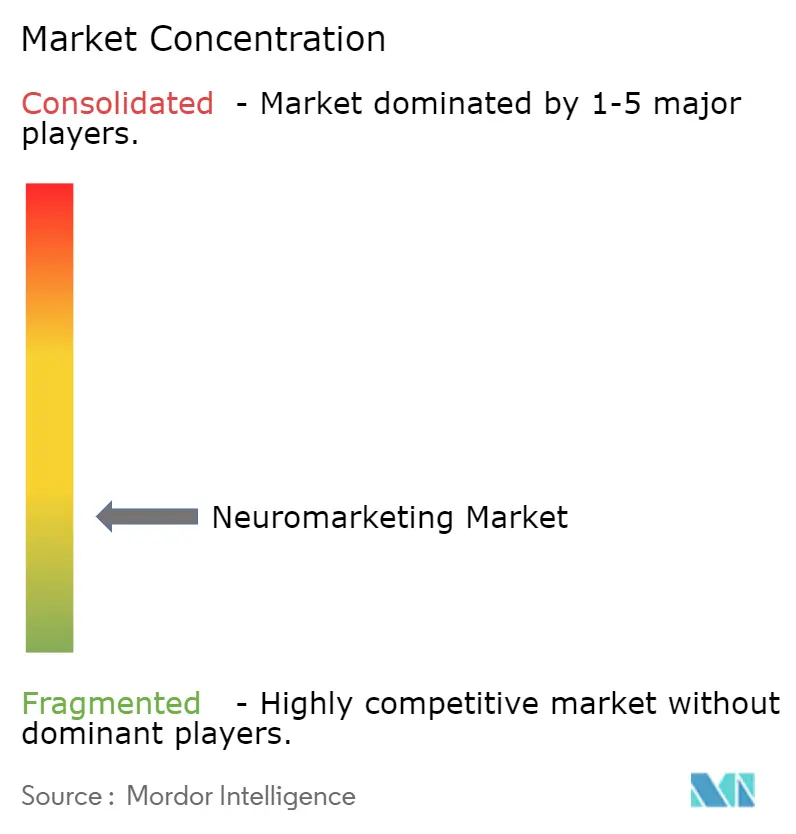
| Market Concentration | Low |
Major Players *Disclaimer: Major Players sorted in no particular order Image © Mordor Intelligence. Reuse requires attribution under CC BY 4.0. | |
Neuromarketing Market Analysis by Mordor Intelligence
Neuromarketing market size in 2026 is estimated at USD 1.83 billion, growing from 2025 value of USD 1.71 billion with 2031 projections showing USD 2.53 billion, growing at 6.76% CAGR over 2026-2031. Expansion is fueled by the proven ability of electroencephalography-machine learning systems to predict purchase intent with 87.1% accuracy, the rise of immersive extended-reality testing environments, and the widening gap between privacy regulations and traditional consumer-insight tools. Global brands view neuromarketing platforms as infrastructure for campaign pre-testing, audience segmentation, and user-experience optimization, while investors support new ventures that bridge hardware miniaturization with cloud analytics. Strict data-protection laws, notably California SB 1223 and the European Union’s GDPR, compel vendors to embed privacy-preserving design principles that add compliance costs yet create durable competitive advantages. Consolidation is underway as larger technology companies acquire specialist firms to embed neural measurement across wider marketing-technology stacks.
Key Report Takeaways
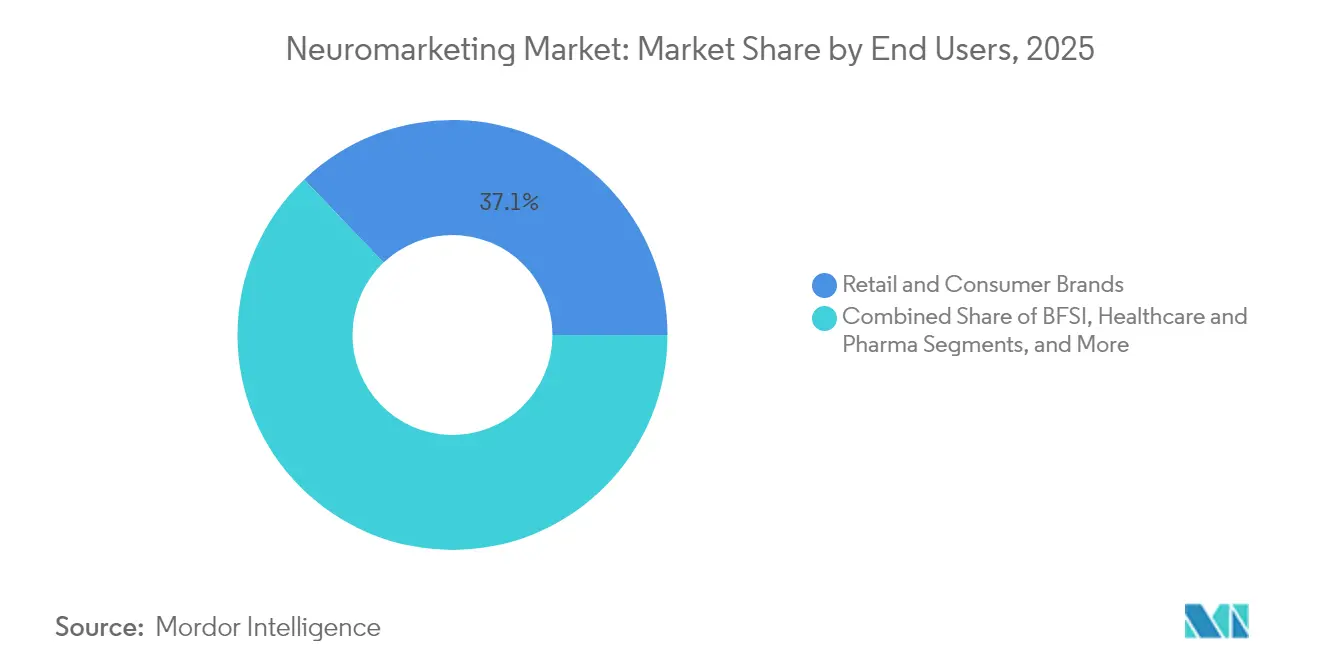
- By end user, retail and consumer brands held 37.12% neuromarketing market share in 2025, whereas healthcare and pharma applications are projected to grow at a 7.12% CAGR through 2031.
- By technology, electroencephalography captured 40.28% of the neuromarketing market size in 2025, while functional near-infrared spectroscopy is pacing the segment with a 7.35% CAGR to 2031.
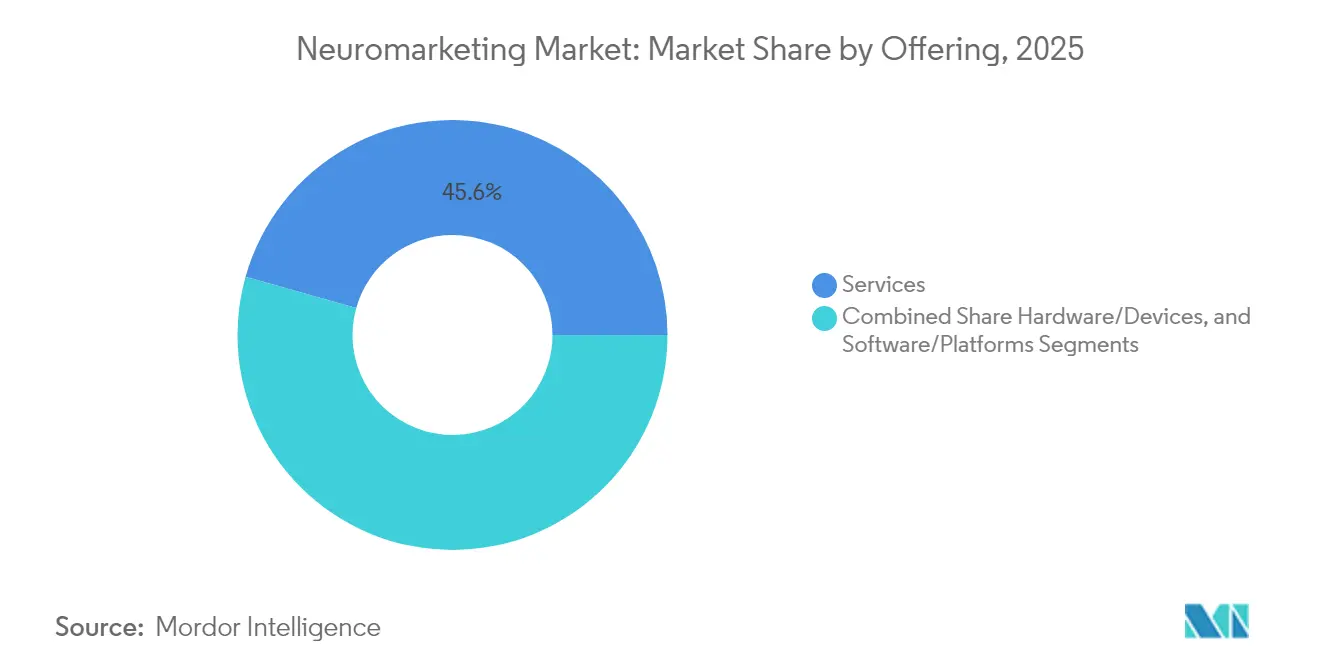
- By offering, services commanded 45.63% revenue in 2025 and software platforms are expanding at a 7.05% CAGR through 2031.
- By application, advertising and media testing accounted for 51.45% share of the neuromarketing market size in 2025 as user-experience analytics advances at an 7.92% CAGR to 2031.
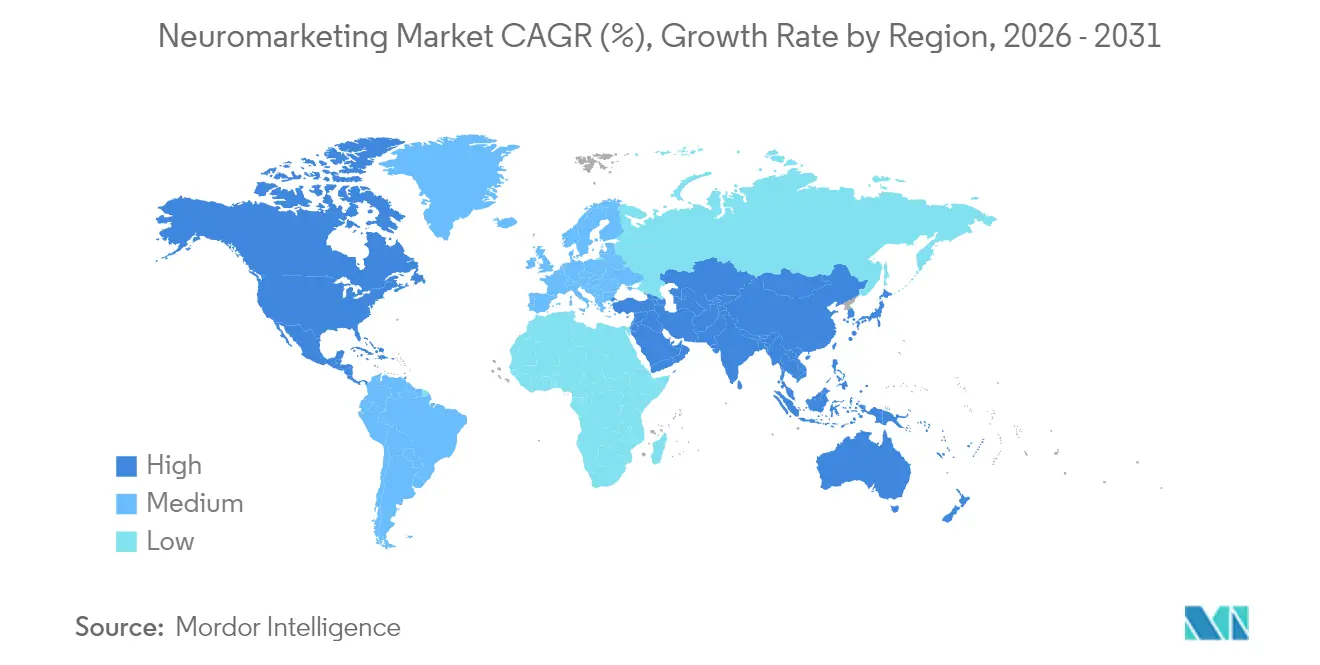
- By geography, North America led with 41.20% revenue share in 2025, and Asia Pacific is advancing at a 7.83% CAGR through 2031.
Note: Market size and forecast figures in this report are generated using Mordor Intelligence’s proprietary estimation framework, updated with the latest available data and insights as of 2026.
Market Trends and Insights
Drivers Impact Analysis of Neuromarketing Market*
| Driver | (~) % Impact on CAGR Forecast | Geographic Relevance | Impact Timeline |
|---|---|---|---|
| Increasing need for advanced marketing tools | +1.8% | North America and Europe | Medium term (2-4 years) |
| Proliferation of smartphone-based real-time experience tracking | +1.2% | Asia Pacific, spill-over to North America | Short term (≤ 2 years) |
| AI-powered predictive attention analytics adoption | +1.5% | North America and China | Medium term (2-4 years) |
| Rising demand for privacy-compliant, opt-in consumer insights | +0.9% | North America and European Union | Long term (≥ 4 years) |
| Integration of neuromarketing with immersive XR platforms | +1.1% | Developed markets globally | Medium term (2-4 years) |
| Growing venture funding in neurotechnology start-ups | +0.8% | North America and Europe | Short term (≤ 2 years) |
| Source: Mordor Intelligence | |||
Increasing Need for Advanced Marketing Tools
Brand marketers face fragmented digital journeys that weaken click-through and conversion metrics as proxies for engagement. EEG-based systems integrated with machine learning provide real-time readouts of cognitive load, emotional arousal, and motivational intent that correlate directly with sales lift. A landmark study reported 87.1% purchase-prediction accuracy against 64% for surveys, validating the shift toward neurobiological measurement. Consumer goods firms that deploy these tools achieve faster creative iteration, reduced media wastage, and higher return on advertising spend. Heightened competition inside crowded online marketplaces further elevates demand for deeper behavioral insight.
AI-Powered Predictive Attention Analytics Adoption
Neuromarketing vendors embed convolutional neural networks and gradient-boosting models to forecast attention patterns before campaigns launch. Training on large multi-modal datasets enables cross-cultural segmentation that distinguishes subtle emotional cues among demographic cohorts. Functional near-infrared spectroscopy studies reveal gender-specific prefrontal activation during mixed-culture adverts, allowing brands to tailor messaging by neurobiological fit.[1]Lian Duan et al., “Gender Differences in Transnational Brand Purchase Decision Toward Mixed Culture and Original Culture Advertisements: An fNIRS Study,” Frontiers in Psychology, frontiersin.org Forecasting extends beyond single creatives to long-term brand-equity trajectories, guiding budget allocation and portfolio strategy. Companies that integrate these predictive engines into media-planning workflows compress insights cycles from weeks to hours.
Rising Demand for Privacy-Compliant, Opt-In Consumer Insights
California SB 1223 classifies neural data as sensitive information, and GDPR mandates explicit consent, data minimization, and purpose limitation for neurophysiological signals. Vendors respond with federated-learning architectures that keep raw data on local devices while transmitting model updates, and with differential-privacy layers that inject statistical noise. Certifications and transparent consent flows improve consumer trust, letting brands command premium fees for responsibly sourced insight. Privacy leadership becomes a marketing differentiator that strengthens customer loyalty and reduces litigation risk.
Integration of Neuromarketing with Immersive XR Platforms
Virtual reality headsets now embed eye tracking, galvanic skin response, and brain-signal sensors that capture presence, flow, and arousal during simulated product encounters. Tests inside VR show higher behavioral-intention scores when sensory vividness and system responsiveness align, underscoring the value of immersive neuromarketing.[2]Sinh Hoang Nguyen, “Leveraging Virtual Reality Experiences to Shape Tourists' Behavioral Intentions: The Mediating Roles of Enjoyment and Immersion,” Journal of Zoological and Botanical Gardens, mdpi.com The Prophesee-Tobii partnership integrates event-based sensors for low-latency eye tracking, unlocking live attention mapping in extended-reality retail labs. Brands evaluate store layouts, packaging, and user interfaces in realistic yet controlled settings, cutting physical prototyping time and capital cost.
Restraints Impact Analysis of Neuromarketing Market*
| Restraint | (~) % Impact on CAGR Forecast | Geographic Relevance | Impact Timeline |
|---|---|---|---|
| High capital cost of gold-standard neuroimaging (fMRI) | -1.2% | Global, hits smaller institutions hardest | Long term (≥ 4 years) |
| Fragmented regulatory landscape and data-privacy constraints | -0.8% | North America and European Union | Medium term (2-4 years) |
| Shortage of multidisciplinary talent | -0.6% | Global, acute in emerging markets | Long term (≥ 4 years) |
| Consumer skepticism over subconscious manipulation | -0.4% | Europe and North America | Medium term (2-4 years) |
| Source: Mordor Intelligence | |||
High Capital Cost of Gold-Standard Neuroimaging (fMRI)
Installing an fMRI suite can exceed USD 3 million, with recurrent maintenance topping USD 200,000 each year. Such spending is feasible for large pharmaceutical firms but unattainable for most agencies and start-ups. The capital hurdle entrenches a two-tier structure in which resource-rich organizations access high-resolution data while others rely on lower-cost EEG or eye-tracking alternatives. Portable fNIRS devices deliver roughly 75% of fMRI precision at 10% of its cost, but they cannot yet fully replicate whole-brain mapping. This constraint limits large-scale adoption and slows methodological innovation.
Fragmented Regulatory Landscape and Data-Privacy Constraints
Jurisdictions differ on whether neural signals constitute biometric or health data, forcing multinationals to maintain parallel compliance frameworks. California’s privacy law demands consumer opt-in, the European Union requires strict purpose limitation, and Chile enshrines neurorights in its constitution.[3]Tomas Zrzavy et al., “The New Regulation of Non-Medical Neurotechnologies in the European Union: Overview and Reflection,” PubMed Central, pmc.ncbi.nlm.nih.gov Legal-team overhead rises, product rollouts slow, and standardized offerings become difficult to scale. Smaller vendors lacking dedicated compliance staff struggle to enter regulated markets, constraining competitive diversity and dampening growth.
*Our forecasts treat driver/restraint impacts as directional, not additive. The impact forecasts reflect baseline growth, mix effects, and variable interactions.
Neuromarketing Market Segment Analysis
By End Users - Healthcare Adoption Accelerates
Retail and consumer brands captured 37.12% neuromarketing market share during 2025, driven by high-volume campaign testing across fast-moving consumer goods. Healthcare and pharma applications, however, are advancing at a 7.12% CAGR, the fastest among end users. The neuromarketing market size for healthcare communications will benefit from neuroscience-based content that improves patient adherence and clinical-trial engagement. Pharmaceutical marketers employ digital biomarkers to monitor cognitive side effects in real time, while hospital networks test user-experience flows of telehealth portals to reduce friction and missed appointments.
Banks and insurers integrate neural feedback into onboarding journeys that shorten form-completion times and lower abandonment. Market-research agencies embed biometric panels within traditional survey infrastructures to boost predictive validity. Academic institutions expand brain-computer-interface labs through public-private grants, particularly in Asia Pacific where governments fund translational neuroscience. Automotive and entertainment firms explore in-vehicle emotion monitoring and storyboarding optimization, rounding out a diversified end-user landscape that strengthens demand resilience.



By Technology - fNIRS Gains Momentum
Electroencephalography held 40.28% revenue in 2025 thanks to well-established research protocols and shrinking sensor costs. Functional near-infrared spectroscopy is growing 7.35% annually, narrowing the gap by offering mobile, fiber-less caps that map prefrontal blood oxygenation while users browse physical aisles or virtual storefronts. The neuromarketing market size for fNIRS solutions will expand as headset manufacturers embed optical diodes inside mixed-reality devices. Eye-tracking modules benefit from integration into smart glasses that assess driver distraction and retail shelf gaze.
Functional magnetic resonance imaging remains indispensable for high-resolution studies of subconscious brand associations, even as budget pressures favor lighter modalities. Wearable biometrics that combine galvanic skin response with photoplethysmography enable continuous emotion tracking during day-long consumer safaris. Emerging brain-sensing earbuds and neuromorphic sensors sit at the frontier, promising hands-free passive data streams that could reshape methodological norms once reliability thresholds are met.
By Offering - Platforms Scale Faster Than Services
Services dominated with 45.63% revenue in 2025 because most projects still require custom study design, specialized hardware setup, and cross-modal data fusion. Software platforms are advancing 7.05% per year as vendors deliver turnkey dashboards that automate signal cleaning, feature extraction, and marketing-mix recommendations. Bundling cloud APIs lets brand teams ingest neuromarketing data inside existing customer-data platforms without coding, lowering adoption friction for non-scientists.
Hardware suppliers push miniaturization that aligns with the do-it-yourself ethos of platform buyers. Smart Eye’s acquisition of iMotions merges multimodal analytics with automotive sensing, creating integrated toolkits that blur the line between device and software categories. Subscription-based packages that pair headsets with analytic licenses deepen recurring revenue and reduce upfront cost, accelerating the shift away from one-off consulting engagements.
By Application - UX Analytics Outpaces Traditional Testing
Advertising and media testing held 51.45% of neuromarketing market size in 2025 after decades of use in commercial pre-screening. User-experience and digital-analytics projects are expanding 7.92% annually, reflecting the strategic priority of optimizing e-commerce funnels, app navigation, and in-car infotainment. Brands report conversion-rate lifts exceeding 20% when neural metrics guide interface design instead of conventional heat-map analysis.
Packaging teams employ virtual reality shelves to evaluate color schemes and typography, reducing physical mockup cycles. Retailers place ceiling-mounted eye-tracking cameras that map dwell and path, integrating neuro-derived affect scores for holistic in-store analytics. Pricing strategists analyze heartbeat-coupled EEG to detect stress thresholds during dynamic-pricing tests. Political and social-campaign strategists emerge as new clients, using neuromarketing to craft emotionally resonant messages in crowded information ecosystems.
Geography Analysis
North America Neuromarketing Market
North America commanded 41.20% neuromarketing market share in 2025, reflecting deep venture-capital pools, academic brain-science clusters, and clear privacy guidance. United States funding for neurotechnology reached USD 2.3 billion across 129 deals that year, catalyzing breakthrough sensor designs and AI pipelines. Canada supplements with public grants that encourage cross-border consortia, while Mexico’s consumer-goods companies adopt budget-friendly eye-tracking as digital advertising sophistication rises. Acquisition activity, such as Apple’s USD 22 million purchase of Datakalab, underscores the region’s appetite for embedded neural-analysis capability.
APAC Neuromarketing Market
Asia Pacific is growing at a 7.83% CAGR through 2031 and will narrow the regional revenue gap as China, India, Japan, and South Korea integrate neuromarketing into omnichannel retail, gaming, and automotive experiences. Government research grants in China support neuro-AI startups that partner with global brands, while India’s direct-to-consumer platforms deploy EEG headbands in usability labs. Cultural norms that emphasize group harmony amplify the impact of social-cognition metrics, motivating local agencies to customize study protocols that capture collectivist cues. Japan’s electronics giants and South Korea’s entertainment groups pioneer immersive XR laboratories that fuse fNIRS with haptic feedback to refine product launches.
EMEA and South America Neuromarketing Market
Europe maintains healthy demand anchored by Germany’s automotive heritage, France’s luxury-goods creativity, and the United Kingdom’s media-agency innovation. Stringent GDPR enforcement propels edge-analytics and federated-learning solutions that limit personal-data transfer, positioning European vendors as global benchmarks for ethical neuromarketing. Academic networks such as the Human Brain Project spin off instrumentation advances that flow into commercial offerings. Privacy-focused reputation attracts multinational brands facing rising consumer skepticism, turning compliance sophistication into a revenue catalyst. Long-run opportunities also emerge in South America, the Middle East, and Africa as digital infrastructure accelerates and multinational retailers localize omnichannel strategies.

Regulatory Landscape
Neuromarketing vendors operate under overlapping privacy, AI, and neuroethics rules that treat neural signals as highly sensitive. In the European Union, GDPR requirements for explicit consent, data minimization, and purpose limitation commonly apply to neurophysiological signals, and the European Data Protection Supervisor (EDPS) has highlighted neurodata as requiring elevated protection protocols for monitoring and profiling use cases.
In addition, the EU Artificial Intelligence Act (Regulation 2024/1689) introduces new compliance checkpoints for AI-driven targeting, including restrictions around subliminal techniques and exploitation of vulnerabilities. In April 2026, UNESCO adopted a Recommendation on the Ethics of Neurotechnology, reinforcing expectations around prior, free, and informed consent and broader safeguards for mental integrity, which increases pressure for privacy-by-design and ethics-by-design implementations alongside the California CCPA/CPRA framework and neural-data provisions such as California SB 1223.
Value Chain Analysis
The neuromarketing value chain starts with sensor and device inputs, including EEG headsets, eye-tracking cameras and modules, and biometrics such as GSR and heart-rate sensors, along with higher-cost modalities such as fMRI and fNIRS. These inputs feed into data-collection software, panel management and study-design tooling, and AI analytics layers that clean signals and translate multimodal data into marketing KPIs for use cases including advertising testing, UX analytics, and in-store behavior mapping.
Delivery is split between project-based services (custom experimental design, recruitment, and analysis) and software or platform subscriptions embedded into client workflows, with research labs, universities, and commercial testing facilities acting as execution nodes. Industry bodies and codes of ethics, including NMSBA and the INN Association, influence standards around participant privacy, transparency, and scientific rigor, while regional neural-data compliance requirements create operational checkpoints that affect data storage, consent flows, and cross-border transfer. Collaboration also links agencies and brand owners to specialist neuromarketing partners, illustrated by Hakuhodo DY ONE and NeU announcing a joint research initiative in March 2026 focused on applying neuromarketing techniques to video advertising creatives.
Competitive Landscape
More than 30 active suppliers make the neuromarketing arena moderately fragmented, yet competitive intensity rises as large technology companies enter through acquisition. No single provider exceeds 15% market share, leaving room for niche specialists that differentiate on modality depth, vertical expertise, or privacy engineering. Smart Eye’s absorption of iMotions combines automotive occupant monitoring with lab-grade analytics, broadening addressable use cases. Apple’s move for Datakalab signals platform players’ interest in embedding neural-insight engines inside consumer ecosystems such as app-store ad networks and mixed-reality headsets.
Technology roadmaps diverge. Hardware-centric firms focus on dry electrodes, optode miniaturization, and edge compute. Software-centric peers invest in transformer models that fuse EEG, eye tracking, and facial coding to deliver single-score ad-effectiveness indices. Privacy-first challengers champion zero-knowledge proofs and homomorphic encryption that reassure privacy-sensitive clients. Geographic expansion strategies adjust to regulatory patchwork: U.S. vendors open data centers inside the European Union, and European vendors partner with Chinese cloud providers for compliance localization.
Strategic partnerships proliferate. The Prophesee-Tobii alliance brings event-based sensors that reduce eye-tracking latency below 10 ms, critical for action-game testing and automotive human-machine-interface development. IDUN Technologies collaborates with Analog Devices to showcase brain-sensing earbuds that may popularize passive neuromarketing data capture within audio-streaming services. Venture funding concentrates on start-ups with portable or consumer-grade form factors that unlock mass-market behavioral insights. Competitive positioning now hinges on mastery of compliance, AI scale, hardware ergonomics, and demonstrable ROI benchmarks.
Neuromarketing Industry Leaders
Immersion Neuroscience
Buyology Inc.
Merchant Mechanics Inc.
Emotion Research LAB
The Nielsen Company LLC (Nielsen Consumer Neuroscience)
- *Disclaimer: Major Players sorted in no particular order
Neuromarketing Market Companies Covered in this Report
- The Nielsen Company LLC
- Neurons Inc.
- Immersion Neuroscience Inc.
- NVISO SA
- Cadwell Industries Inc.
- Compumedics Limited
- Merchant Mechanics Inc.
- Neural Sense (Pty) Ltd
- SR Labs SRL
- Synetiq Ltd.
- Mindspeller BV
- MindMetriks LLC
- Uniphore Technologies Inc.
- Tobii AB
- iMotions A/S
- Bitbrain Technologies SL
- Emotiv Inc.
- Shimmer Research Ltd.
- Myndlift Ltd.
- Blackbox Biometrics LLC
- Innerscope Research Inc.
- Eye Square GmbH
- HCL Technologies Limited (Neuromarketing Practice)
- Spark Neuro Inc.
- Affectiva Inc.
- Sensory Logic Inc.
- Neurotrend LLC
- SalesBrain LLC
- NeuroVision Marketing LLC
- Neuro-Insight Pty Ltd

Market Opportunities and Future Outlook
A key whitespace is the shift from bespoke lab studies toward scalable, predictive neuromarketing embedded in everyday creative and product workflows. In March 2026, Hakuhodo DY ONE and NeU launched a joint research project to visualize the value of video advertising using an Attention to Action (ATA) framework, signaling demand for neuromarketing methods that operationalize attention and persuasion metrics for mainstream campaign production. This creates an opportunity for vendors that can package validated metrics, integrate into existing design and media-planning stacks, and shorten iteration cycles without requiring specialized lab infrastructure.
Another opportunity is the expansion of computational models that predict neural responses and reduce dependence on costly imaging, supported by proof points that connect neural optimization to performance outcomes. Meta AI released TRIBE v2 in March 2026, a neural encoding model trained on large-scale 7T fMRI data, demonstrating how advanced models can translate neuroscience into deployable prediction engines for visual and auditory stimuli. In April 2026, Neurons Inc published a case study reporting a 65% increase in in-app click-through rates after neuromarketing-informed creative changes, reinforcing demand for ROI-linked toolchains and opening room for platform offerings that standardize creative scoring across brands, channels, and geographies while staying within neurodata consent and privacy constraints.
Recent Industry Developments in Neuromarketing Market
- June 2026: Immersion Neuroscience collaborated with Pandora to apply neuroscience-based value measurement aimed at predicting song hits using unconscious physiological response signals. This extends neuromarketing beyond traditional ad testing into streaming-content optimization, tying engagement measurement to content strategy decisions.
- May 2026: Ogilvy led a study for Viasat Ads using Immersion Neuroscience technology to compare immersion levels for in-flight audiences versus viewers on the ground. This supports neuromarketing use in media planning and ad-sales narratives by quantifying attention and engagement differences by context of consumption.
- October 2024: Neurons Inc raised USD 6.98 million in funding from Google for Startups and Fairpoint Capital to expand its AI-driven neuromarketing platform globally. The funding strengthened product scaling and international go-to-market capacity for software-led neuromarketing offerings.


Neuromarketing Market Report Scope and Research Methodology
Market Definition and Coverage
For this study, the neuromarketing market covers revenue earned from using neuroscience and behavioral measurement tools to test and improve marketing, advertising, product, packaging, and digital experiences, including related software and professional services, across major regions.
Scope exclusions: We exclude general marketing analytics that does not use neuro or biometric measurement methods, along with academic lab spending that is not linked to commercial research delivery.
Segments Covered in This Report
- By End Users
- Banking, Financial Services and Insurance
- Retail and Consumer Brands
- Market Research Agencies
- Scientific Institutions
- Healthcare and Pharma
- Other End Users
- By Technology
- Electroencephalography (EEG)
- Functional Magnetic Resonance Imaging (fMRI)
- Eye Tracking
- Biometrics (GSR, Heart Rate)
- Facial Coding / Emotion AI
- Functional Near-Infrared Spectroscopy (fNIRS)
- Other Technologies
- By Offering
- Hardware / Devices
- Software / Platforms
- Services
- By Application
- Advertising and Media Testing
- Product and Packaging Design
- User Experience and Digital Analytics
- Retail and In-Store Analytics
- Pricing Research
- Political and Social Campaign Testing
- Other Applications
- By Geography
- North America
- United States
- Canada
- Mexico
- South America
- Brazil
- Argentina
- Rest of South America
- Europe
- Germany
- France
- United Kingdom
- Italy
- Spain
- Russia
- Rest of Europe
- Asia Pacific
- China
- Japan
- India
- South Korea
- Australia and New Zealand
- Rest of Asia Pacific
- Middle East
- Saudi Arabia
- United Arab Emirates
- Turkey
- Rest of Middle East
- Africa
- South Africa
- Egypt
- Nigeria
- Rest of Africa
- North America
Data Sources, Market Sizing, and Validation
Desk Research
Desk research was used to map the demand side and to anchor assumptions that are hard to collect only through interviews. We referenced public sources such as OECD and World Bank data for macro indicators, US Bureau of Labor Statistics series for wage and services inflation signals, and Eurostat for regional economic context that can influence research spend.
To keep the model grounded in what is actually being adopted, we also reviewed accessible sources such as clinical and neuroscience journals on measurement methods, patents databases for innovation direction, and regulator guidance like GDPR-oriented privacy expectations that affect data collection in studies. Company annual reports, investor presentations, and reputable press helped us cross-check offering mix shifts between hardware, software, and services, along with typical engagement formats. We also used paid subscriptions for company financials and news intelligence, plus patent databases, mainly to speed up validation of public signals. These are illustrative sources only, and many other references were used to collect, verify, and clarify data points.
Primary Interviews and Surveys
Primary interviews and surveys were run with a mix of neuromarketing service providers, enabling technology teams, and buyer side stakeholders from consumer brands, agencies, and research teams. We covered APAC, EMEA, and the Americas so regional privacy constraints, research budgets, and adoption patterns could be checked, and then assumptions such as utilization, pricing, and project mix were tuned to what practitioners describe in day to day delivery.
Distribution of primary research fieldwork respondents
| Company type | Respondent position | Region |
|---|---|---|
| Top tier: 29% | CXOs: 14% | APAC: 42% |
| Mid tier: 56% | Functional/Unit leaders: 28% | EMEA: 37% |
| Smaller Players: 15% | Managers: 58% | Americas: 21% |
Market-Sizing & Forecasting
Market sizing was constructed using a top-down approach where the addressable demand pool is rebuilt from marketing and insights spending, and then filtered by the share that uses neuro and biometric measurement in active research programs. To keep the totals from drifting, we corroborated the outputs with selective bottom-up approximations, such as sampled average project fees multiplied by likely annual study volumes, plus cross-checks against the supplier mix of hardware, software, and services.
A few practical inputs that were used (as examples) include: the pace of brand and agency adoption of tools like EEG and eye tracking, average study cycle time and utilization for lab and remote setups, the split of services versus software subscriptions, regional pricing differences driven by wage levels, and privacy compliance effort that can change project cost and feasibility. When gaps showed up for smaller markets or niche applications, we used proxy ratios from similar buyer cohorts and then normalized them through interview feedback before locking the final totals.
For forecasting, scenario analysis was used with a short list of drivers that can be explained and updated, such as ad spend outlook, growth in digital experience testing, and the rate at which noninvasive measurement tools get embedded into standard research workflows. Final year by year growth paths were then adjusted to keep them consistent with what respondents described in budgets and procurement cycles.
Data Validation & Update Cycle
Validation is done through multiple checks so one weak data point does not decide the final number. We compare model outputs against independent signals like regional research spending direction, technology adoption cues, and observed shifts in offering mix. When there are large variances, we trace them back to the specific assumption that caused the jump.
Before sign-off, the work is reviewed in steps, including internal peer review and follow-up outreach when assumptions look stretched (for example, if implied pricing changes faster than what buyers report as acceptable). Reports are refreshed annually, and interim updates are added when there are material events that can move adoption or pricing, such as major regulatory changes or sharp macro swings. Right before delivery, a final pass is completed so clients receive the most current view available.
Mordor Intelligence's Neuromarketing Market Size Versus Other Published Estimates
Published neuromarketing market values often differ, even when they look like they describe the same space. The spread usually comes from what is counted as neuromarketing, which revenue streams are included, the year used as the current market point, and how quickly pricing and adoption are assumed to move.
Some published estimates expand the scope to include broader implicit testing or generalized customer experience programs that do not always involve neuro or biometric measurement. In Mordor Intelligence sizing, revenue is counted only when the engagement is tied to recognized neuromarketing technologies and delivery formats (hardware, software, and services), and adjacent marketing analytics work is kept out to avoid inflating totals.
Benchmark comparison
| Source | Market Size | Gaps in Research Methodology |
|---|---|---|
| Mordor Intelligence | USD 1.83 B (2026) | |
| Global Publisher A | USD 1.57 B (2024) | Uses an earlier base year and applies a faster growth profile over a longer window, which can understate current adoption levels if 2025 to 2026 pricing and project mix changes are not refreshed. |
| Industry Publisher B | USD 1.79 B (2025) | Often blends technique-led categories (for example, implicit testing methods) with neuromarketing revenue, which can pull in adjacent research spend that is not consistently delivered using neuro or biometric measurement tools. |
The table shows that the main differences are timing and what each publisher decides to include as a paid neuromarketing engagement. By keeping the scope tied to identifiable technologies and delivery revenue, and then validating adoption and pricing through interviews, we end up with a market number that is easier to trace back to clear inputs and repeatable steps.


Key Questions Answered in the Report
How large is the neuromarketing market in 2026 and what is its growth outlook?
The neuromarketing market size is USD 1.83 billion in 2026 and is projected to expand to USD 2.53 billion by 2031, registering a 6.76% CAGR.
Which end-user segment is growing fastest in neuromarketing adoption?
Healthcare and pharma applications lead growth at a 7.12% CAGR through 2031 as firms apply neuroscience to patient engagement and drug-marketing strategies.
What technology segment is gaining share against electroencephalography?
Functional near-infrared spectroscopy is pacing at a 7.35% CAGR due to its portability and integration with immersive platforms, narrowing the gap with EEG.
Which region offers the highest growth potential for neuromarketing vendors?
Asia Pacific is the fastest-growing geography with a 7.83% CAGR, driven by rapid digitalization and supportive government investment in neurotechnology.
How do privacy regulations influence neuromarketing platform design?
Laws such as California SB 1223 and GDPR force vendors to adopt opt-in consent, federated learning, and differential privacy, adding compliance cost but creating trust-based competitive advantages.
What recent strategic moves signal consolidation in the neuromarketing field?
Apple's USD 22 million purchase of Datakalab and Smart Eye's acquisition of iMotions demonstrate growing interest from technology majors seeking embedded neural-insight capabilities.
Page last updated on:


 Your data is secure and never sold or shared.


