Network Forensics Market Size and Share
Market Overview
| Study Period | 2021 - 2031 |
|---|---|
| Market Size (2026) | USD 2.96 Billion |
| Market Size (2031) | USD 5.76 Billion |
| Growth Rate (2026 - 2031) | 14.23% CAGR |
| Fastest Growing Market | Asia Pacific |
| Largest Market | North America |
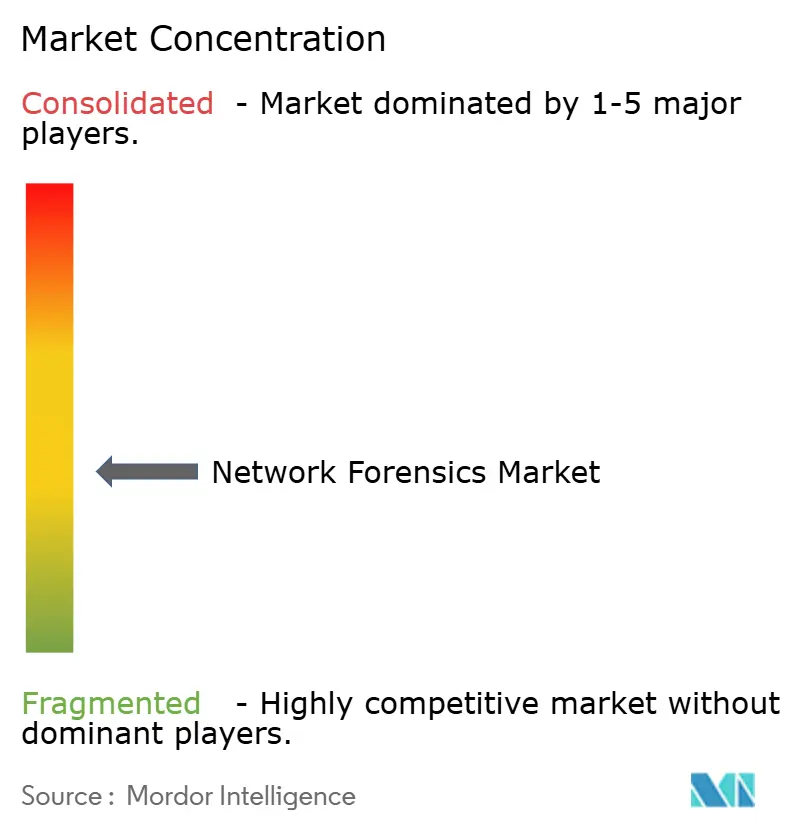
| Market Concentration | Medium |
Major Players
*Disclaimer: Major Players sorted in no particular order Image © Mordor Intelligence. Reuse requires attribution under CC BY 4.0. |
|
Network Forensics Market Analysis by Mordor Intelligence
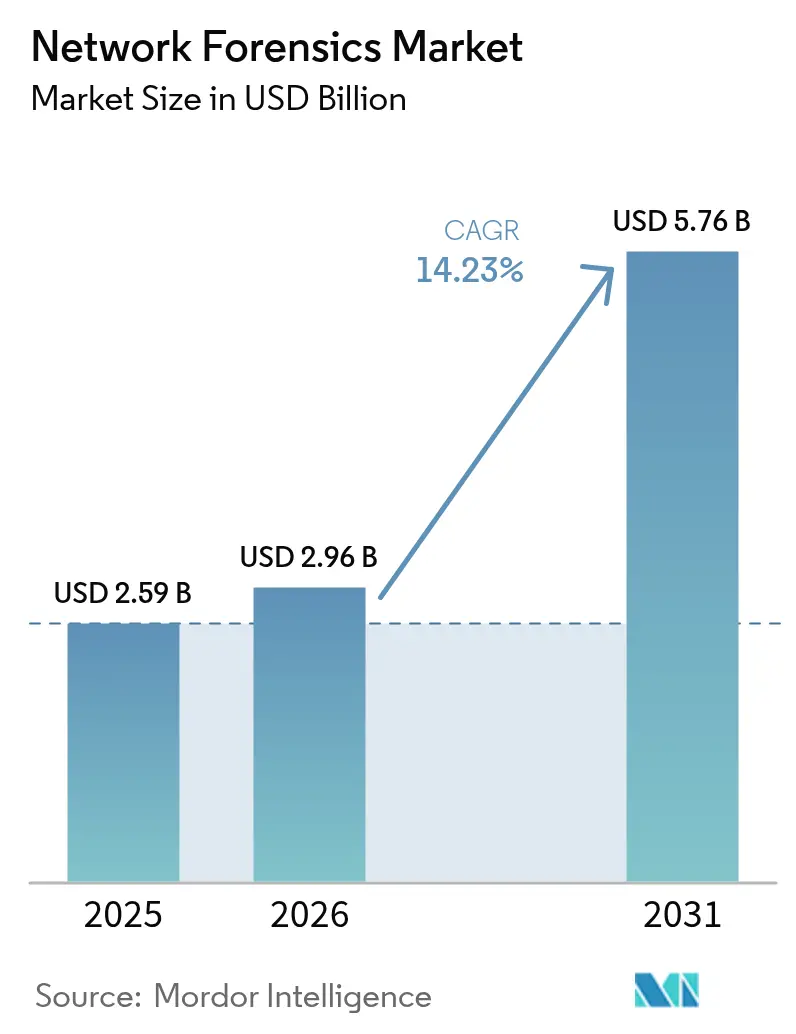
Network forensics market size in 2026 is estimated at USD 2.96 billion, growing from 2025 value of USD 2.59 billion with 2031 projections showing USD 5.76 billion, growing at 14.23% CAGR over 2026-2031. The adoption curve is steep because packet-level visibility has become indispensable for rapid breach diagnosis, regulatory reporting and cyber-insurance compliance. Spending momentum is especially strong where hybrid-cloud traffic, 5G roll-outs and encrypted east-west flows expose blind spots that traditional perimeter tools overlook. Vendors are therefore embedding forensic functionality into Network Detection and Response (NDR) platforms, shrinking tool sprawl and lowering mean-time-to-respond. Demand is also lifted by insurers that now require packet evidence for claims validation and by regulators such as the SEC and the EU’s Digital Operational Resilience Act, which mandate timely, well-documented incident disclosure.[1]Fortinet, "What Is The Digital Operational Resilience Act (DORA)?", www.fortinet.com
Key Report Takeaways
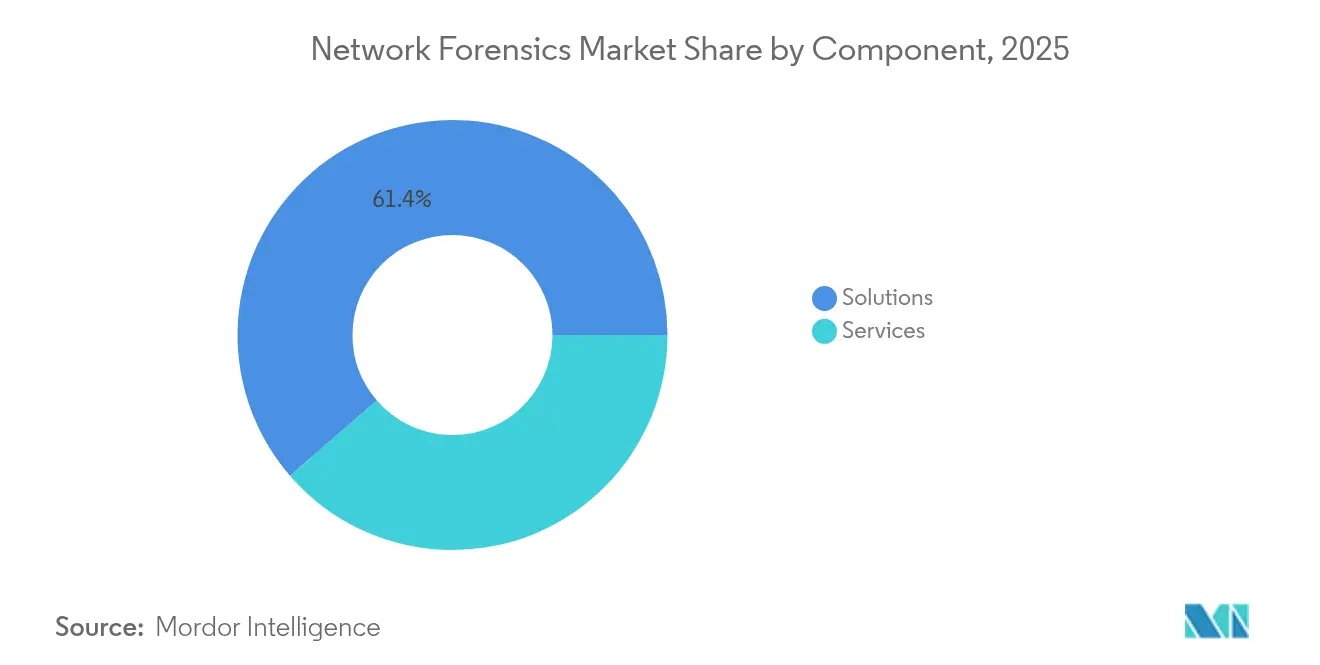
- By component, Solutions led with 61.35% of network forensics market share in 2025, while Services are set to expand at an 17.75% CAGR through 2031.
- By deployment model, on-premise installations held 52.20% of the network forensics market size in 2025; cloud-hosted options are projected to grow at a 22.05% CAGR between 2026-2031.
- By organization size, large enterprises commanded 57.30% share of the network forensics market size in 2025; small and mid-sized enterprises (SMEs) register the fastest growth at 18.95% CAGR to 2031.
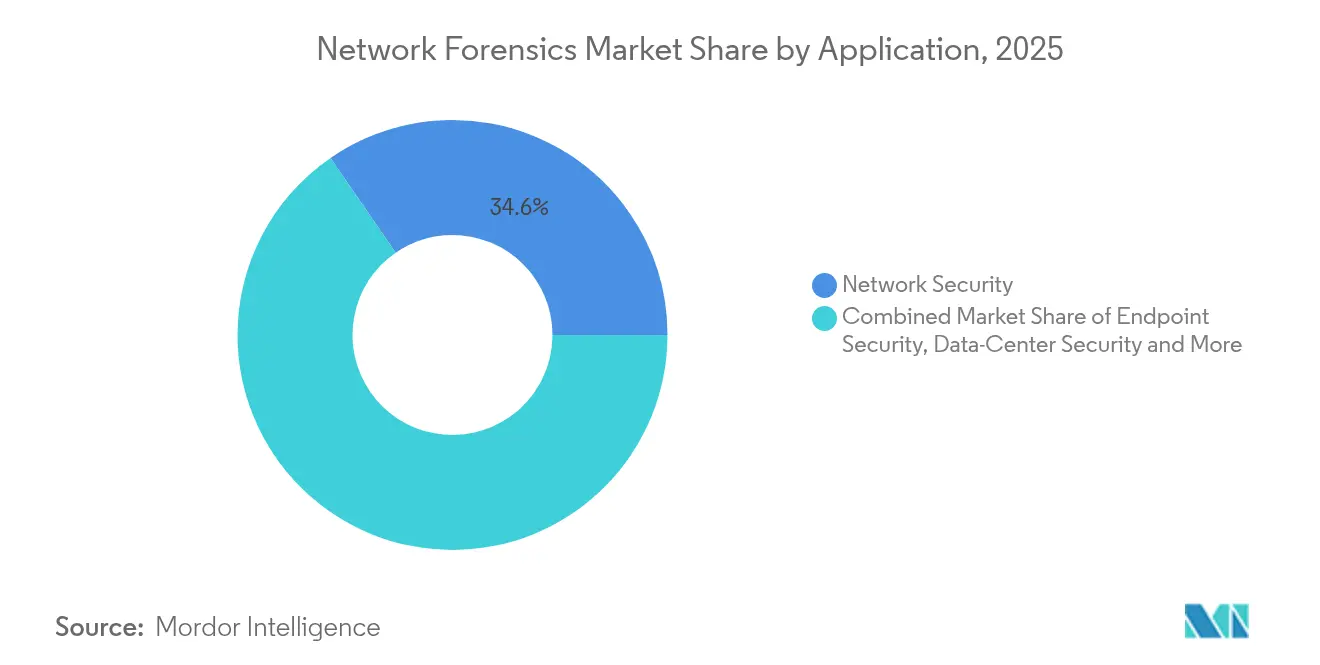
- By application, Network Security accounted for 34.60% of network forensics market share in 2025, whereas Endpoint Security is forecast to rise at a 20.6% CAGR through 2031.
- By end-user industry, BFSI led with 27.45% revenue share in 2025; Healthcare is advancing at a 17.3% CAGR to 2031.
Note: Market size and forecast figures in this report are generated using Mordor Intelligence’s proprietary estimation framework, updated with the latest available data and insights as of 2026.
Global Network Forensics Market Trends and Insights
Drivers Impact Analysis*
| Driver | (~) % Impact on CAGR Forecast | Geographic Relevance | Impact Timeline |
|---|---|---|---|
| Proliferation of cloud & hybrid IT traffic visibility needs | +3.2% | Global (North America & Europe core) | Medium term (2-4 years) |
| Escalating frequency & sophistication of cyber-attacks | +4.1% | Global | Short term (≤ 2 years) |
| Stringent breach-reporting mandates (GDPR, SEC, DORA) | +2.8% | North America & EU, spillover to APAC | Medium term (2-4 years) |
| Convergence of NDR & forensics reducing tool sprawl | +1.9% | Global, early adoption in North America | Medium term (2-4 years) |
| 5G standalone roll-outs expanding east-west traffic capture | +1.5% | APAC, North America, Europe | Long term (≥ 4 years) |
| Cyber-insurance policies mandating packet-level evidence | +2.3% | North America & Europe, emerging APAC | Short term (≤ 2 years) |
| Source: Mordor Intelligence | |||
Proliferation of Cloud & Hybrid IT Traffic Visibility Needs
Cloud migration has outpaced traditional monitoring, leaving 73% of enterprises unable to derive actionable insight from existing toolsets. East-west traffic among ephemeral workloads often vanishes before legacy collectors capture it, prompting demand for cloud-native capture engines that automate evidence gathering across multiple IaaS and PaaS domains. Emerging offerings integrate packet capture, artifact preservation and timeline reconstruction in a single workflow, improving investigative efficiency and supporting consistent policy enforcement across on-premises, public cloud and hybrid environments. Providers have begun to embed smart storage tiering, enabling long-term retention without linear cost escalation and ensuring regulators can audit forensic evidence on demand.
Escalating Frequency & Sophistication of Cyber-Attacks
Global breach costs climbed to USD 4.88 million in 2024, while credential-theft incidents surged 84%, fueling adoption of network analytics that surface anomalous authentication spikes and lateral-movement beacons.[2]Arthur J. Gallagher, "2025 Cyber Insurance Market Conditions Outlook, www.ajg.com Healthcare institutions remain under siege as 93% encountered a breach within three years, pushing them to deploy continuous packet capture that pinpoints dwell time and attack provenance. [3] TechMagic, "Top 5 Healthcare Cyber Threats and How to Avoid Them.", www.techmagic.co Enterprises now integrate enriched network telemetry into threat-hunting routines that cross-reference endpoint, identity and cloud logs, raising the bar for adversaries and accelerating post-incident forensics for legal, regulatory and insurance stakeholders.
5G Standalone Roll-outs Expanding East-West Traffic Capture
5G’s service-based architecture segments traditional monoliths into discrete cloud-native functions, multiplying east-west session density. Manufacturing and healthcare pilots already rely on 5G slices that handle telemetry, robotics and imaging workloads, yet these carry fresh exposure points. Specialized probes decode GPRS Tunnelling Protocol (GTP), HTTP/2 and HTTP/3 headers at line rate, letting operators visualize subscriber behaviour and thwart signaling-layer abuse. Scalable, containerised capture nodes provide elastic packet buffering so carriers keep pace with quadrupling throughput expectations by 2028.
Cyber-Insurance Policies Mandating Packet-Level Evidence
Underwriters tightened terms as premiums swelled alongside ransomware severity. Policies now stipulate demonstrable packet evidence for claims adjudication, elevating network forensics from best practice to board-level requirement. Customer enquiries increasingly originate from risk-transfer conversations rather than security budgets, broadening the addressable base beyond highly regulated verticals. Insurers also recommend minimum retention windows, compelling buyers to modernize storage hierarchies and de-duplication strategies.
Restraints Impact Analysis*
| Restraint | (~) % Impact on CAGR Forecast | Geographic Relevance | Impact Timeline |
|---|---|---|---|
| Shortage of skilled packet-level investigators | -1.8% | Global, severe in APAC | Medium term (2-4 years) |
| High CAPEX of >40 Gbps capture appliances | -1.6% | Emerging markets, SMEs worldwide | Short term (≤ 2 years) |
| Source: Mordor Intelligence | |||
Shortage of Skilled Packet-Level Investigators
Demand for information-security analysts is projected to expand 32% between 2022-2032, yet universities and training pipelines lag, leaving 54% of employers unable to fill packet-analysis roles.[4]Drummond, Rachel, "Computer Forensics Examiner Job Outlook & Salary Info." Forensics Colleges, www.forensicscolleges.comThe deficit inflates salary baselines beyond USD 119,000 and amplifies operational risk when alerts outstrip triage capacity. Organizations respond by shifting routine parsing to AI-assisted playbooks, outsourcing level-1 monitoring to managed service partners and prioritizing tool usability so non-specialists can navigate packet timelines with minimal ramp-up.
High CAPEX of >40 Gbps Capture Appliances
Enterprises processing tens of petabytes per month often face multi-million-dollar price tags for top-tier probes and petascale storage. The financial hurdle is acute for SMEs and public-sector agencies whose compliance mandates still dictate two-week retention. Next-generation offerings emphasize FPGA-accelerated de-duplication, smart indexing and cloud-burst tiering, trimming on-premise hardware footprints. Consumption-based licensing and appliance virtualization further democratize adoption and permit incremental scaling aligned with traffic growth.
*Our forecasts treat driver/restraint impacts as directional, not additive. The impact forecasts reflect baseline growth, mix effects, and variable interactions.
Segment Analysis
By Component: Solutions Prevail as Service Uptake Accelerates
Solutions generated 61.35% of network forensics market revenue in 2025, a position powered by demand for high-speed packet capture, behavioural analytics and encrypted-traffic visibility. Feature velocity is brisk, with vendors embedding machine-learning algorithms that establish baseline traffic profiles and surface deviations in seconds. The services segment is smaller today yet expands at an 17.75% CAGR because organizations need integration, tuning and continuous investigation support while talent remains scarce. Providers bundle assessment, incident-response retainers and managed detection to convert one-time licences into recurring revenue streams. Over the forecast horizon, joint go-to-market programs between hardware vendors and global system integrators will further amplify adoption, especially in regulated industries that require 24-hour evidence retrieval.
Investment patterns suggest that automation-ready solutions will dominate capital budgets, while advisory services grow as strategic overlays that maximize tooling value. The blended model supports life-cycle management from deployment to incident post-mortems, ensuring the network forensics market retains strong pull across diverse buyer personas.


By Deployment Mode: Cloud Momentum Continues
On-premise deployments maintained 52.20% share of network forensics market size in 2025 because many financial, government and defense entities require local custody of evidence. Nevertheless, cloud-native deployments soar at a 22.05% CAGR as traffic migrates to SaaS, IaaS and containerised stacks. Cloud collectors orchestrate evidence gathering across regions, auto-scale during volumetric events and decouple storage from compute, slashing upfront expense. Hybrid architectures emerge where sensitive data stays on site, yet burst workloads and less regulated segments leverage cloud collectors.
Platform providers now ship lightweight sensors deployable in Kubernetes clusters or as side-cars, ensuring parity of telemetry between virtual networks and physical switch spans. Compliance teams value the immutable audit trails that cloud object stores enable, while finance teams appreciate opex-based consumption that aligns spend with seasonal traffic variance. Together these dynamics reinforce an enduring pivot toward distributed collection topologies within the broader network forensics market.
By Organization Size: Large Enterprises Lead While SME Adoption Quickens
Large enterprises accounted for 57.30% of 2025 revenue thanks to expansive traffic matrices that demand multi-gigabit capture fabrics. These organizations often integrate forensics into security information and event management pipelines to create unified evidence hubs. They also pilot AI-driven investigations that accelerate root-cause discovery and support red-team validation campaigns. SMEs, although historically constrained by budgets and staffing, now adopt cloud-delivered forensics at a 18.95% CAGR, aided by simplified pricing tiers and cyber-insurance mandates.
Vendor roadmaps increasingly feature easy-to-deploy appliances with guided workflows, enabling resource-limited teams to achieve compliance benchmarks. As economies of scale lower price points, SME penetration is expected to inject new volume into the network forensics market, broadening addressable demand beyond Fortune 1000 customers and national governments.
By Application: Network Security Dominates, Endpoint Integration Surges
Network Security held 34.60% of network forensics market share in 2025 because packet capture remains the bedrock for lateral-movement detection and infrastructure hygiene. Continuous full-packet capture delivers evidentiary artefacts essential for root-cause analysis and prosecution. Endpoint Security posts a 20.6% CAGR as organizations pair host telemetry with network flows to achieve layered visibility. Correlated analytics expose evasion tactics that bypass single vantage points, thereby enriching detection quality.
Data-center security also gains traction as east-west traffic within software-defined fabrics obscures attacker pathways. Operators deploy micro-segmented tap architectures coupled with high-speed indexers that replay conversations in microseconds, sustaining service-level agreements and forensic fidelity. Application-specific monitoring is now bundled into observability stacks, allowing DevSecOps teams to troubleshoot performance and security anomalies via the same data plane—a convergence that deepens market stickiness.
By End-User Industry: BFSI Leads, Healthcare Rises Quickly
Financial institutions represented 27.45% of 2025 sales given stringent fraud-monitoring, audit and compliance duties. Real-time packet capture facilitates dispute arbitration, protects payment rails and supports regulator examinations. Healthcare, expanding at 17.3% CAGR, pushes vendors to deliver HIPAA-aligned evidence chains and ransomware containment playbooks. Digital front-door initiatives such as telemedicine widen attack surfaces, making network telemetry indispensable for post-breach diagnosis.
Telecom operators embed forensics to safeguard 5G core functions and assure service uptime, while government and defense agencies require deep traffic reconstruction to counter espionage campaigns. Retailers capture card-holder data flows for PCI-DSS audits, and manufacturers map operational technology traffic to uncover malware that targets programmable-logic controllers. Combined, these varied requirements sustain multi-vertical growth across the network forensics market.
Geography Analysis
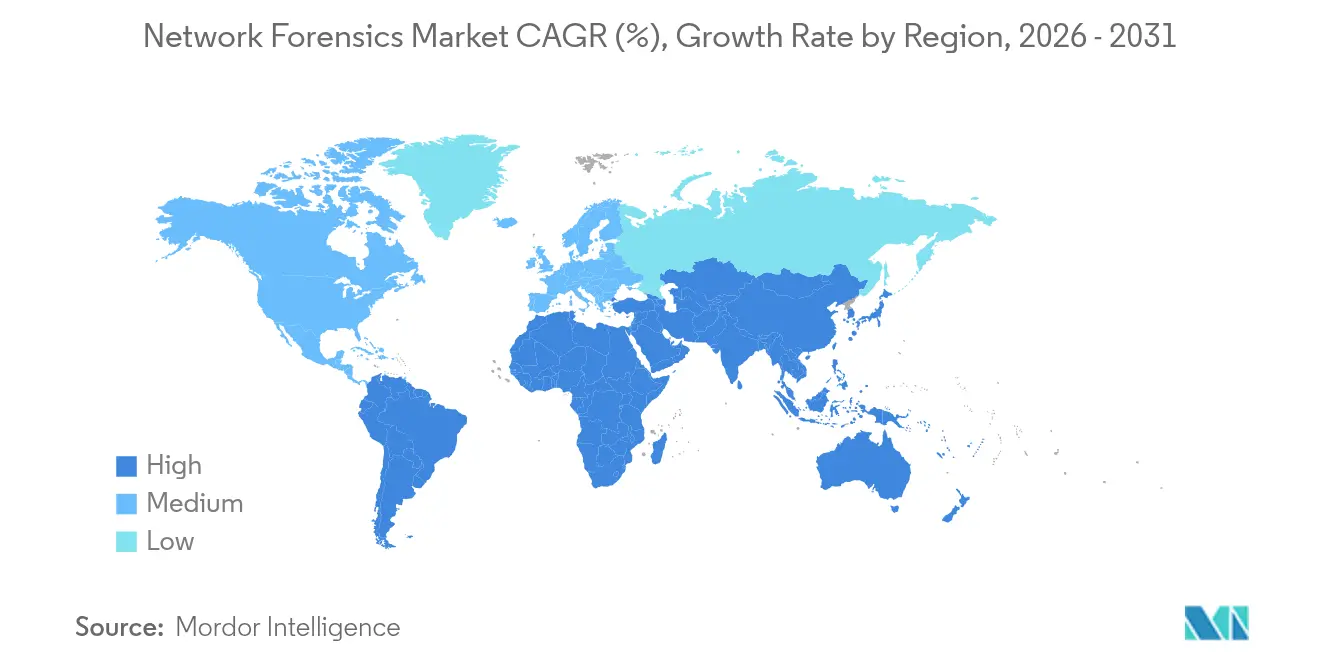
North America held 39.60% share in 2025, driven by SEC disclosure rules that enforce four-day breach reporting and by an advanced cyber-insurance ecosystem that ties coverage to evidence quality. U.S. enterprises deploy AI-enabled analysis to overcome skills shortages and maintain comprehensive logs for potential litigation or regulatory inquiry. Canada follows a comparable trajectory, underpinned by mandatory privacy breach notifications and concentrated presence of critical infrastructure operators.
Europe captured 27.70% of network forensics market revenue in 2025, benefiting from GDPR enforcement and the January 2025 start of DORA. Banking hubs in the United Kingdom, Germany and France doubled packet-capture budgets to achieve 24-hour incident notification. Public-sector projects focused on 5G corridors channel EUR 865 million (USD 931 million) into network build-outs, prompting new security monitoring layers. Cross-border data-sharing frameworks inside the EU also stimulate demand for standardized forensic workflows that meet multi-jurisdictional evidence admissibility criteria.
Asia-Pacific is the fastest-growing theatre with a 17.65% 2026-2031 CAGR. China’s digital-finance expansion, India’s 5G auctions and Australia’s critical-infrastructure reforms create sustained opportunities. South Korea’s digital forensics sector alone is projected at USD 3.52 billion by 2025, reflecting public-private investment in national cyber-resilience. While skills shortages remain acute, managed security services offset local gaps and accelerate uptake among medium-sized enterprises. The region’s exposure to state-sponsored campaigns further elevates the relevance of network forensics market tools that can reconstruct sophisticated, multi-stage intrusions.

Competitive Landscape
The vendor field shows moderate consolidation as large cybersecurity suites absorb specialized forensics startups, aiming to deliver end-to-end security fabrics. Cisco’s 2024 acquisition of Splunk embeds full-stack observability and packet replay into a single portfolio, enabling cross-sell synergies across its installed base. Palo Alto Networks enhanced its Prisma Access service with TLS 1.3 decryption, strengthening encrypted-traffic analysis and locking customers into its cloud security platform.
Specialists such as ExtraHop, NIKSUN and Darktrace differentiate through FPGA-accelerated capture, protocol-agnostic analytics and self-learning algorithms that adapt to dynamic baselines. They also partner with traffic-capture hardware firms to bypass high CAPEX hurdles via joint reference architectures. Axellio’s alliance with Garland Technology and Mira Security illustrates this strategy by combining tap visibility, traffic decryption and high-speed storage distribution into a bundled solution.
Strategic road maps converge on three imperatives: encrypted-traffic visibility, cloud-agnostic deployment and analyst productivity. Vendors invest in AI copilots that auto-generate incident timelines, recommend investigative next steps and surface policy gaps. Meanwhile, open API frameworks facilitate integration with Security Orchestration, Automation and Response (SOAR) systems, cementing the network forensics market as a core telemetry source for fully automated defense pipelines.
Network Forensics Industry Leaders
-
Broadcom Inc. (Symantec Corporation)
-
Cisco Systems Inc.
-
IBM Corporation
-
Netscout Systems Inc.
-
Valvi Solutions Inc.
- *Disclaimer: Major Players sorted in no particular order

Recent Industry Developments
- May 2025: Axellio introduced an out-of-band decryption appliance that processes traffic beyond 200 Gbps, targeting organizations grappling with 95% encryption ratios.
- April 2025: Palo Alto Networks added TLS 1.3 decryption to Prisma Access, simplifying packet capture workflows for downstream analysis.
- February 2025: CrowdStrike unveiled Falcon Go, an affordable endpoint package for SMEs that pairs neatly with cloud-based packet capture to extend evidentiary coverage.
- January 2025: Axellio, Garland Technology and Mira Security formalized a partnership to deliver integrated TLS 1.3 visibility and high-speed packet distribution.


Research Methodology Framework and Report Scope
Market Definitions and Key Coverage
According to Mordor Intelligence, network forensics covers all commercial platforms, probes, and subscription services that capture, store, and replay packet or flow data so incident-response teams can retrace an intrusion across physical, virtual, and cloud networks. The definition purposely folds in analytics engines and retained-traffic repositories while keeping the measurement unit as vendor-recognized revenue.
Scope exclusion: Simple log collectors or SIEM tools that lack packet-level reconstruction are left outside the market boundary.
Segmentation Overview
-
By Component
- Solutions
- Services
-
By Deployment Mode
- On-premise
- Cloud-based
-
By Organization Size
- Small and Medium Enterprises (SMEs)
- Large Enterprises
-
By Application
- Endpoint Security
- Data-Center Security
- Network Security
- Application Security
-
By End-user Industry
- IT and Telecom
- BFSI
- Retail and E-commerce
- Government and Defense
- Healthcare and Life Sciences
- Manufacturing
- Others (Energy, Education)
-
By Geography
-
North America
- United States
- Canada
- Mexico
-
South America
- Brazil
- Rest of South America
-
Europe
- United Kingdom
- Germany
- France
- Rest of Europe
-
APAC
- China
- India
- Japan
- Australia
- Rest of APAC
-
Middle East and Africa
-
Middle East
- Saudi Arabia
- United Arab Emirates
- Turkey
- Rest of Middle East
-
Africa
- South Africa
- Rest of Africa
-
Middle East
-
North America
Detailed Research Methodology and Data Validation
Primary Research
Mordor analysts interviewed security architects at telecom carriers, MSSP product heads, and breach-response consultants across North America, Europe, and Asia Pacific. The discussions balanced desk estimates with live insights on tool utilization rates, contract sizes, and the pace at which packet capture shifts from on-premise appliances to cloud taps.
Desk Research
We began with open data streams, US-CERT advisory volumes, ENISA breach notifications, NIST 800-61 revision notes, and ITU's Global Cybersecurity Index to understand incident density and regulatory triggers by region. Trade association portals such as FIRST and Internet2 supplied penetration-rate clues for high-bandwidth enterprises, while company filings, S-1 statements, and investor decks clarified vendor revenue splits between software licenses and forensic retaining services. Premium datasets from Dow Jones Factiva and D&B Hoovers helped map vendor geography and average selling prices. This list is illustrative; many other public and subscription sources fed baseline checks and clarifications.
Market-Sizing & Forecasting
We anchor the 2025 value by a top-down build that marries incident prevalence to spend: breach frequency x mean investigation hours x average hourly tool cost, calibrated with regional cybersecurity budgets and bandwidth growth. Supplier roll-ups and sampled ASP x unit volumes provide a bottom-up sense check before totals are finalized. Key inputs include: 1) share of encrypted traffic requiring decryption hardware, 2) enterprise 10 Gbps port installations, 3) cloud workload migration ratios, and 4) regulator-mandated log-retention periods. A multivariate regression using bandwidth growth, breach count, and GDP-linked security outlays projects demand to 2030, while scenario analysis adjusts for macro shocks. Data gaps (e.g., private pricing) are bridged with midpoint ranges vetted during expert calls.
Data Validation & Update Cycle
Outputs pass three filters: variance checks against historic spend curves, anomaly flags versus peer cybersecurity segments, and a second analyst review. Reports refresh yearly, and we trigger mid-cycle revisions when material events, major breaches, regulatory deadlines, or landmark M&A shift underlying metrics.
Why Mordor's Network Forensics Baseline Commands Confidence
Published estimates rarely match because firms differ on which revenue buckets, deployment models, and price erosion paths they count.
Our study, refreshed every twelve months, limits scope to packet-level solutions and applies mixed top-down and bottom-up math, whereas others often lift vendor toplines or blend broader digital forensics spend.
Benchmark comparison
| Market Size | Anonymized source | Primary gap driver |
|---|---|---|
| USD 2.59 B (2025) | Mordor Intelligence | |
| USD 3.36 B (2024) | Global Consultancy A | Bundles threat intel analytics and consulting retainers without channel margin adjustments |
| USD 2.50 B (2024) | Trade Journal B | Excludes managed service revenue and assumes uniform ASP growth across regions |
| USD 11.69 B (2024) | Industry Think Tank C | Measures the broader digital forensics arena, adding hardware, mobile, and storage segments |
The comparison shows that headline gaps stem mainly from scope inflation or untested pricing assumptions. By restricting coverage to packet-centric platforms and validating every ratio with primary inputs, Mordor Intelligence delivers a balanced, traceable baseline that decision-makers can rely on.


Key Questions Answered in the Report
What is driving the rapid growth of the network forensics market?
Growth is propelled by stricter breach-reporting laws, the surge in encrypted east-west cloud traffic, and cyber-insurance clauses that now require packet-level evidence.
Which component segment will expand the fastest through 2031?
Services are projected to grow at an 17.75% CAGR as organizations need specialized expertise to deploy, tune and operate forensic platforms amid a global talent shortage.
How does 5G adoption influence network forensics investments?
5G standalone architectures multiply east-west sessions among virtualized functions, so operators require high-speed probes and analytics that can decode new protocols at scale.
Why are SMEs increasingly adopting network forensics solutions?
Cloud-delivered capture tools with pay-as-you-go pricing, coupled with insurer requirements, allow SMEs to secure evidence without large capital expenditure.
Which region offers the highest growth potential after 2026?
Asia-Pacific leads with a forecast 17.65% CAGR, supported by accelerated digitalization in China, India and South Korea and rising investment in managed security services.
How does converging NDR and forensics benefit security teams?
Unified platforms eliminate tool switching, reduce mean-time-to-respond and maintain a single evidence repository, enhancing analyst productivity and lowering operating cost.
Page last updated on:


