
Technology, Media and Telecom
5th MayPricing Strategy for Semiconductor Components
3 Min Read
Network Probe Market Report is Segmented by Component (Solutions and Services), Deployment Mode (On-Premises, and Cloud), End-User (Service Providers, and Enterprises), Probe Type (Passive Probe, Active / Synthetic Probe, and Smart / Hybrid Probe) and Geography. The Market Sizes and Forecasts Regarding Value (USD) for all the Above Segments are Provided.
Market Overview
| Study Period | 2020 - 2031 |
|---|---|
| Market Size (2026) | USD 0.86 Billion |
| Market Size (2031) | USD 1.16 Billion |
| Growth Rate (2026 - 2031) | 6.21 % CAGR |
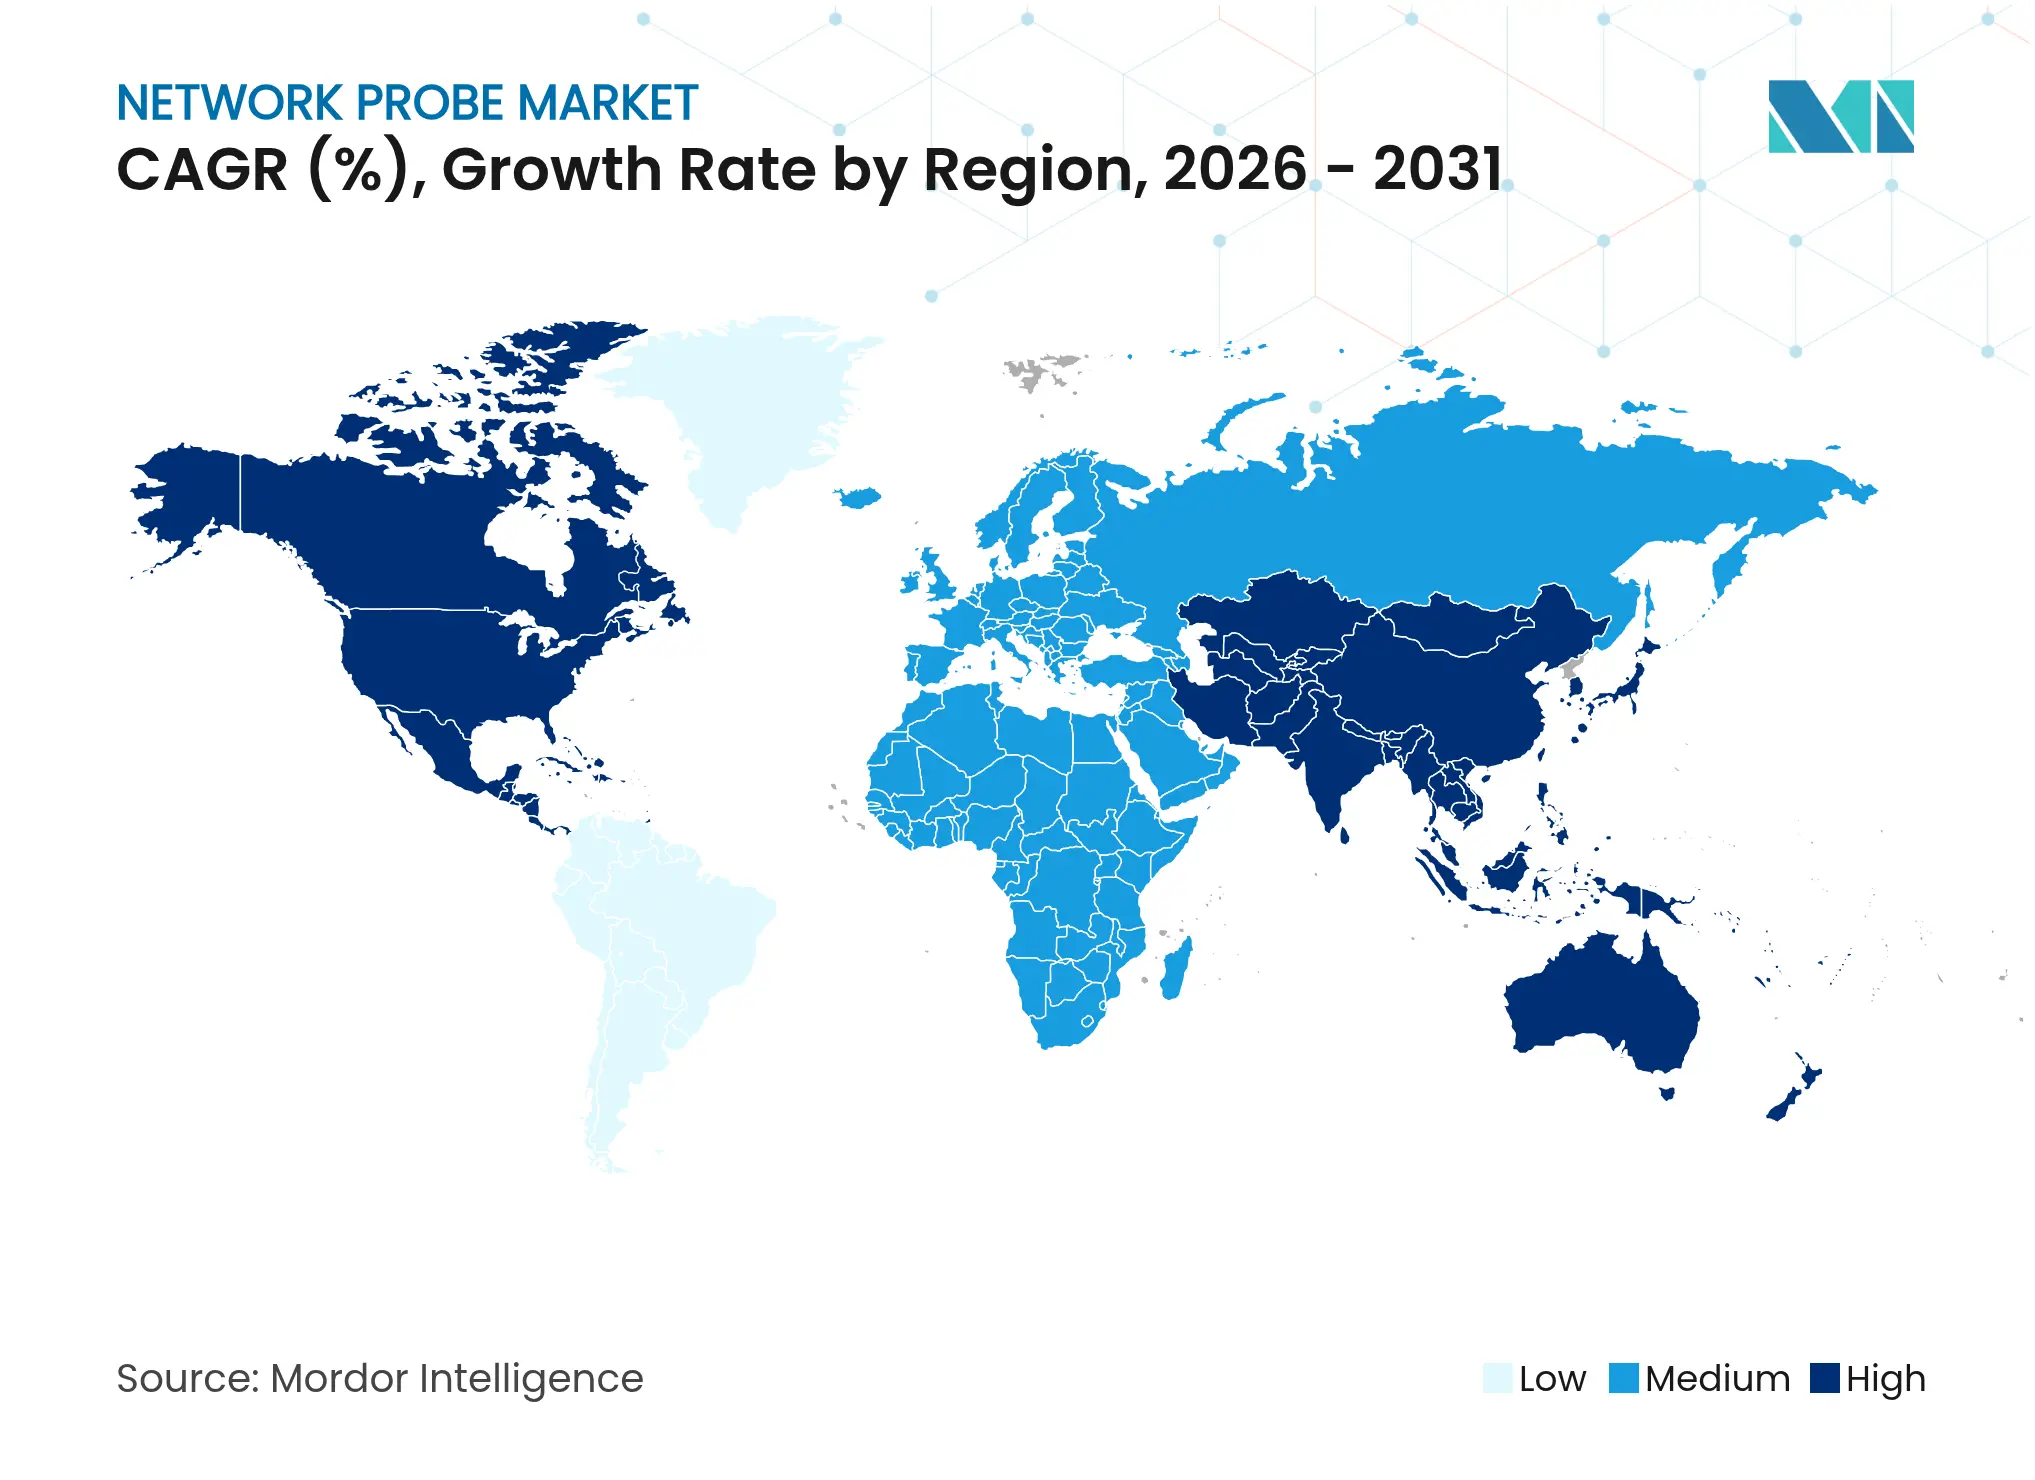
| Fastest Growing Market | Asia Pacific |
| Largest Market | North America |
| Market Concentration | Medium |
Major Players *Disclaimer: Major Players sorted in no particular order. Image © Mordor Intelligence. Reuse requires attribution under CC BY 4.0. |
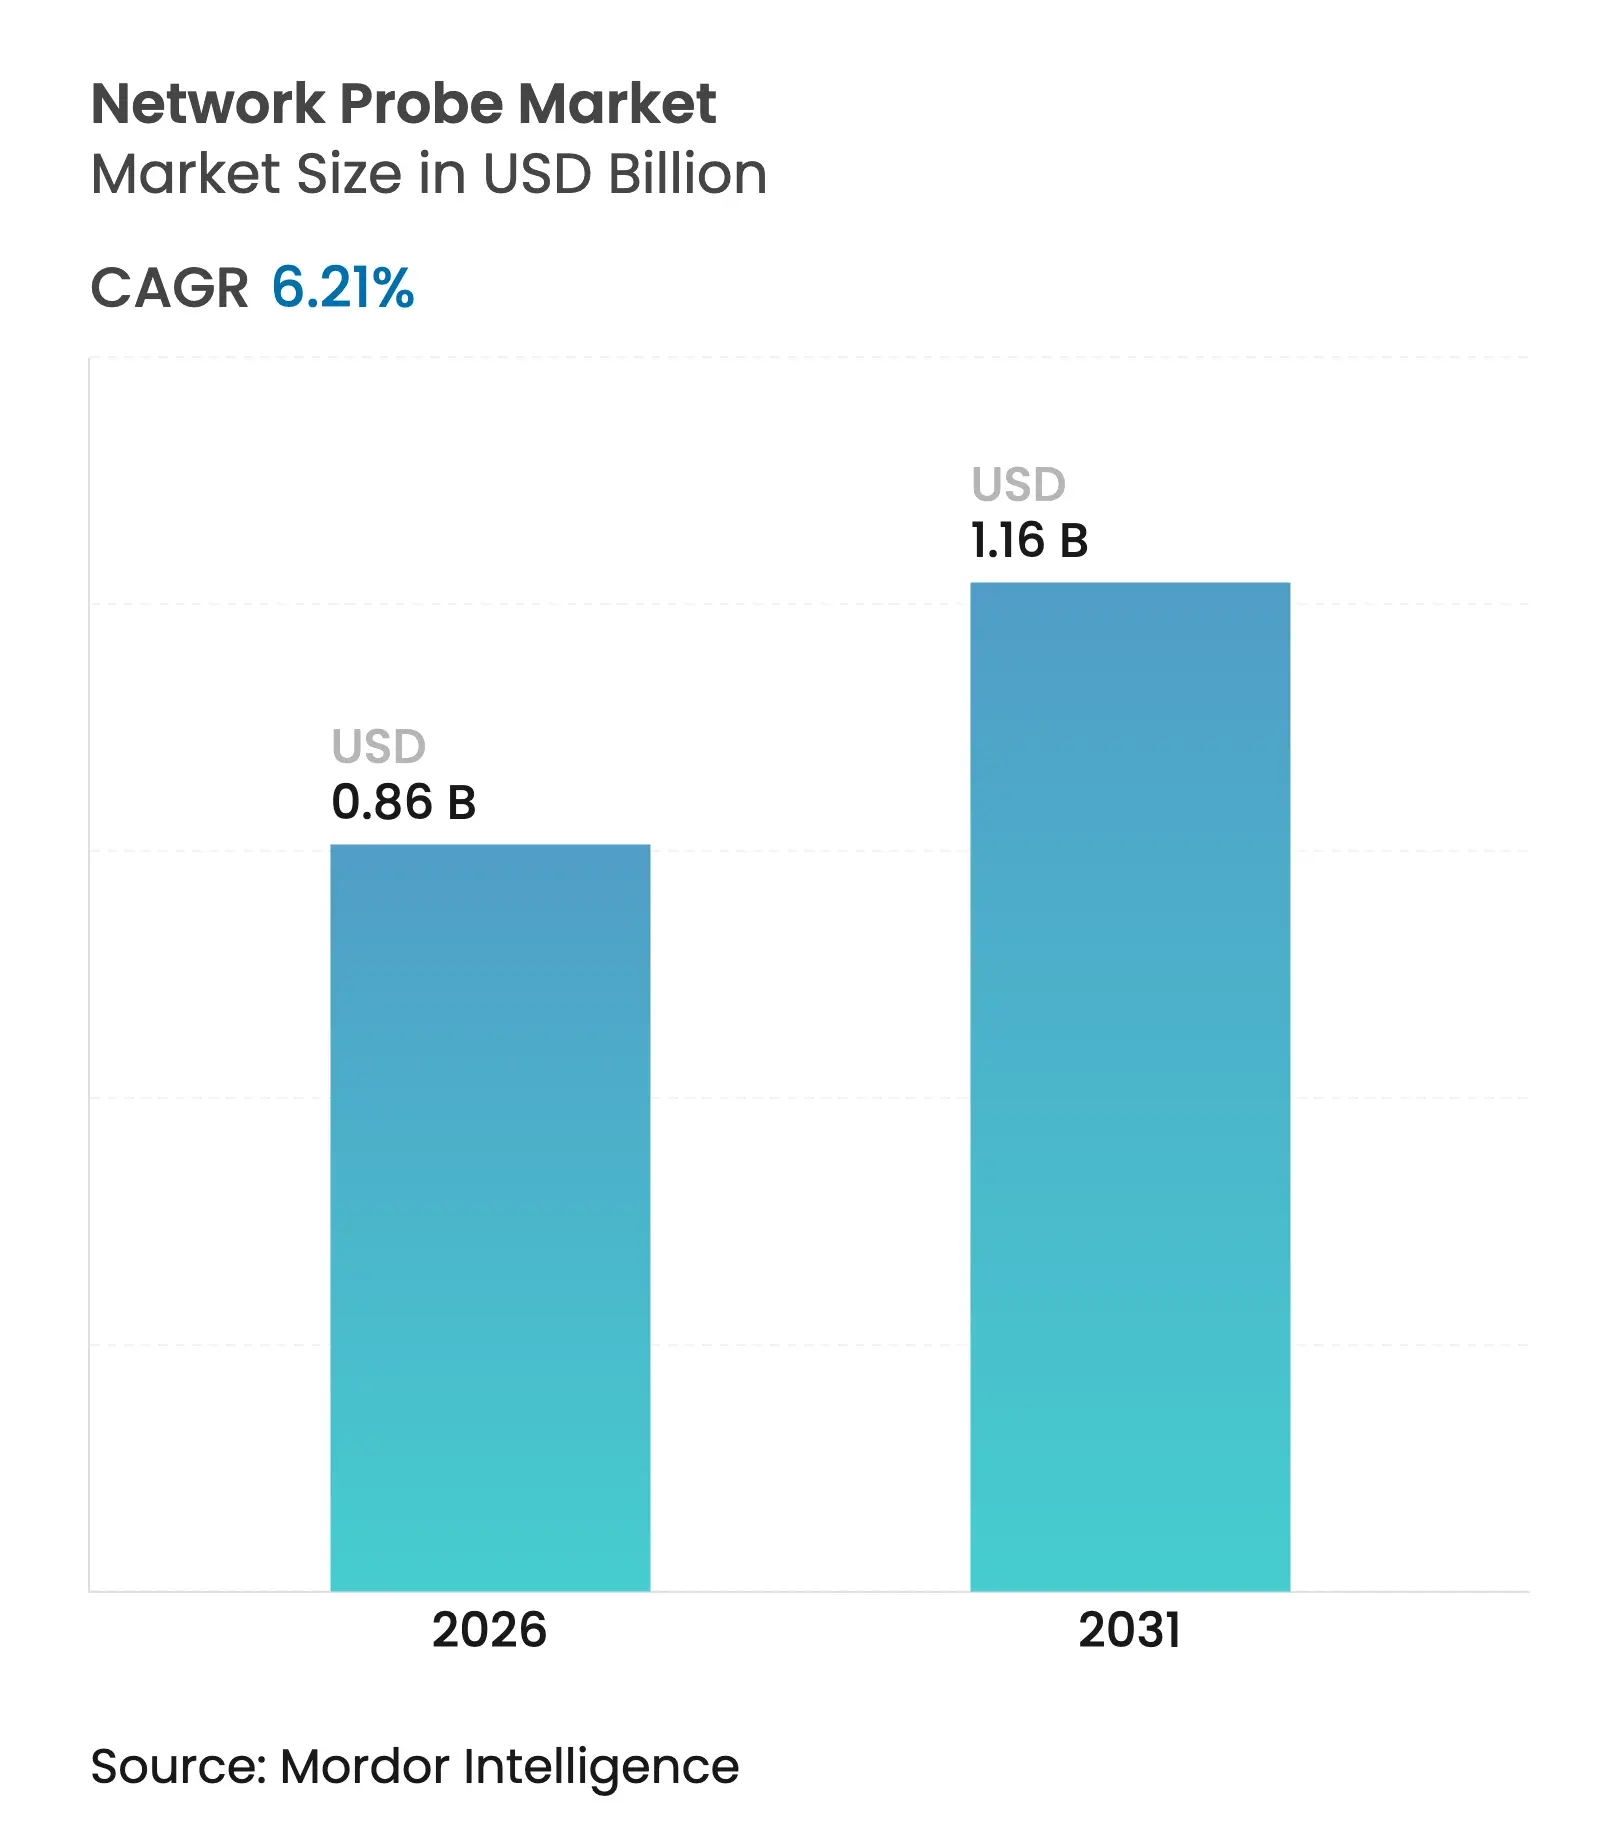
The network probe market size is expected to grow from USD 810 million in 2025 to USD 860.3 million in 2026 and is forecast to reach USD 1162.9 million by 2031 at 6.21% CAGR over 2026-2031. Surging IP traffic from 5G roll-outs, IoT devices, and hyperscaler data center builds is reshaping monitoring requirements. Enterprises and service providers are shifting from reactive troubleshooting to predictive, AI-enhanced observability that ingests line-rate packet data in real time. Vendor roadmaps increasingly center on 400G-ready probes that combine deep-packet inspection with machine-learning analytics, while managed observability offerings help customers close skills gaps in network analytics. Edge computing and private 5G networks add further impetus, demanding visibility across cloud, core, and access domains.
Key Report Takeaways
Note: Market size and forecast figures in this report are generated using Mordor Intelligence's proprietary estimation framework, updated with the latest available data and insights as of 2026.
Drivers Impact Analysis
| Driver | (~) % Impact on CAGR Forecast | Geographic Relevance | Impact Timeline | |||
|---|---|---|---|---|---|---|
Surging IP traffic with 5G and IoT Surging IP traffic with 5G and IoT | +1.8% | Asia-Pacific leading, global relevance | Medium term (2-4 years) | (~) % Impact on CAGR Forecast:+1.8% | Geographic Relevance:Asia-Pacific leading, global relevance | Impact Timeline:Medium term (2-4 years) |
Rapid cloud and virtualization uptake Rapid cloud and virtualization uptake | +1.5% | North America and EU, spreading Asia-Pacific | Short term (≤ 2 years) | |||
Escalating cyber-threat landscape Escalating cyber-threat landscape | +1.2% | Global, critical infrastructure | Short term (≤ 2 years) | |||
AI-driven observability budgets AI-driven observability budgets | +0.9% | North America and EU early adopters | Medium term (2-4 years) | |||
Hyperscaler 400G+ optical networks Hyperscaler 400G+ optical networks | +0.7% | Global data-center hubs | Long term (≥ 4 years) | |||
| Source: Mordor Intelligence | ||||||
Surging IP Traffic with 5G and IoT Proliferation
Mobile data volumes continue to rise in double digits, with Ericsson estimating 5.6 billion 5G subscriptions by 2029 and monthly traffic reaching 237 exabytes[1]Ericsson Mobility Report team, “Ericsson Mobility Report 2024,” ericsson.com. Mid-band 5G delivers sub-1.5 second time-to-content for 97% of user activities, compelling operators to deploy probes that sustain ultra-low-latency inspection. Fixed-wireless access now serves about 9 million North-American premises, adding heterogeneous access links that still require unified observability. Carriers such as China Broadnet are rolling out 400G optical transport built on Huawei’s Kepler OTN, underscoring the need for 400G-capable probes in metro and backbone layers. Generative-AI tools that embed video assistants are beginning to skew uplink patterns, prompting planning teams to reassess capacity models and the associated visibility stack.
Rapid Cloud and Virtualization Uptake
Enterprises migrating to microservices frequently lose east-west visibility, spurring demand for cloud-native probes that instrument every container tap. MantisNet’s containerized visibility fabric uses eBPF to stream metadata without kernel changes, closing blind spots in Kubernetes clusters. Airlines such as United Airlines rely on ThousandEyes SaaS probes to supervise more than 9,000 devices across a hybrid estate. Controller-based fabrics like Arista DANZ broker packets across physical and virtual domains, while LogicMonitor’s new Singapore point-of-presence shows hyperscalers’ push for in-region observability services.
Escalating Cyber-Threat Landscape Demanding Real-Time Visibility
EU organizations now dedicate 9% of IT budgets to security, doubling average cybersecurity spend to EUR 1.4 million as NIS 2 tightens breach reporting[3]European Union Agency for Cybersecurity, “NIS 2 Readiness Report 2024,” enisa.europa.eu. NETSCOUT’s extended agreement with Vodafone exemplifies operators’ use of wire-speed probes to correlate 5G packet flows and customer experience. Behavioural NDR suppliers such as Flowmon apply machine learning to packet records, revealing lateral movement inside encrypted traffic. Public agencies from U.S. state governments to European municipalities integrate deep-packet observability into zero-trust blueprints, reinforcing the probe upgrade cycle.
AI-Driven Observability Budgets Expanding to Packet-Level Probes
Intel’s in-band network telemetry embeds per-packet markers that analytics engines mine for congestion patterns. HPE’s Aruba Networking Central adds machine-learning insight to Wi-Fi, LAN, and WAN flows, reducing mean time to resolution in branch roll-outs. BMC’s 2025 purchase of Netreo folds OpenTelemetry probes into its AIOps stack, while Fortinet’s FortiAIOps auto-correlates SD-WAN anomalies and recommends fixes. Such investments signal a pivot from simple alerting to predictive remediation driven by packet-level evidence.
Hyperscaler Self-Build Optical Networks Needing 400G+ Probes
Web-scale operators increasingly light private subsea and metro fiber; monitoring those links requires probes that parse coherent-optics telemetry at line rate. Operators of multi-terabit fabrics now specify 400G-capable inspection as part of their acceptance testing, aligning procurement cycles with the next wave of merchant-silicon routers. Vendors that combine flow sampling, payload context, and silicon photonics tap modules are best positioned to win future deployments.
Restraint Impact Analysis
| Restraint | (~) % Impact on CAGR Forecast | Geographic Relevance | Impact Timeline | |||
|---|---|---|---|---|---|---|
Limited technical granularity in legacy probes Limited technical granularity in legacy probes | -0.8% | Global, aging enterprise stacks | Short term (≤ 2 years) | (~) % Impact on CAGR Forecast:-0.8% | Geographic Relevance:Global, aging enterprise stacks | Impact Timeline:Short term (≤ 2 years) |
High cost of 400G line-rate DPI High cost of 400G line-rate DPI | -1.2% | Global, cost-sensitive markets | Medium term (2-4 years) | |||
Service-mesh sidecar overhead Service-mesh sidecar overhead | -0.6% | NA and EU cloud-native deployments | Long term (≥ 4 years) | |||
| Source: Mordor Intelligence | ||||||
Limited Technical Granularity in Legacy Probes
SNMP polling and sampled NetFlow struggle once link speeds exceed 100 Gbps, with switch ASIC buffers masking micro-bursts that impair latency-sensitive traffic. Research highlights that 1:10 000 flow sampling misses short-lived connections, eroding forensic accuracy during DDoS events. Enterprises that rely on old appliances must therefore fund forklift replacements or supplement with software sensors, stretching constrained budgets and slowing refresh cycles.
High Cost of Deep-Packet Inspection at 400G Line-Rate
Stateful inspection at 400G demands custom NPUs or FPGA pipelines such as NVIDIA/Mellanox NPS-400, whose bill of materials exceeds mainstream switch silicon. Academic projects targeting 100 Gbps intrusion detection still require clustered x86 nodes plus traffic-distribution devices, doubling rack footprint and power draw. Semiconductor lead times of 50 weeks for networking ASICs inflate capital outlays and delay deployment schedules, especially for operators with procurement freezes.
Service-Mesh Sidecar Overhead Reducing External-Probe Demand
Cloud-native teams increasingly embed Envoy-based sidecars that expose L7 telemetry, diminishing reliance on tap-based probes for east-west traffic. Yet the extra compute overhead can reach 15% in latency-sensitive workloads, so some operators still favor external passive capture in high-performance paths. The trade-off between instrumentation granularity and resource consumption remains a design constraint, moderating probe spending in microservices environments.
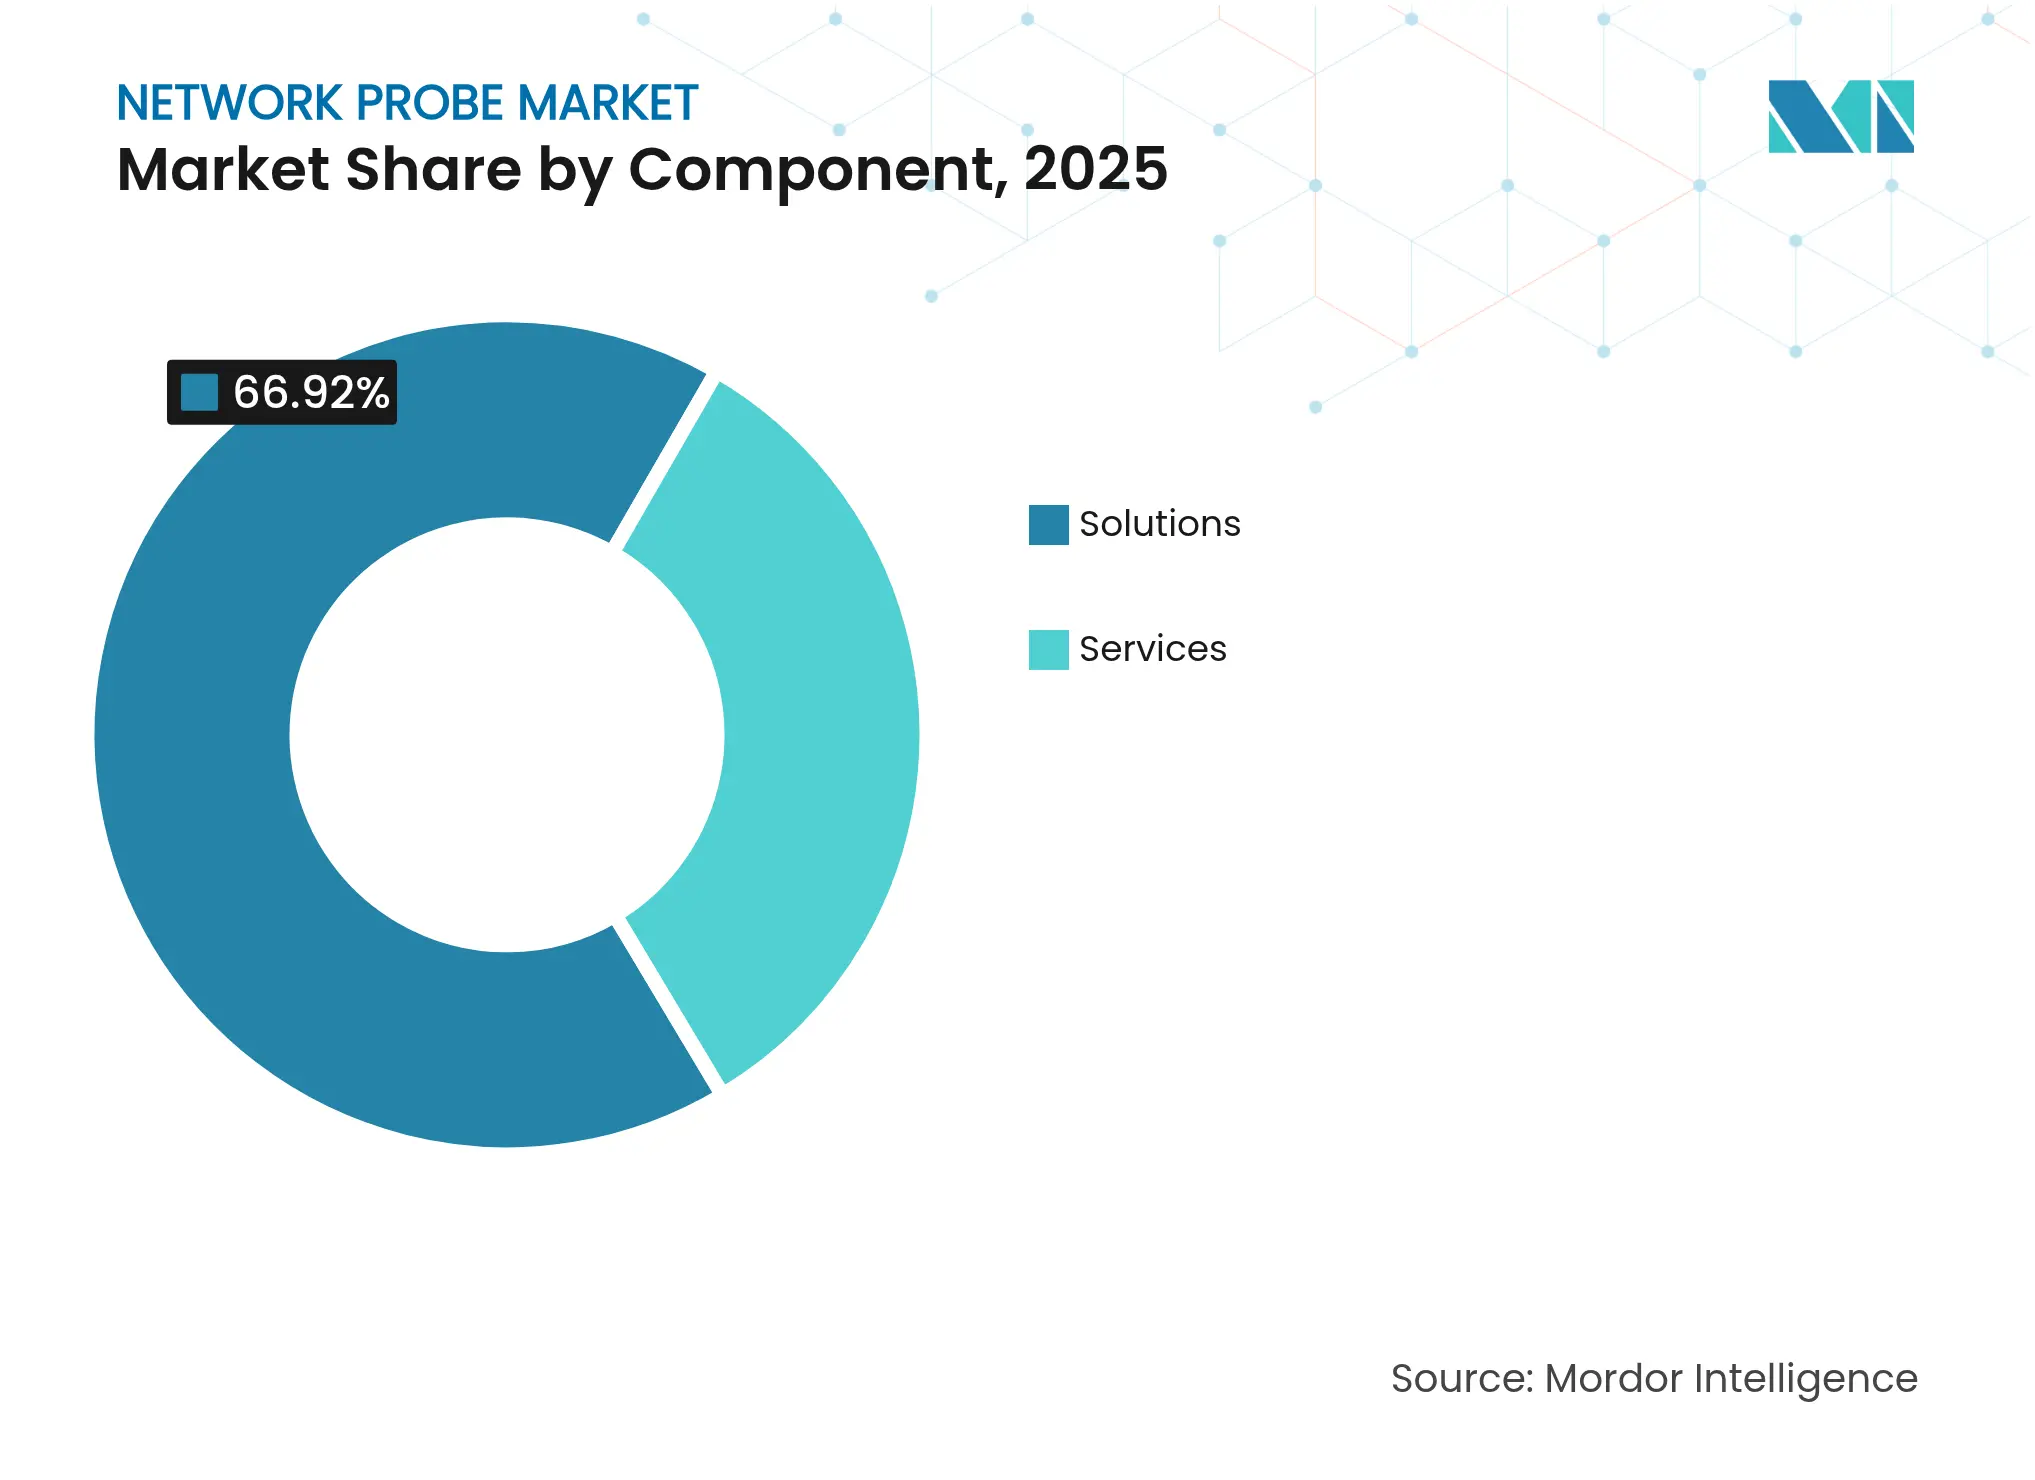
By Component: Solutions Dominance Amid Services Acceleration
Solutions generated 66.92% of market share in 2025 and retained leading share thanks to dedicated packet brokers bundled with analytics engines. Services, although smaller, grew faster as organizations outsourced configuration, baselining, and AI-model tuning to specialist teams. Hybrid procurement models now combine appliance CAPEX with managed-service OPEX to balance control and expertise.
Demand for 24×7 monitoring is illustrated by NETSCOUT’s Visibility-as-a-Service contracts with global insurers seeking unified dashboards across 40 countries. As predictive use cases mature, service providers embed SLA compliance reporting into managed packages, converting one-time license revenue into recurring streams that widen total addressable value in the network probe market.
Note: Segment shares of all individual segments available upon report purchase
By Deployment Mode: Cloud Transformation Accelerating
The network probe market size for on-premises deployments reached USD 0.47 billion in 2025, reflecting data-sovereignty mandates in financial services. Cloud models, however, are set to outpace with an 11.12% CAGR as SaaS probes elastically scale to match bursty traffic and DevOps release cycles. Vendors now ship lightweight agents that export packet metadata to regional analytics stacks, satisfying privacy regulations while preserving time-series granularity.
Enterprises like EasyJet shifted from MPLS to global SD-WAN underpinned by ThousandEyes cloud probes, slashing outage detection from 20 minutes to 2 minutes. In Europe, regulators encourage local cloud zones, prompting probe suppliers to add data centers in Frankfurt and Paris so customers can keep packet logs in-region without buying hardware.
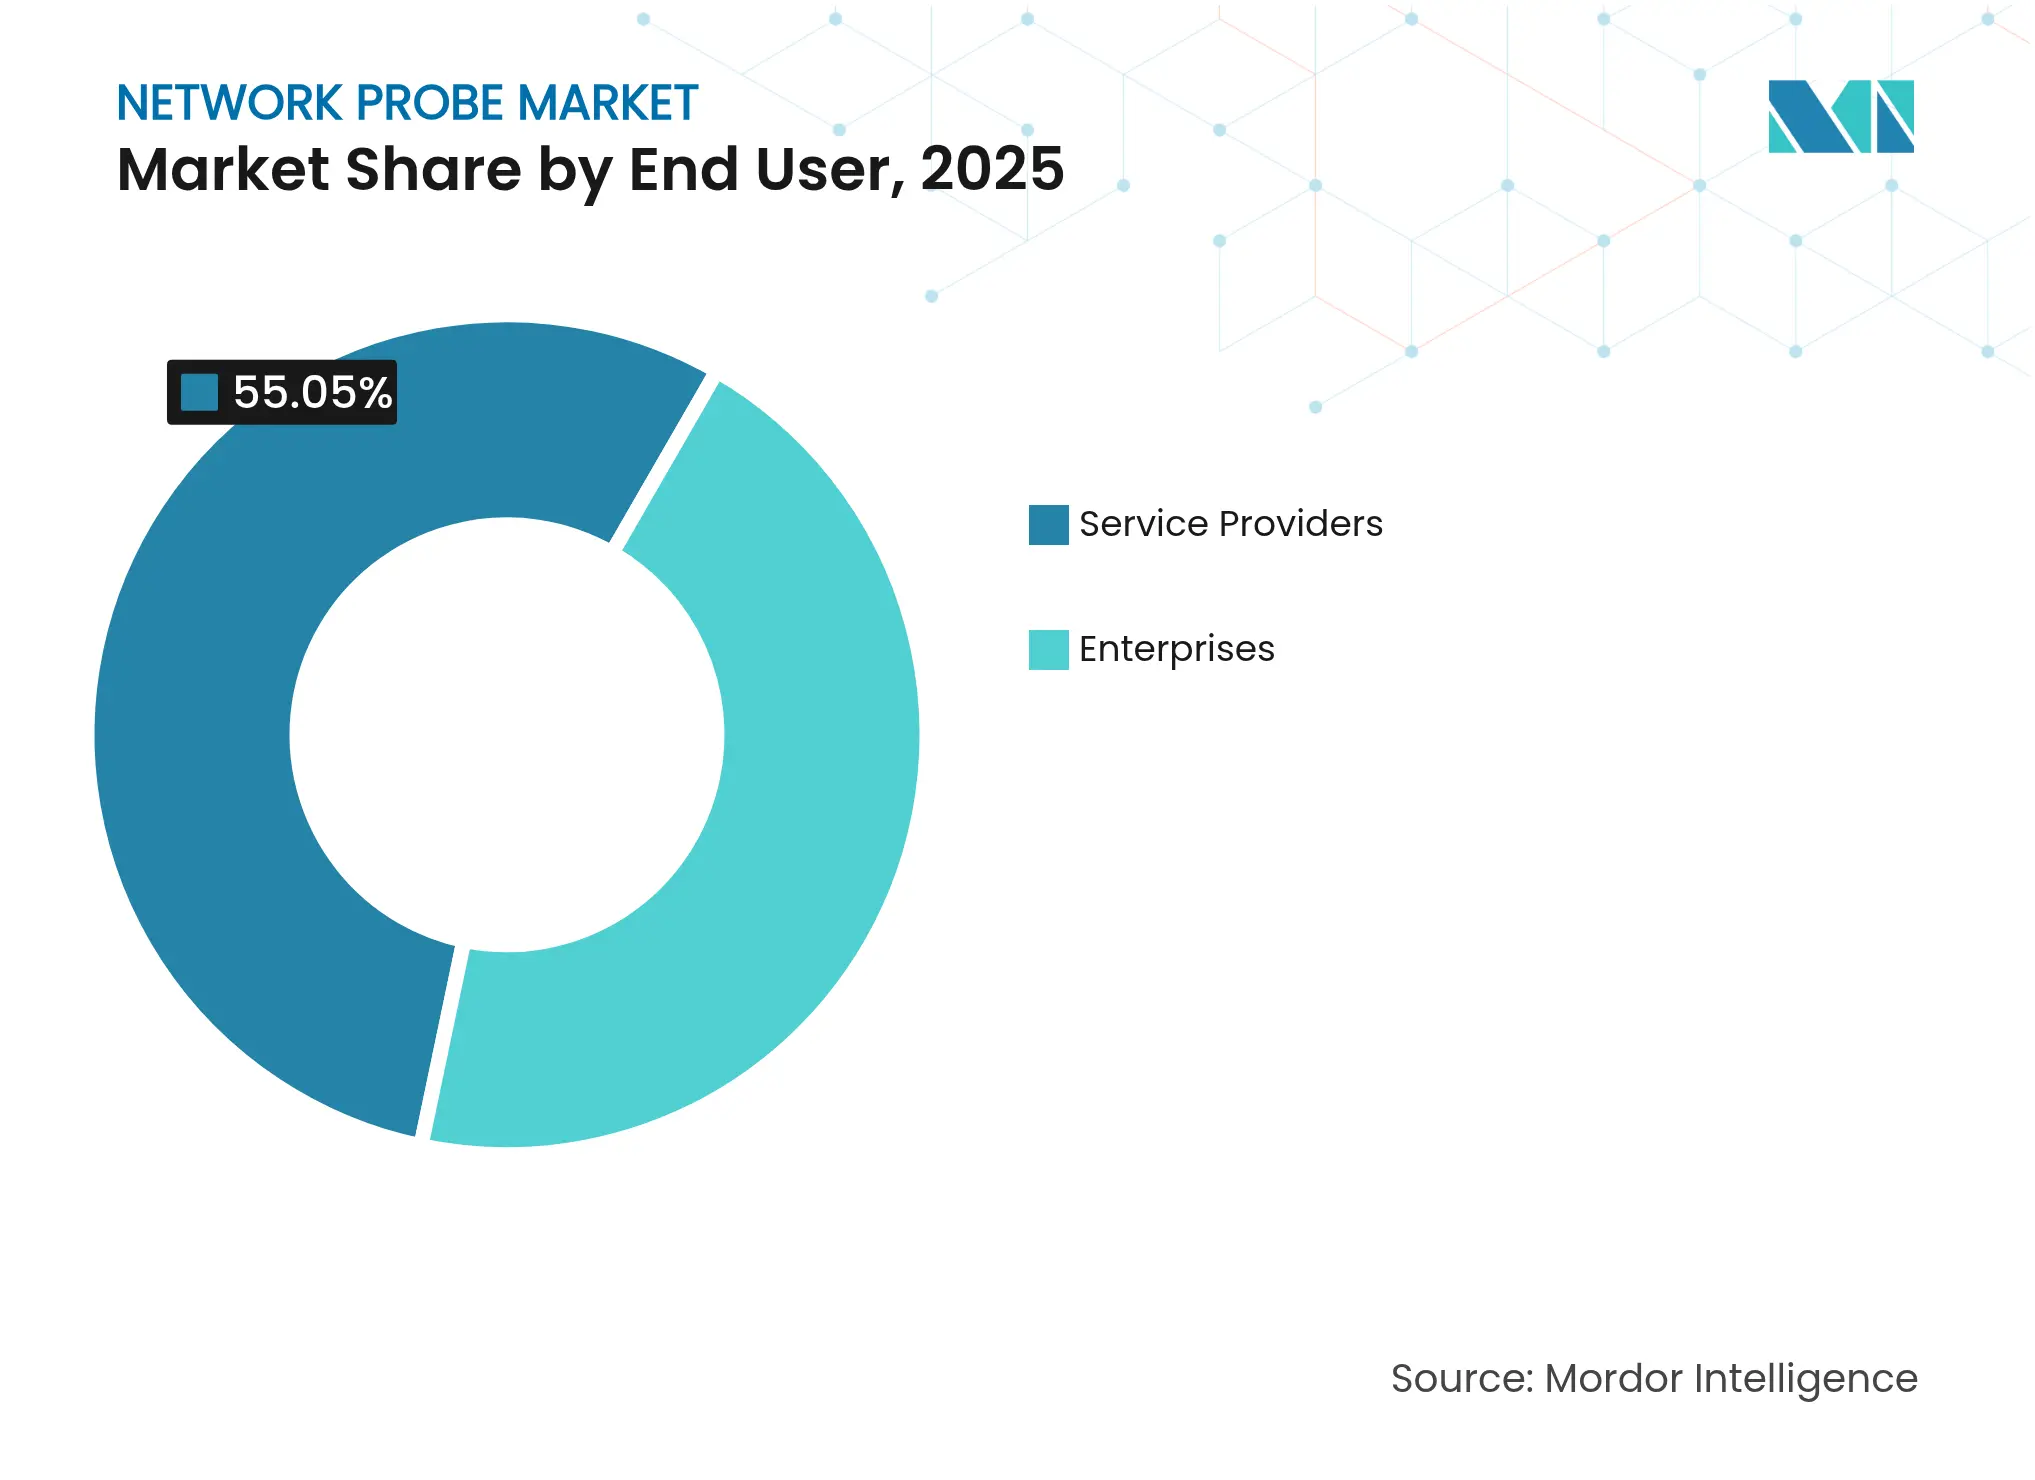
By End-User: Enterprise Acceleration Outpacing Service Providers
Service providers captured 55.05% market share of 2025 spend as 5G RAN launches demanded pervasive monitoring. Yet enterprise budgets are now expanding at 12.18% CAGR as CIOs grapple with SaaS sprawl and SASE adoption. Banking, retail, and manufacturing segments seek packet-level assurance to uphold digital-experience SLAs.
Carhartt relied on Cisco Full-Stack Observability to migrate 96% of its workloads while halving mean time to resolution, showcasing enterprise appetite for end-to-end telemetry. Meanwhile, BT Business unified 5.5 million network objects under IBM SevOne, emphasizing managed service providers’ role in helping multinationals rationalize toolsets.
Note: Segment shares of all individual segments available upon report purchase
By Probe Type: Smart Probes Leading Innovation
Passive capture solutions still dominate volume shipments because SPAN or TAP installation is familiar and non-intrusive. However, smart probes that blend passive capture, synthetic tests, and programmable filters now log the fastest growth. Dynamic probes inject test traffic when anomalies exceed thresholds, enriching ML models with labeled events.
Intraway’s QX Smart Probes illustrate convergence: the unit performs speed checks, OTT video scoring, and packet capture in one device. eBPF-based agents from Red Hat trace kernel events with microsecond accuracy without a kernel patch, reducing operational risk. Such versatility underpins adoption across edge nodes where footprint and automation are paramount.
North America contributed USD 0.28 billion, equal to 35.10% of global revenue in 2025. Early 400G backbones, aggressive zero-trust mandates, and a mature hyperscaler ecosystem sustain high probe refresh cycles. Semiconductor shortages pushed lead times to 60 weeks, prompting enterprises to stockpile spares, yet market growth held steady as data center expansions continued. Airlines, public sectors, and healthcare entities deploy probes to satisfy SLA and compliance rules, anchoring regional demand.
Asia-Pacific is the fastest-expanding region, posting a 10.32% CAGR to 2031 as 5G subscriptions rocket from 119 million in 2023 to 840 million by 2029. Operators in China, India, and Indonesia upgrade to 400G optical layers, compelling purchases of compatible probes. Local governments sponsor smart-city pilots requiring pervasive visibility, while manufacturing hubs adopt private 5G for robotics, further buoying the network probe market.
Europe maintains a solid outlook as NIS 2 regulation obliges critical sectors to log detailed network evidence. Average cybersecurity expenditure doubled, underscoring the link between compliance and observability. Domestic vendors such as Cubro and Allegro Packets supply packet-capture appliances aligned with data-protection rules. Cross-border cloud initiatives like Gaia-X foster interest in federated monitoring that respects sovereignty constraints, sustaining incremental demand.
Market Concentration
The network probe market features moderate fragmentation. NETSCOUT, Gigamon, and VIAVI Solutions lead through technology depth and acquisitions. VIAVI’s USD 1.277 billion purchase of Spirent adds 5G, SD-WAN, and security testing, creating a broadened assurance stack. Gigamon’s “Power of 3” partnership with Dynatrace and Trace3 integrates deep-observability pipelines with application-performance analytics, cementing ecosystem synergies.
Technology roadmaps prioritize AI pipelines, eBPF sensors, and 400G readiness. Meta’s patents on delay-aware scheduling for QUIC show large cloud providers increasingly shape performance-monitoring IP, heightening competitive pressure on pure-play probe vendors. Start-ups push cloud-first probes that deploy as Helm charts, eroding incumbents’ appliance lock-in. Nonetheless, hardware differentiation remains critical for tap aggregation and nanosecond-accurate timestamps, domains where incumbents retain design expertise.
Partnerships multiply: Vectra AI OEMs Gigamon telemetry for hybrid-cloud XDR, while Cisco rebadged Accedian’s Skylight to extend 5G service-assurance line-ups. Managed-service integrations grow as MSPs embed probes in bundled networking offers, intensifying price competition but broadening reach. Overall, vendor differentiation hinges on correlating packet, flow, and telemetry at petabyte scale with minimal operator overhead.

*Disclaimer: Major Players sorted in no particular order
1. INTRODUCTION
2. RESEARCH METHODOLOGY
3. EXECUTIVE SUMMARY
4. MARKET LANDSCAPE
5. MARKET SIZE AND GROWTH FORECAST (VALUE)
6. COMPETITIVE LANDSCAPE
7. MARKET OPPORTUNITIES AND FUTURE OUTLOOK
Market Definitions and Key Coverage
Segmentation Overview
Detailed Research Methodology and Data Validation
Primary Research
Desk Research
Market-Sizing & Forecasting
Data Validation & Update Cycle
Why Mordor's Network Probe Baseline Commands Reliability
Benchmark comparison
| Market Size | Anonymized source | Primary gap driver | ||
|---|---|---|---|---|
USD 0.81 B | Mordor Intelligence | - | Anonymized source:Mordor Intelligence | Primary gap driver:- |
USD 0.83 B | Global Consultancy A | counts only solution revenue and applies constant ASP across regions | ||
USD 0.94 B | Market Data Provider B | forecasts via linear trend, excludes virtual probe ramp-up and mid-year currency resets |
Pricing Strategy for Semiconductor Components
3 Min Read
Accelerating Additive Manufacturing Adoption in India
3 Min Read
When decisions matter, industry leaders turn to our analysts. Let’s talk.