Network Detection And Response Market Size and Share
Market Overview
| Study Period | 2020 - 2031 |
|---|---|
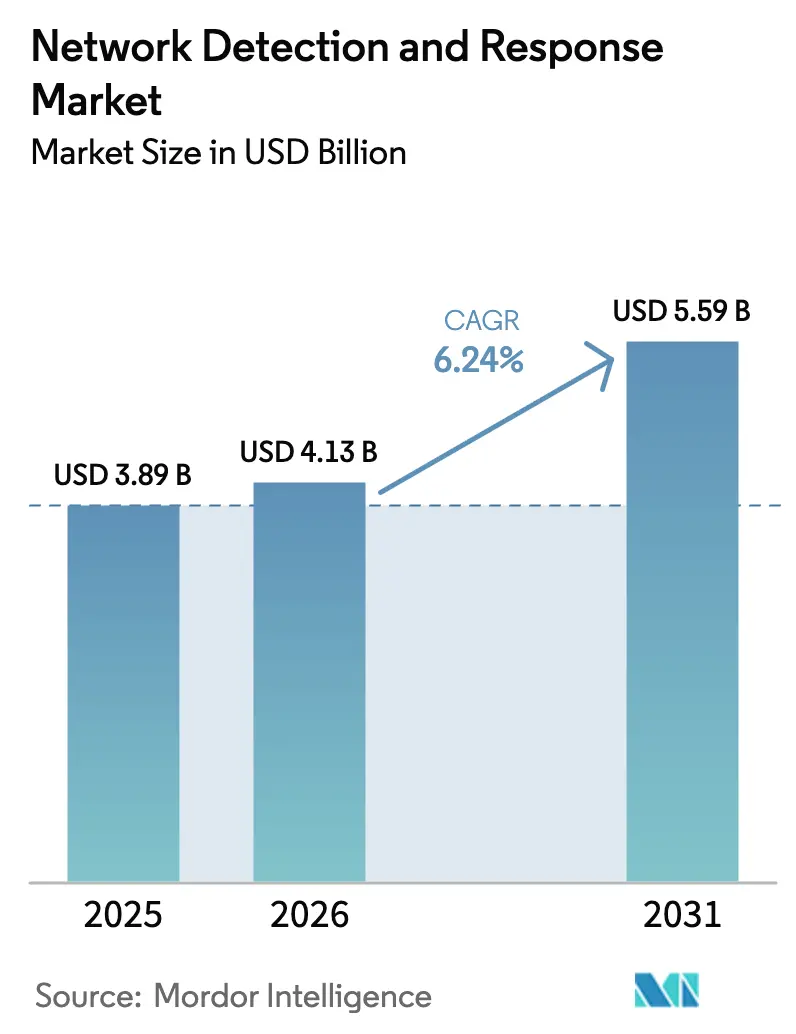
| Market Size (2026) | USD 4.13 Billion |
| Market Size (2031) | USD 5.59 Billion |
| Growth Rate (2026 - 2031) | 6.24% CAGR |
| Fastest Growing Market | Asia Pacific |
| Largest Market | North America |
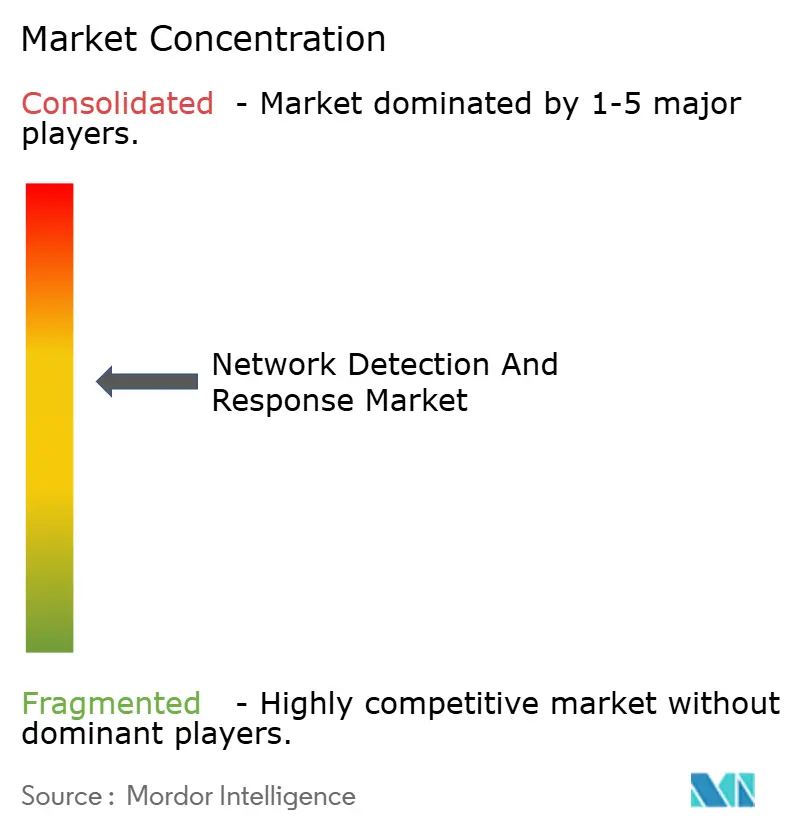
| Market Concentration | Medium |
Major Players *Disclaimer: Major Players sorted in no particular order Image © Mordor Intelligence. Reuse requires attribution under CC BY 4.0. | |
Network Detection And Response Market Analysis by Mordor Intelligence
The network detection and response market size in 2026 is estimated at USD 4.13 billion, growing from 2025 value of USD 3.89 billion with 2031 projections showing USD 5.59 billion, growing at 6.24% CAGR over 2026-2031. Growth picks up as enterprises pivot from reactive monitoring to proactive threat-hunting, embedding AI-driven analytics into hybrid-cloud visibility workflows. Convergence with extended detection and response (XDR) platforms, zero-trust mandates, and operational-technology (OT) digitization further widen addressable demand. Vendors differentiate on AI accuracy, encrypted east-west inspection, and automated remediation, while managed security service providers (MSSPs) package turnkey offerings for resource-constrained buyers. Data-sovereignty rules and false-positive fatigue continue to restrain rapid cloud migration, yet platform consolidation and cyber-insurance incentives sustain steady capital inflows across the network detection and response market value chain.
Key Report Takeaways
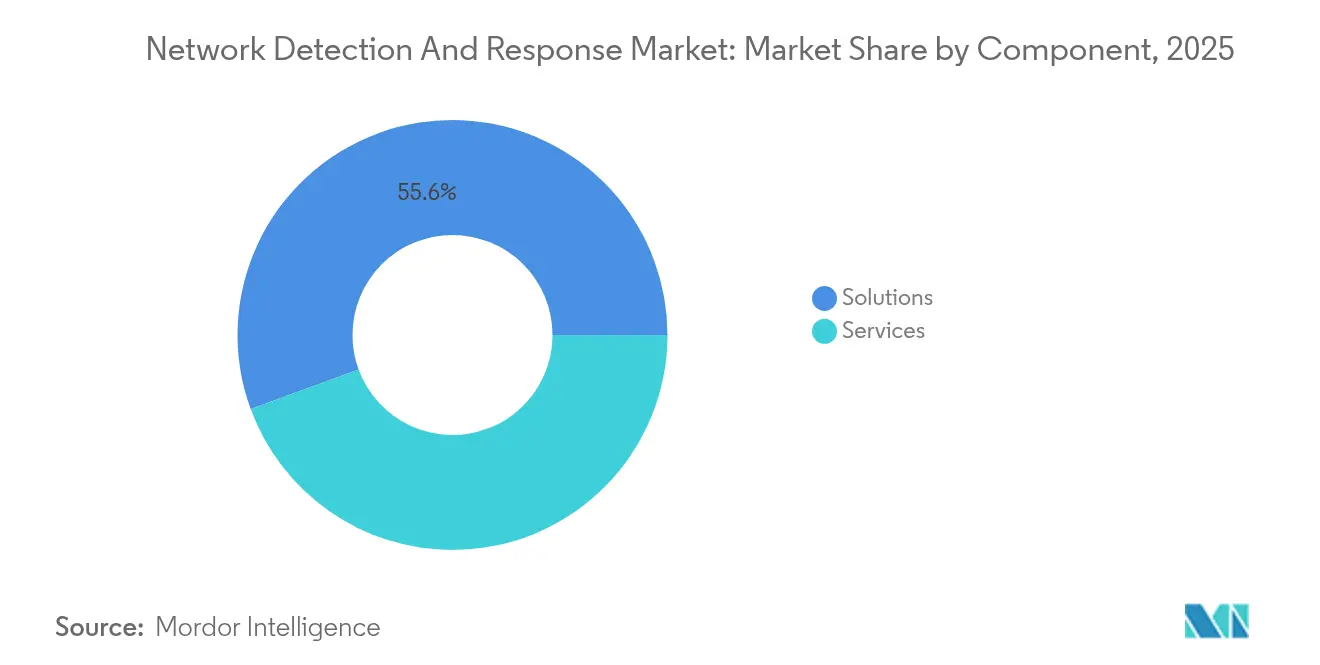
- By component, solutions captured 55.60% of network detection and response market share in 2025, whereas services are projected to compound at a 6.95% CAGR through 2031.
- By deployment, the on-premises segment accounted for 60.90% of the network detection and response market size in 2025, while cloud-based deployment is expected to post a 7.32% CAGR to 2031.
- By detection technique, signature-based methods led with 54.90% share in 2025; AI-driven anomaly detection is poised to grow at 7.28% CAGR over the forecast period.
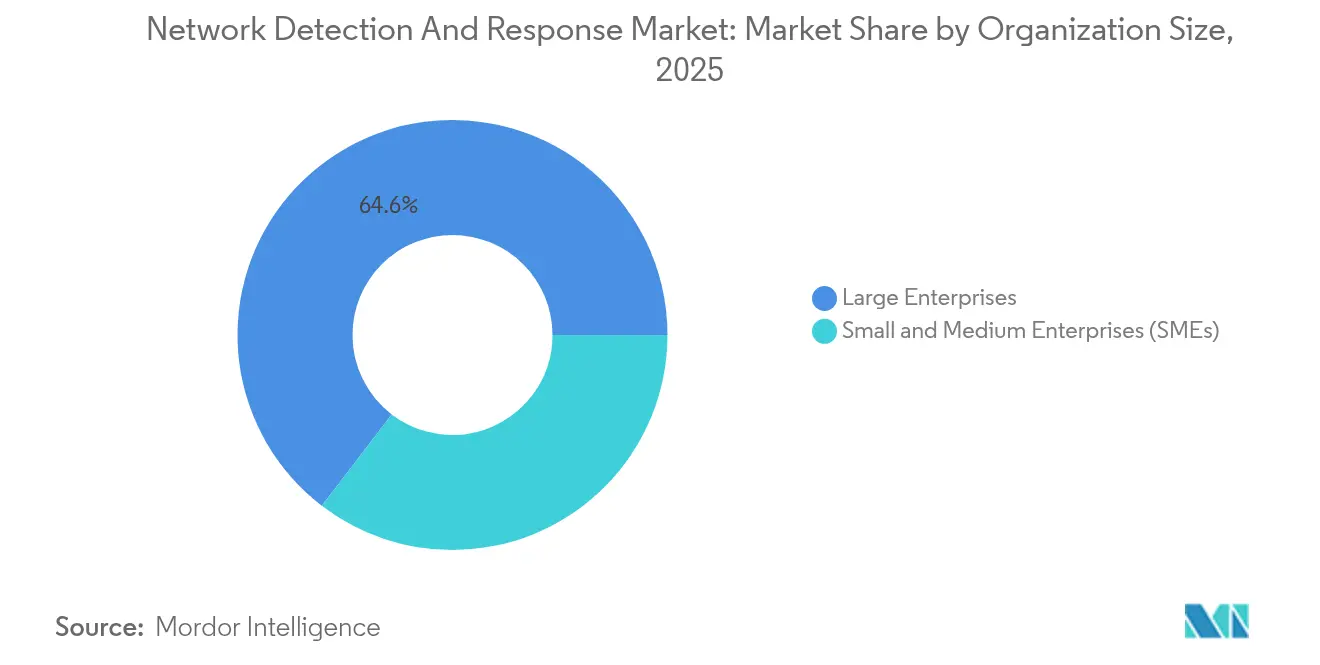
- By organization size, large enterprises held 64.60% revenue share in 2025, whereas SMEs are projected to accelerate at 6.84% CAGR through 2031.
- By end-user, BFSI dominated with a 25.10% share in 2025, while healthcare and life sciences will expand at an 8.06% CAGR to 2031.
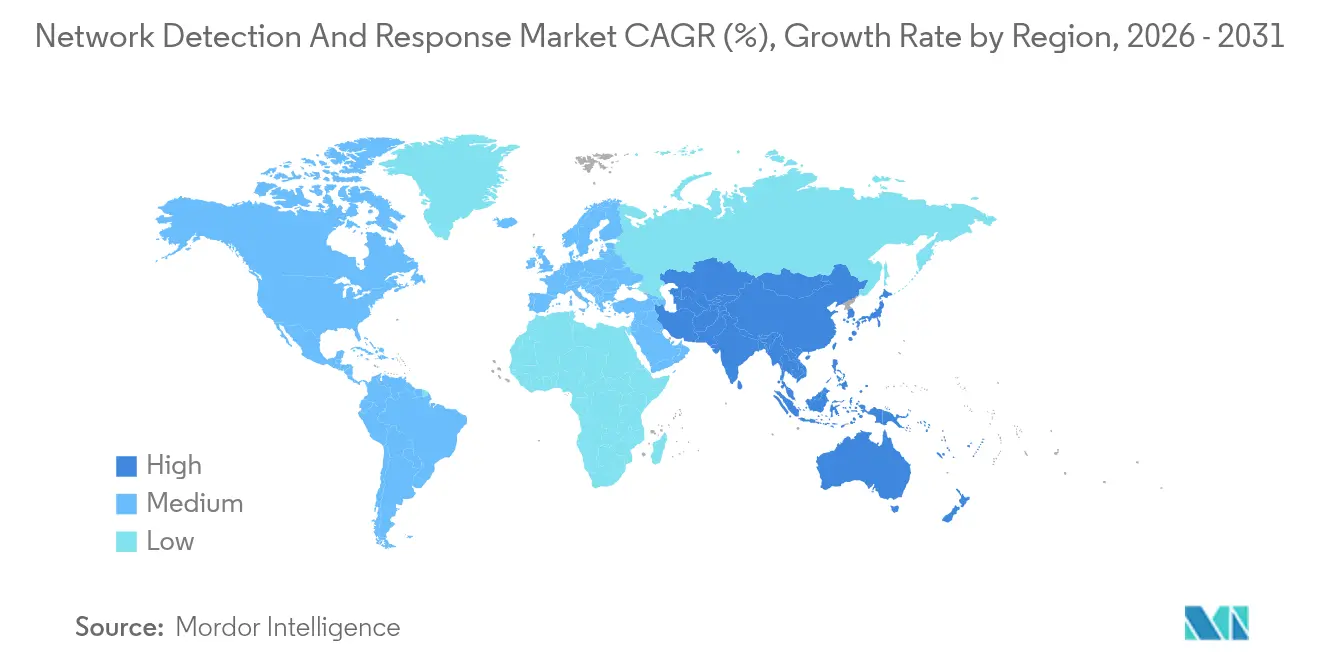
- By geography, North America commanded 40.10% share in 2025; Asia-Pacific is forecast to advance at 7.45% CAGR through 2031.
Note: Market size and forecast figures in this report are generated using Mordor Intelligence’s proprietary estimation framework, updated with the latest available data and insights as of 2026.
Global Network Detection And Response Market Trends and Insights
Drivers Impact Analysis*
| Driver | % Impact on CAGR Forecast | Geographic Relevance | Impact Timeline |
|---|---|---|---|
| AI-Powered Anomaly Detection Adoption Across Hybrid Cloud Networks | +1.8% | Global, with North America and EU leading | Medium term (2-4 years) |
| Integration of NDR into XDR/SOC Automation Workflows | +1.2% | North America and EU, expanding to Asia-Pacific | Short term (≤ 2 years) |
| Shift to Encrypted East-West Traffic Monitoring in OT and ICS Environments | +0.9% | Global, with industrial regions prioritized | Long term (≥ 4 years) |
| Surge in Zero-Trust Network Architectures Among North American Fortune 1000 | +1.1% | North America, spill-over to EU and Asia-Pacific | Medium term (2-4 years) |
| Cyber-Insurance Premium Discounts Linked to Real-time NDR Telemetry | +0.7% | North America and EU, emerging in Asia-Pacific | Medium term (2-4 years) |
| Managed Security Service Providers Bundling NDR in Asia-Pacific SME Packages | +0.5% | Asia-Pacific core, expanding to Latin America | Short term (≤ 2 years) |
| Source: Mordor Intelligence | |||
AI-powered anomaly detection adoption across hybrid-cloud networks
AI-driven NDR platforms slash alert investigation times from 40 minutes to 3-11 minutes and lift mean-time-to-conclusion by up to 95%.[1]Dropzone AI, “AI SOC Analysts: The Complete Guide to Alert Management,” dropzone.ai Machine-learning models learn baseline behaviors across private data centers and multicloud workloads, flagging zero-day tactics even when traffic is encrypted. Darktrace reports that 70% of detections now arise from highly anomalous activities surfaced by its self-learning AI. Generative AI adds autonomous threat-hunting features, though adversaries also weaponize AI-enabled polymorphic malware that mutates to avoid static signatures. Organizations deploying such capabilities increase alert-handling throughput ten-fold without matching head-count, an essential gain amid a global workforce shortfall where only 72% of security roles are filled.
Integration of NDR into XDR/SOC automation workflows
XDR platforms stitch network telemetry to endpoint, identity, and cloud logs, furnishing a unified console that collapses duplicative alerts and enriches context. Cisco XDR ingests feeds from more than 80 third-party tools and applies Talos intelligence to trim false positives.[2]Cisco Systems, “About Cisco XDR,” docs.xdr.security.cisco.com SOCs field roughly 3,800-4,500 alerts per day, discarding 62% unanswered; XDR correlation elevates high-fidelity incidents, enabling analysts to clear backlogs faster. Microsoft couples Defender XDR with Sentinel SIEM for automated investigation across multicloud estates. These orchestration gains are pivotal as 90% of SOCs say they are overwhelmed by manual triage.
Shift to encrypted east-west traffic monitoring in OT and ICS environments
Industrial networks once air-gapped now exchange encrypted traffic among programmable-logic controllers and supervisory systems, leaving blind spots for traditional deep-packet inspection. Ninety-three percent of organizations report at least one OT network incursion each year. Updated NIST guidance calls for continuous monitoring that observes cipher-suite usage, session length, and flow direction without decryption to preserve uptime. Specialist vendors parse industrial protocols to distinguish legitimate process variance from malicious lateral movement, satisfying asset-owner demand for passive, non-disruptive inspection.
Surge in zero-trust architectures among North American Fortune 1000
Eighty-one percent of enterprises aim to complete zero-trust rollouts by 2026, driven by Executive Order 14028 and CISA’s maturity model.[3]CIO, “Why 81% of Organizations Plan to Adopt Zero Trust by 2026,” cio.com Continuous verification calls for pervasive NDR sensors that scrutinize every micro-segmented flow. Yet only 5% of firms achieve full microsegmentation today, creating latent demand for NDR platforms that automate policy enforcement. Federal civilian agencies must evidence progress toward zero-trust pillars in annual budget submissions, accelerating spending cycles.
Restraints Impact Analysis*
| Restraint | (~) % Impact on CAGR Forecast | Geographic Relevance | Impact Timeline |
|---|---|---|---|
| False-Positive Fatigue Impacting SOC Productivity | -1.4% | Global, particularly acute in North America | Short term (≤ 2 years) |
| Data-Residency Mandates Limiting Cloud-Native NDR Uptake | -0.8% | EU, Asia-Pacific, with regulatory expansion | Medium term (2-4 years) |
| High-Speed (100 GbE) Packet Capture Hardware Cost Barrier (OT Sites) | -0.6% | Global, concentrated in industrial regions | Long term (≥ 4 years) |
| Skills Gap for Network-Centric Threat Hunting in Latin America | -0.4% | Latin America, spillover to emerging markets | Medium term (2-4 years |
| Source: Mordor Intelligence | |||
False-positive fatigue impacting SOC productivity
Teams squander 70% of investigative hours on benign events, leaving genuine threats unattended and inflating analyst burnout rates. Average alert volumes top 4,000 daily; two-thirds go unreviewed as capacity lags. The downstream toll includes delayed containment of live intrusions at one-third of enterprises, spiraling breach costs, and turnover that deepens the 4.8 million-person cyber-skills gap.
Data-residency mandates limiting cloud-native NDR uptake
The EU’s NIS2 directive, effective in 2024, and contrasting cross-border statutes such as the US CLOUD Act impose conflicting obligations on telemetry storage. Financial services and healthcare operators prefer on-premises or hybrid deployments rather than risk non-compliance, constraining cloud NDR addressability. Similar rules in Japan, India, and Australia replicate the friction across APAC.
*Our forecasts treat driver/restraint impacts as directional, not additive. The impact forecasts reflect baseline growth, mix effects, and variable interactions.
Segment Analysis
By Component: Solutions maintain dominance while services accelerate
Solutions accounted for 55.60% of the network detection and response market share in 2025, underscoring buyer preference for unified analytics engines and automated playbook orchestration. Vendors bundle advanced machine-learning models, threat-intelligence feeds, and forensic toolkits into turnkey platforms that slot into SOC workstreams. Professional services lines flourish as enterprises customize detection logic to bespoke architectures, integrate with SIEMs, and train personnel.
Services post the highest growth at 6.95% CAGR through 2031 as MSSPs address skill shortages by offering 24/7 monitoring and threat-hunting. Managed detection and response (MDR) agreements embed NDR telemetry with human expertise, letting mid-market firms access enterprise-grade visibility without capital outlays. The hybrid model resonates as only 72% of global cyber roles are filled, making external support a structural necessity.


By Deployment: Cloud growth quickens amid on-premises control
On-premises installations captured 60.90% of the network detection and response market size in 2025 as regulated verticals retain direct custody over sensitive packet captures. Equipment can be fine-tuned to unique traffic patterns and integrated with existing hardware taps. Yet cloud-based solutions will expand at 7.32% CAGR, buoyed by elastic scaling, automated upgrades, and pay-as-you-consume economics.
Hybrid deployment gains traction, processing raw packets locally while forwarding metadata to cloud analytics engines. This architecture navigates data-sovereignty strictures such as NIS2 while harvesting cloud efficiencies. Vendors emphasise homomorphic encryption and regionalized data pools to further reassure compliance teams.
By Detection Technique: AI models chip away at signature incumbency
Signature-based methods retained 54.90% share in 2025 leveraging curated threat databases and low false-positive ratios. They are indispensable against commodity malware and policy violations. AI-based anomaly engines, however, will register a 7.28% CAGR, detecting zero-days and insider abuse by modeling normal baselines and spotting deviations.
Hybrid detection that fuses signatures with behavioral analytics gains momentum. Correlated insights lower noise while preserving high recall, satisfying SOC demands for precision. Suppliers patent selective anomaly alerting and ML-powered impersonation detection to secure intellectual capital.
By Network Type: Cloud fabrics energize innovation
Traditional physical networks still represent 52.00% of revenue in 2025, sustained by entrenched LAN/WAN estates that anchor enterprise connectivity. Appliances monitor spine-leaf architectures and hardware switches while supporting line-rate inspection for high-throughput links. Cloud and SaaS environments, though smaller, are poised for an 8.41% CAGR as software-defined overlays, Kubernetes clusters, and API-centric workflows demand elastic, sensor-less visibility.
Operational-technology networks pose distinct requirements: protocol awareness, passive monitoring, and deterministic latency preservation. Vendors train models on Modbus, DNP3, and PROFINET traffic, chasing a newly accessible OT security budget accelerated by government critical-infrastructure directives.
By Organization Size: MSSP partnerships unlock SME spend
Large enterprises contributed 64.60% of 2025 revenues, reflecting complex environments, compliance mandates, and healthy security budgets. They deploy platform suites, integrate with DevSecOps pipelines, and staff internal hunt teams. Small and medium enterprises, although budget-constrained, will grow at 6.84% CAGR enabled by MSSP bundles that abstract operational complexity.
MSSPs leverage multitenant architectures to amortize sensor costs, offering per-user pricing that aligns with SME cash flow. Alert triage, incident response, and compliance reporting are delivered as a service, effectively outsourcing SOC functions. The arrangement addresses labour scarcity: global unfilled cyber positions total 4.8 million.
By End-User Industry: Healthcare steps into high-growth spotlight
BFSI held 25.10% of 2025 turnover, shaped by stringent transaction-monitoring regulations and attractive monetization for attackers. Institutions integrate NDR telemetry into payment-fraud analytics and SWIFT traffic inspection to satisfy supervisory audits. Healthcare and life sciences will surge at 8.06% CAGR as connected medical devices proliferate, HIPAA updates mandate multifactor authentication, and ransomware disrupts patient care.
Average healthcare breach costs reached USD 4.88 million, intensifying board-level scrutiny. Vendors tailor detections to HL7 and DICOM traffic while ensuring patient-safety uptime. Manufacturing, energy, government, and retail verticals likewise escalate spend to guard OT assets, nation-state targets, and omnichannel payment data.
Geography Analysis
North America produced 40.10% of global revenue in 2025 supported by CISA directives, federal zero-trust checkpoints, and deep vendor ecosystems. Fortune 1000 rollouts drive multi-year platform refresh cycles, while cyber-insurance markets tighten underwriting tied to NDR telemetry.
Europe grows under the impetus of the NIS2 directive, compelling critical entities to evidence continuous monitoring and 24-hour incident notification. Vendors open regional SOCs and deploy data-localization features to satisfy GDPR and Schrems II jurisprudence. Governments channel Recovery-and-Resilience funds into cybersecurity modernization, anchoring spending across the bloc.
Asia-Pacific registers the fastest trajectory at 7.45% CAGR through 2031 as digital-economy expansion and escalating threat volumes catalyze adoption. Japan’s defense budget funds AI-driven counter-cyber grids, India’s CERT-In mandates breach reporting within six hours, and Australia’s Security of Critical Infrastructure laws compel OT monitoring. Latin America wrestles with attack volumes 40% above global norms, prompting enterprises to bypass legacy IDS for AI-based NDR. The Middle East and Africa expand procurement tied to national Vision 2030 digital agendas and IOC compliance.

Competitive Landscape
Market structure tilts toward moderate concentration as platform giants absorb niche innovators. Zscaler paid USD 350 million for Avalor to weave a security-data fabric that accelerates root-cause analysis, while Palo Alto Networks’ pending USD 650-700 million Protect AI deal underpins Prisma AIRS for AI-workload defense. Strategic intent centers on ingest breadth and machine-learning depth, reducing operational friction for SOCs drowning in point tools.
Incumbents articulate AI roadmaps: Cisco upgrades Talos models for encrypted-traffic heuristics, Fortinet fuses NDR into unified SASE, and Juniper applies Mist AI to telemetry baselining. Specialized players such as Darktrace, Vectra AI, and ExtraHop differentiate via self-learning models trained on proprietary behavior graphs. Patent races in selective anomaly alerting and impersonation detection fortify IP moats.
Network Detection And Response Industry Leaders
Cisco Systems Inc.
Juniper Networks
Arista Networks Inc.
Vectra AI
Fortinet Inc.
- *Disclaimer: Major Players sorted in no particular order

Recent Industry Developments
- May 2025: Zscaler agreed to acquire Red Canary to enrich AI-powered SOC automation and extend zero-trust exchange telemetry.
- May 2025: Palo Alto Networks posted fiscal Q3 2025 revenue of USD 2.29 billion, with next-gen security ARR topping USD 5 billion.
- April 2025: Palo Alto Networks announced plans to buy Protect AI for up to USD 700 million to secure AI/ML pipelines.
- March 2025: Darktrace rolled out enhanced encrypted-traffic analytics and automated investigations for SOC efficiency.


Global Network Detection And Response Market Report Scope
Organizations leverage Network Detection and Response (NDR) as a crucial element of their cybersecurity strategy, empowering them to identify, probe, and counteract cyber threats embedded in their network traffic. The research also examines underlying growth influencers and significant industry vendors, all of which help to support market estimates and growth rates throughout the anticipated period. The market estimates and projections are based on the base year factors and arrived at top-down and bottom-up approaches.
The network detection and response market is segmented by component (solution and services), by deployment (on-premises and cloud-based), by enterprise size (small and medium-sized enterprises (SMEs) and large enterprises), by end-user industry (BFSI, government & defense, energy & utilities, IT & telecom, healthcare and other end-user industries) and by geography (North America, Europe, Asia Pacific, South America, and Middle East and Africa). The market sizing and forecasts are provided in terms of value (USD) for all the above segments.
| Solutions | Detection Analytics Platform |
| Automated Response Orchestration | |
| Services | Professional Services |
| Managed Services |
| On-Premises |
| Cloud-Based |
| Signature-Based |
| Anomaly-/AI-Based |
| Hybrid Methods |
| Physical (Traditional LAN/WAN) |
| Virtual and SDN |
| Operational Technology (OT/ICS) |
| Cloud and SaaS Networks |
| Small and Medium Enterprises (SMEs) |
| Large Enterprises |
| BFSI |
| Government and Defense |
| Energy and Utilities |
| IT and Telecom |
| Healthcare and Lifesciences |
| Manufacturing |
| Retail and E-commerce |
| Others (Education, Media, Transportation) |
| North America | United States | |
| Canada | ||
| Mexico | ||
| South America | Brazil | |
| Argentina | ||
| Rest of South America | ||
| Europe | Germany | |
| France | ||
| United Kingdom | ||
| Italy | ||
| Spain | ||
| Nordics | ||
| Asia-Pacific | China | |
| Japan | ||
| India | ||
| South Korea | ||
| New Zealand | ||
| Rest of Asia-Pacific | ||
| Middle East and Africa | Middle East | GCC |
| Turkey | ||
| Israel | ||
| Rest of Middle East | ||
| Africa | South Africa | |
| Nigeria | ||
| Egypt | ||
| Rest of Africa | ||
| By Component | Solutions | Detection Analytics Platform | |
| Automated Response Orchestration | |||
| Services | Professional Services | ||
| Managed Services | |||
| By Deployment | On-Premises | ||
| Cloud-Based | |||
| By Detection Technique | Signature-Based | ||
| Anomaly-/AI-Based | |||
| Hybrid Methods | |||
| By Network Type | Physical (Traditional LAN/WAN) | ||
| Virtual and SDN | |||
| Operational Technology (OT/ICS) | |||
| Cloud and SaaS Networks | |||
| By Organization Size | Small and Medium Enterprises (SMEs) | ||
| Large Enterprises | |||
| By End-User Industry | BFSI | ||
| Government and Defense | |||
| Energy and Utilities | |||
| IT and Telecom | |||
| Healthcare and Lifesciences | |||
| Manufacturing | |||
| Retail and E-commerce | |||
| Others (Education, Media, Transportation) | |||
| By Geography | North America | United States | |
| Canada | |||
| Mexico | |||
| South America | Brazil | ||
| Argentina | |||
| Rest of South America | |||
| Europe | Germany | ||
| France | |||
| United Kingdom | |||
| Italy | |||
| Spain | |||
| Nordics | |||
| Asia-Pacific | China | ||
| Japan | |||
| India | |||
| South Korea | |||
| New Zealand | |||
| Rest of Asia-Pacific | |||
| Middle East and Africa | Middle East | GCC | |
| Turkey | |||
| Israel | |||
| Rest of Middle East | |||
| Africa | South Africa | ||
| Nigeria | |||
| Egypt | |||
| Rest of Africa | |||


Key Questions Answered in the Report
What is the current value of the network detection and response market?
The network detection and response market size is USD 4.13 billion in 2026.
How fast will the network detection and response market grow through 2031?
It is projected to advance at a 6.24% CAGR, reaching USD 5.59 billion by 2031.
Which component segment is expanding most rapidly?
Services, particularly managed detection and response, will post a 6.95% CAGR due to acute cyber-skills shortages.
Why is Asia-Pacific the fastest-growing geography?
Rapid digitization, regulatory compliance mandates, and rising cyber-insurance uptake drive a 7.45% CAGR in the region.
Page last updated on:


