Market Overview
| Study Period | 2020 - 2031 |
|---|---|
| Forecast Data Period | 2026 - 2031 |
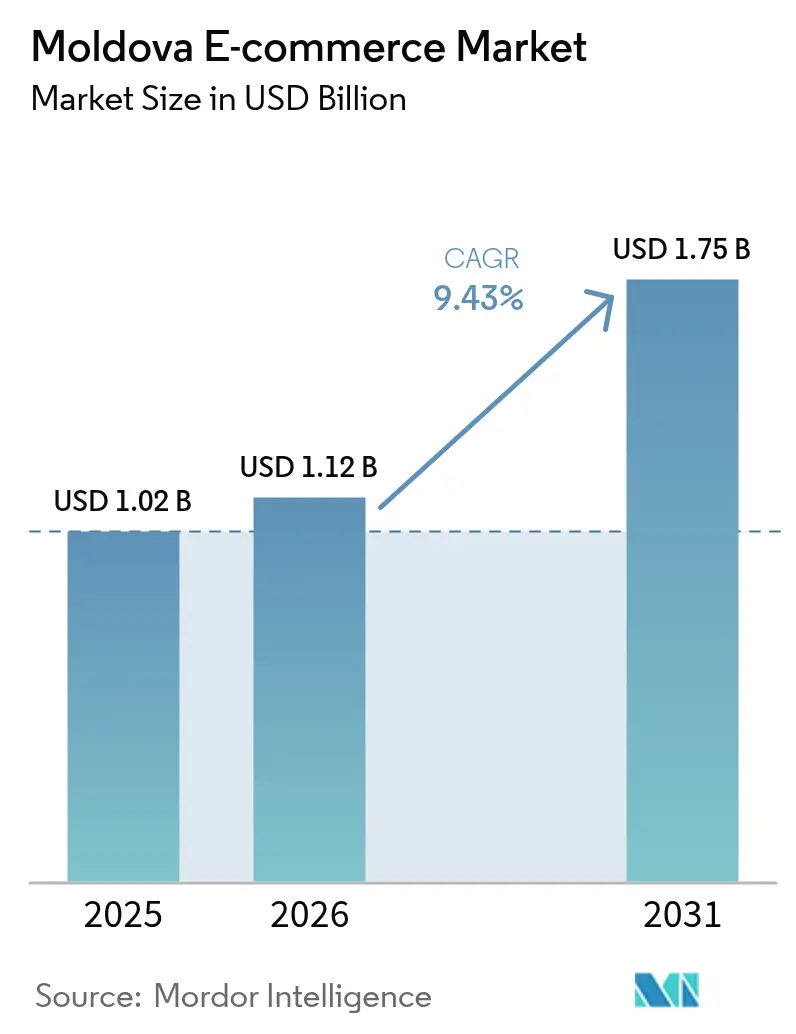
| Base Year Market Size (2025) | USD 1.02 Billion |
| Market Size (2026) | USD 1.12 Billion |
| Market Size (2031) | USD 1.75 Billion |
| Growth Rate (2026 - 2031) | 9.43% CAGR |
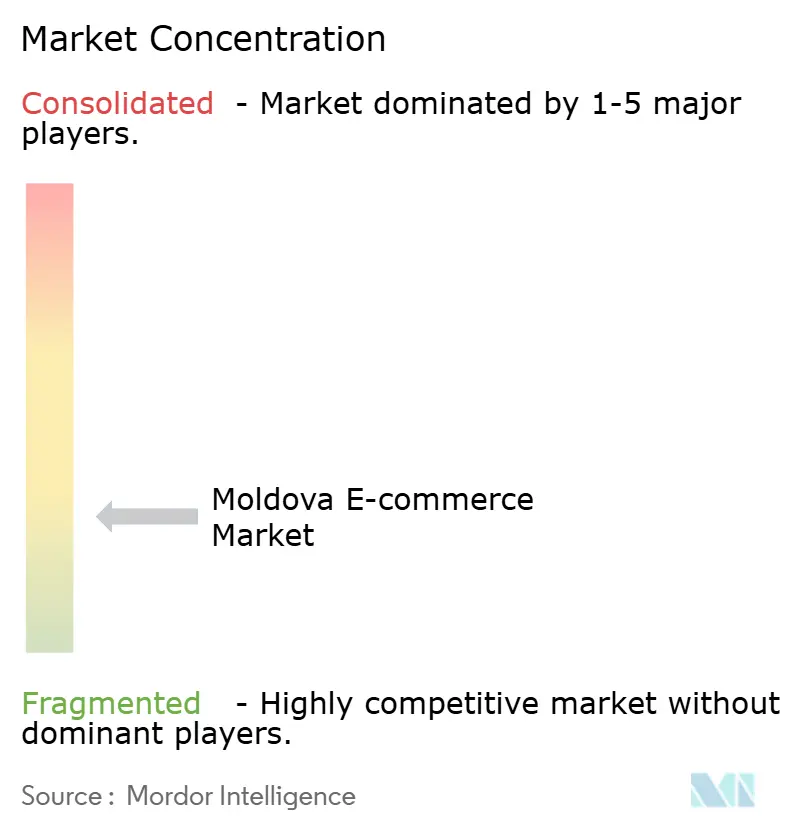
| Market Concentration | Low |
Major Players *Disclaimer: Major Players sorted in no particular order Image © Mordor Intelligence. Reuse requires attribution under CC BY 4.0. | |
Moldova E-commerce Market Analysis by Mordor Intelligence
The Moldova e-commerce market size was valued at USD 1.02 billion in 2025 and estimated to grow from USD 1.12 billion in 2026 to reach USD 1.75 billion by 2031, at a CAGR of 9.43% during the forecast period (2026-2031). Widespread internet access now covers 80.2% of residents, smartphones drive most online traffic, and SEPA participation is streamlining cross-border payments. Continuous policy support—from the Digital Transformation Strategy 2023-2030 to targeted IT-sector incentives—is lowering operational friction, while parcel-locker roll-outs in secondary cities are broadening fulfilment reach. Regional integration is accelerating: the EU already absorbs two-thirds of Moldova’s exports, and the DCFTA framework is driving fresh efficiencies across logistics, customs and payments. Competitive intensity is rising as roughly 1,700 domestic webshops jostle with cross-border giants, and Romania-based eMAG prepares market entry.
Key Report Takeaways
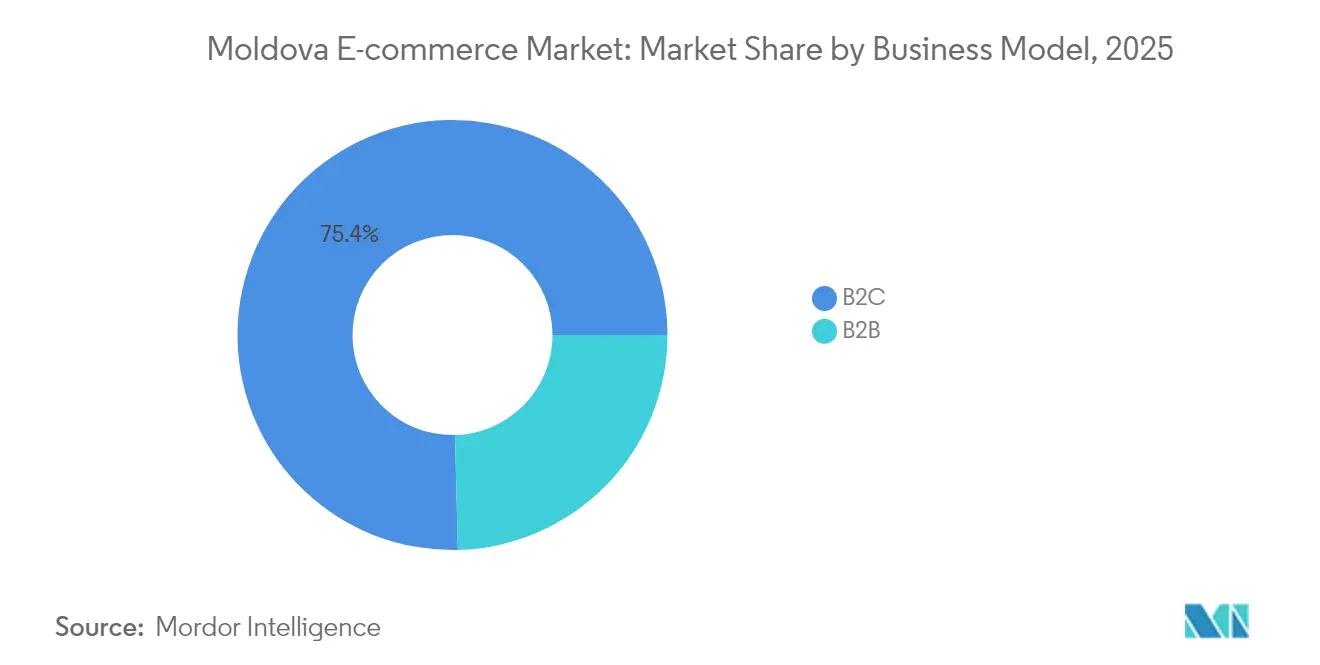
- By business model, the B2C segment led with 75.40% revenue share in 2025; the B2B segment is forecast to expand at an 10.84% CAGR through 2031.
- By device, smartphones accounted for 69.40% of transactions in 2025 and are advancing at a 11.76% CAGR to 2031.
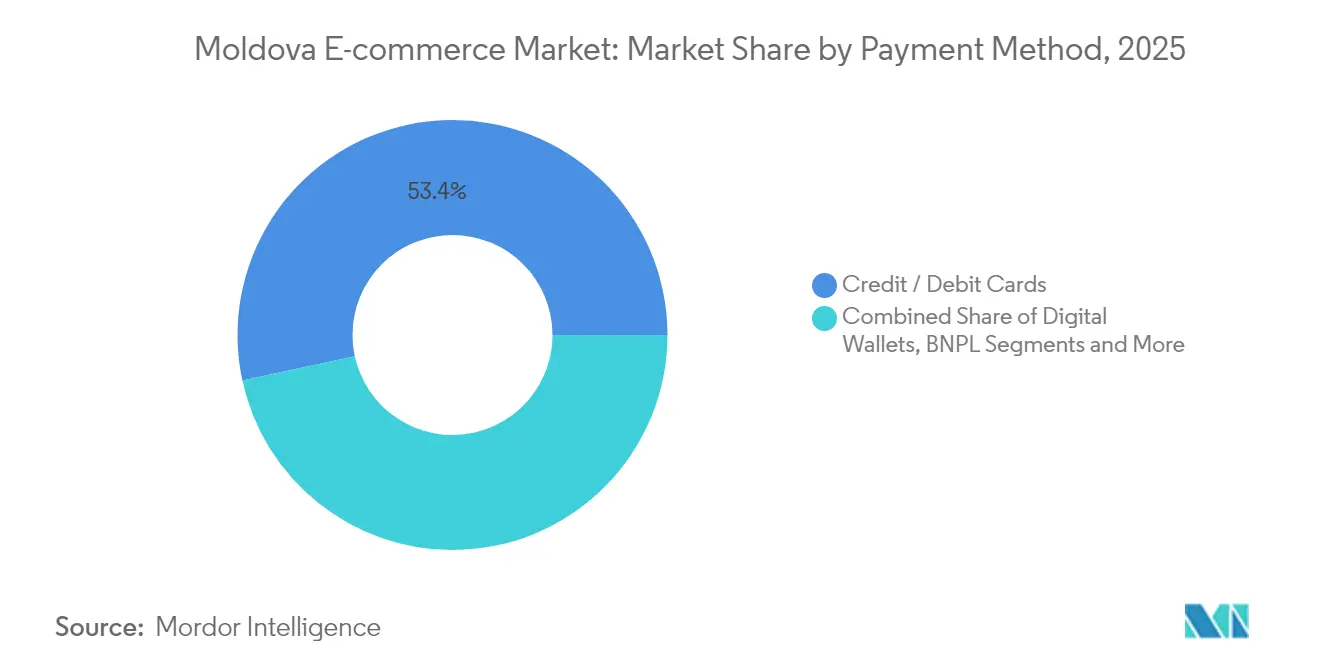
- By payment method, credit/debit cards held 53.40% of the Moldova e-commerce market share in 2025, while digital wallets post the fastest growth at 12.65% CAGR to 2031.
- By product category, fashion and apparel captured 31.60% of the Moldova e-commerce market size in 2025; food and beverages is projected to grow at 13.25% CAGR between 2026-2031.
Note: Market size and forecast figures in this report are generated using Mordor Intelligence’s proprietary estimation framework, updated with the latest available data and insights as of 2026.
Moldova E-commerce Market Trends and Insights
Drivers Impact Analysis*
| Driver | (~) % Impact on CAGR Forecast | Geographic Relevance | Impact Timeline |
|---|---|---|---|
| Rising internet and smartphone penetration | +2.3% | National, with higher impact in secondary cities | Medium term (2-4 years) |
| Government IT‐sector incentives and tax breaks | +1.8% | National, concentrated in urban centers | Medium term (2-4 years) |
| Fin-tech adoption improving checkout conversion | +1.5% | Urban centers, primarily Chișinău | Short term (≤ 2 years) |
| EU-DCFTA logistics corridors lowering cross-border costs | +1.2% | National, with emphasis on border regions | Medium term (2-4 years) |
| Remittance-fuelled purchasing power among diaspora families | +0.9% | Rural areas and smaller cities | Short term (≤ 2 years) |
| Expansion of parcel-locker networks in secondary cities | +0.7% | Secondary cities and suburban areas | Short term (≤ 2 years) |
| Source: Mordor Intelligence | |||
Rising Internet and Smartphone Penetration: Digital Divide Narrowing
Moldova counts 2.42 million internet users in 2025, and average download speeds reach 133.96 Mbps on fixed lines and 48.29 Mbps on mobile connections. [1]National Bureau of Statistics, “Situația privind utilizarea produselor tehnologiei informației și comunicațiilor în întreprinderi în anul 2025,” statistica.gov.md Daily online engagement now exceeds 91% of users, enabling merchants to interact with shoppers almost continuously. Telecom operators Orange and Moldcell started 5G roll-outs in 2024, bolstering bandwidth-heavy mobile shopping experiences. The sector contributes 7% of GDP, underscoring its macro-economic weight. Still, 19.8% of the population remains offline, and low-income rural households face affordability constraints that temper nationwide adoption.
Government IT-Sector Incentives: Creating Digital Innovation Hubs
The Moldova Innovation Technology Park (MITP), now extended to 2037, offers a flat 7% tax rate that has attracted nearly 1,600 companies. IT’s fiscal contribution expanded from EUR 19 million (USD 20.6 million) in 2017 to EUR 68 million (USD 73.6 million) in 2023, catalysing digital-commerce enablers. Liberalised work-permit policies widen the talent pool, accelerating next-generation e-commerce platform development and middleware services.
Fin-tech Adoption: Streamlining the Digital Purchase Journey
SEPA accession in March 2025 allows Moldovan banks to execute euro-denominated transfers at EU-standard cost and speed. Domestic providers such as Paynet rolled out Strong Customer Authentication in February 2025, raising fraud resilience without adding checkout friction. Cashless transactions per capita climbed from 8 in 2017 to 54 in 2023, signalling a decisive behavioural pivot, though headroom to the EU average of 170 remains large.
EU-DCFTA Logistics Corridors: Redefining Cross-Border Commerce
Gravity-model analysis shows the DCFTA added 9% to Moldova-EU trade. [2]Journal of Eastern European and Central Asian Research, “Effectiveness of the DCFTA on Moldova’s Trade with the EU,” ieeca.org The EBRD’s customs-digitisation project, due for completion in 2024, covers electronic certificates of origin, pre-arrival processing and ATA carnet digitalisation. Faster, paper-free clearance lowers landed cost for inbound stock and expedites exports by local merchants, making the Moldova e-commerce market more attractive for EU consumers.
Restraints Impact Analysis*
| Restraint | (~) % Impact on CAGR Forecast | Geographic Relevance | Impact Timeline |
|---|---|---|---|
| Fragmented last-mile delivery outside Chișinău | -1.2% | Rural areas and smaller cities | Medium term (2-4 years) |
| Low consumer trust in online pre-payment | -0.9% | National, more pronounced in rural areas | Short term (≤ 2 years) |
| VAT compliance burden on micro-sellers under EU rules | -0.7% | National, affecting cross-border sellers | Medium term (2-4 years) |
| Language fragmentation limiting local-content merchandising | -0.5% | National, particularly affecting Romanian/Russian content | Long term (≥ 4 years) |
| Source: Mordor Intelligence | |||
Fragmented Last-Mile Delivery: The Rural Connectivity Challenge
Roughly 60% of Moldovans live outside Chișinău, yet courier density remains urban-centric, resulting in slower fulfilment and higher shipping fees. Parcel-locker deployments help, but low population density and aging road infrastructure keep unit economics challenging. Retailers experiment with pickup-point partnerships in petrol stations and grocery outlets to bridge service gaps.
Low Consumer Trust: The Cash-on-Delivery Conundrum
Cash-on-delivery (COD) still dominates rural transactions. COD drives return rates up to 18%, inflating reverse-logistics costs. Regulatory caps on high-value cash payments effective 2025 will nudge adoption of cards and wallets, yet merchants must reinforce buyer-protection messaging to convert entrenched COD users.
*Our forecasts treat driver/restraint impacts as directional, not additive. The impact forecasts reflect baseline growth, mix effects, and variable interactions.
Segment Analysis
By Business Model: Corporate Digital Procurement Gains Momentum
The Moldova e-commerce market size for B2C transactions stood at USD 0.77 billion in 2025, accounting for a 75.40% revenue share. Corporate buyers, however, are triggering the next growth wave: the B2B segment is projected to grow 10.84% annually to 2031, driven by EU supply-chain harmonisation and the World Bank-backed MSME Competitiveness Project.
Large agribusinesses and manufacturing exporters already source packaging, spares and ICT hardware online, trimming procurement cycle times by up to 30%. Platform providers are introducing punch-out catalogues, dynamic pricing and integration with enterprise resource-planning (ERP) suites, narrowing the functionality gap with Western peers. As corporate workflows digitalise, category spending migrating online is set to outstrip household consumption growth.


By Device Type: Smartphones Dictate User-Experience Priorities
Smartphone-initiated orders formed 69.40% of the Moldova e-commerce market in 2025, and are tracking a 11.76% CAGR to 2031. The convenience of tap-to-pay, push notifications and in-app loyalty schemes keeps mobile retargeting efficiency high relative to desktop banners.
Operators now cover 95.7% of active SIMs with broadband speeds; 5G pilots launched in Chișinău produce latency below 15 ms. Merchants respond with lightweight progressive-web-app frameworks that load under 3 seconds on 4G, minimising bounce rates. Desktop sessions persist for high-ticket items such as modular furniture, but the revenue mix will continue gravitating toward handheld devices.
By Payment Method: Wallets Break the Card-COD Duopoly
Cards controlled 53.40% of payment volume in 2025, yet digital wallets are on a 12.65% CAGR trajectory. Their biometric authentication, embedded loyalty perks and zero-FX cost on euro transactions under SEPA enhance adoption, particularly among Gen Z shoppers.
Wallet providers integrate BNPL modules that split invoices into interest-free instalments, lifting average order value by 18% in electronics and home-improvement categories. COD’s share is gradually eroding, pressured by regulatory cash caps and higher courier surcharges. Payment orchestration platforms now route transactions dynamically, ensuring redundancy and maximising authorisation rates across local banks.
By B2C Product Category: Groceries Accelerate Urban Basket Shift
Fashion held 31.60% of the Moldova e-commerce market share in 2025, propelled by frequent purchase cycles and manageable reverse logistics. Food and beverages, however, exhibit the steepest 13.25% CAGR through 2031, nudged by COVID-era habit shifts and the rapid expansion of chilled-chain fulfilment networks.
Grocery chains such as Kaufland offer ≤90-minute delivery in Chișinău, bundling loyalty points redeemable both online and in-store. Consumer electronics remains a staple, yet average replacement cycles lengthened from 28 to 32 months, moderating unit sales growth. Beauty, personal care and pet supplies capture incremental wallet share due to their recurring-purchase nature and low return rates, reinforcing customer-lifetime-value economics for omnichannel retailers.
Geography Analysis
The Moldova e-commerce market interfaces closely with European trade flows: the EU accounts for 53.7% of overall trade and absorbs 65.4% of Moldovan exports. DCFTA provisions simplify compliance, enable mutual recognition of electronic signatures and lower logistics costs along Prut River border crossings.
Urban-rural disparity defines domestic demand dynamics. Chișinău hosts nearly half of online sales thanks to higher disposable income, dense courier coverage and a tech-literate workforce. Bălți, Cahul and Ungheni form secondary nodes where parcel-locker density and same-day delivery pilots are gaining momentum. Rural districts, though home to 1.8 million residents, lag on both broadband affordability and last-mile reliability, dampening uptake.
Cross-border consumer shopping is growing at a 13.20% annual clip, reflecting wider product assortments on EU-based platforms that now ship under streamlined customs rules. Integration with SEPA reduces checkout abandonment by removing hidden currency-conversion fees. Nevertheless, language duality (Romanian and Russian) complicates search-engine optimisation and merchandising localisation for global merchants, curbing potential conversion rates.
Competitive Landscape
Roughly 1,700 local e-shops compete across niches ranging from books to auto parts. Classifieds portal 999.md maintains traffic leadership, aided by its parent Simpals’ ecosystem of media and payment services. Marketplaces like Makler.md and OLX replicate peer-to-peer models, yet face rising compliance scrutiny over VAT and product-safety obligations.
Romania’s eMAG disclosed plans for Moldovan expansion in 2025-2026. Its entry could reset delivery-speed benchmarks and accelerate category consolidation, particularly in electronics and general merchandise. International platforms AliExpress and Amazon rely on postal parcels and freight forwarders, which elongate delivery timelines to 8-15 days, leaving space for local champions on speed-sensitive SKUs.
Competitive differentiation is shifting toward embedded-finance offerings, real-time stock visibility and hyper-local fulfilment. Several mid-tier players explore micro-fulfilment centres inside supermarket backrooms to achieve sub-2-hour delivery. Strategic alliances between couriers and fuel-station chains expand pickup-point density, while payment-service providers bundle escrow and buyer-protection modules to convert COD users to prepaid orders.
Moldova E-commerce Industry Leaders
Makler.md
999.md
AliExpress.com
eBay.com
Amazon.com
- *Disclaimer: Major Players sorted in no particular order

Recent Industry Developments
- March 2025: Moldova joined SEPA, enabling local banks to send and receive SEPA Credit Transfers, SEPA Instant and SEPA Direct Debits; full operational readiness is set for 5 Oct 2025
- February 2025: Paynet implemented Strong Customer Authentication, introducing biometric and PIN verification for selected transactions.
- October 2024: The Moldova Growth Plan launched, prioritising EU market access and structural reforms.
- October 2024: Government introduced phased restrictions on large-value cash payments effective 2025.


Research Methodology Framework and Report Scope
Market Definitions and Key Coverage
Our study defines the Moldova e-commerce market as the total gross merchandise value generated through digital storefronts registered in Moldova or shipping primarily to Moldovan consumers, encompassing B2C and B2B transactions completed via desktop or mobile devices and settled through any electronic or cash-on-delivery method. Revenues from online travel bookings, food delivery intermediaries, and cross-border purchases settled on foreign sites are included when paid by Moldovan residents.
Scope Exclusion: Peer-to-peer resale platforms and purely digital content such as music or videogame downloads fall outside this scope.
Segmentation Overview
- By Business Model
- B2C
- B2B
- By Device Type
- Smartphone / Mobile
- Desktop and Laptop
- Other Device Types
- By Payment Method
- Credit / Debit Cards
- Digital Wallets
- BNPL
- Other Payment Method
- By B2C Product Category
- Beauty and Personal Care
- Consumer Electronics
- Fashion and Apparel
- Food and Beverages
- Furniture and Home
- Toys, DIY and Media
- Other Product Categories
Detailed Research Methodology and Data Validation
Primary Research
To ground the desk findings, we interviewed marketplace operators, last-mile couriers, card issuers, and consumer-finance specialists across Chisinau, Balti, and two rural districts. Structured questionnaires probed average order values, failed-delivery ratios, and the speed of digital-wallet adoption, allowing us to reconcile model gaps and fine-tune growth drivers flagged by secondary data.
Desk Research
Analysts first mapped the addressable base using open data from the National Bureau of Statistics, the National Bank's card-payment dashboards, customs import tallies, and telecom authority traffic reports. Complementary insight came from regional trade bodies such as Ecommerce Europe, the European Commission's Digital Economy reports, and periodic surveys by the International Trade Administration. Company filings, local press releases, and payment-processor disclosures enriched assumptions on shopper penetration and average basket values. Subscription databases, including D&B Hoovers for retailer financials and Dow Jones Factiva for deal tracking, added further context. This list is illustrative; many additional public and paid sources were consulted during validation.
A second pass extracted historical GMV baselines, smartphone ownership rates, logistics spend, and VAT-adjusted retail turnover. Where official statistics lagged, proxy indicators, parcel volume, card-not-present transactions, and declared import values were harvested and benchmarked year on year.
Market-Sizing & Forecasting
The core model starts with a top-down reconstruction: total household consumption, adjusted for online-buying propensity and cross-border leakage, produces the demand pool. Select bottom-up checks, sample retailer GMV roll-ups and blended ASP × order frequency, serve as guardrails. Key variables include smartphone penetration, broadband speed quartiles, average interchange fees, parcel drop density, and disposable income per capita. A multivariate regression with three lagged drivers, device penetration, card-not-present volume, and disposable income, underpins the 2025-2030 forecast. Where bottom-up estimates deviated beyond three percent, figures were iterated with fresh source calls before lock-in.
Data Validation & Update Cycle
Outputs undergo variance screening, peer review, and senior analyst sign-off. We refresh every twelve months, issuing interim adjustments after material regulatory or macro shocks, so clients always receive the latest view.
Why Mordor's Moldova E-Commerce Baseline Commands Reliability
Published numbers often diverge because firms select different transaction types, currency conversions, and refresh cadences. By anchoring on regulator-reported payments and validating with on-ground interviews, Mordor delivers a stable yet responsive benchmark.
Key gap drivers include whether foreign-site spending is counted, the inflation deflator chosen, and the frequency of model updates; many publishers rely on static 2023 inputs or apply broad Eastern Europe averages.
Benchmark comparison
| Market Size | Anonymized source | Primary gap driver |
|---|---|---|
| USD 1.02 B (2025) | Mordor Intelligence | - |
| USD 1.10 B (2023) | Global Consultancy A | Uses regional proxy for cross-border flows, limited 2024 refresh |
| USD 1.20 B (2027 forecast) | Research Boutique B | Excludes B2B, extrapolates from 2020-2022 card data only |
| EUR 358.6 M (2023) | Industry Association C | Omits service categories, reports net of VAT, rural coverage partial |
Taken together, the comparison shows that Mordor's disciplined scope selection, multi-source triangulation, and annual updates yield a balanced baseline that decision-makers can trace, replicate, and trust.


Key Questions Answered in the Report
What is the current size of the Moldova e-commerce market?
The market is valued at USD 1.12 billion in 2026 and is projected to reach USD 1.75 billion by 2031 at a 9.43% CAGR during 2026-2031.
Which segment is expanding the fastest?
On the business-model axis, B2B e-commerce shows the highest momentum at an 10.84% CAGR through 2031.
How dominant is mobile shopping?
Smartphones generated 69.40% of online orders in 2025, and their share is increasing at a 11.76% CAGR.
Which payment method is gaining ground most rapidly?
Digital wallets lead growth with a 12.65% CAGR, supported by SEPA integration and biometric authentication.
What categories offer the strongest upside?
Food and beverages sales are forecast to grow 13.25% annually, reflecting improved cold-chain logistics and evolving consumer habits.
How will eMAG’s entry influence competition?
EMAG’s advanced logistics and marketplace model are likely to raise service benchmarks, prompting local players to accelerate delivery and payment innovations.
Page last updated on:


