
Mineral Wool Market Size and Share
Market Overview
| Study Period | 2020 - 2031 |
|---|---|
| Market Size (2026) | USD 20.73 Billion |
| Market Size (2031) | USD 27.39 Billion |
| Growth Rate (2026 - 2031) | 5.72 % |
| Fastest Growing Market | Asia Pacific |
| Largest Market | Asia Pacific |
| Market Concentration | Medium |
Major Players *Disclaimer: Major Players sorted in no particular order Image © Mordor Intelligence. Reuse requires attribution under CC BY 4.0. | |
Mineral Wool Market Analysis by Mordor Intelligence
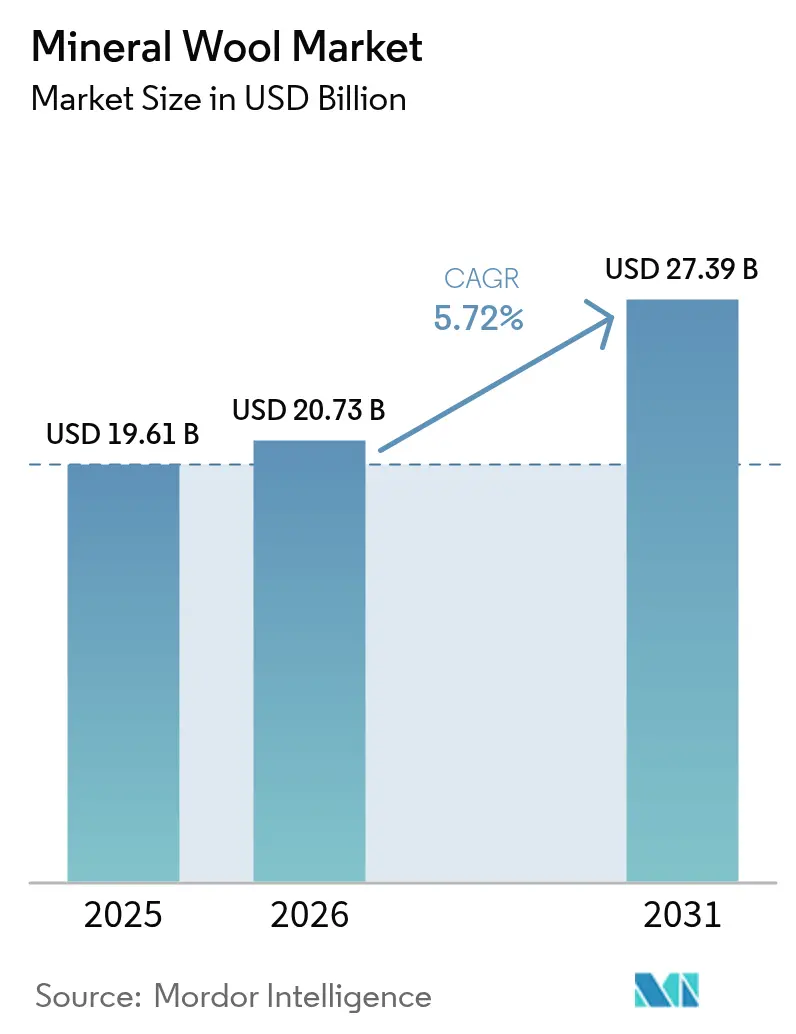
Mineral Wool market size in 2026 is estimated at USD 20.73 billion, growing from 2025 value of USD 19.61 billion with 2031 projections showing USD 27.39 billion, growing at 5.72% CAGR over 2026-2031. This underscores strong momentum around decarbonized buildings, stricter fire safety mandates, and the push for a circular economy. Momentum stems from four forces: 1) continuous tightening of energy-performance codes that elevate non-combustible insulation as the default wall-cavity choice, 2) litigation risk in high-rise façades that accelerates the switch away from polymer foams, 3) a supply-side shift toward recycled-content glass wool that cuts embodied carbon and opens public-procurement doors, and 4) outsized demand from electric-vehicle battery enclosures that need mats rated above 800°C. Competitive strategies center on vertical integration into raw materials, including glass, basalt, and binders, while challengers target premium niches, such as aerogel-hybrid boards. Opportunities arise in closed-loop recycling, ultra-thin insulation for land-constrained cities, and modular prefab panels that slash on-site labor.
Key Report Takeaways
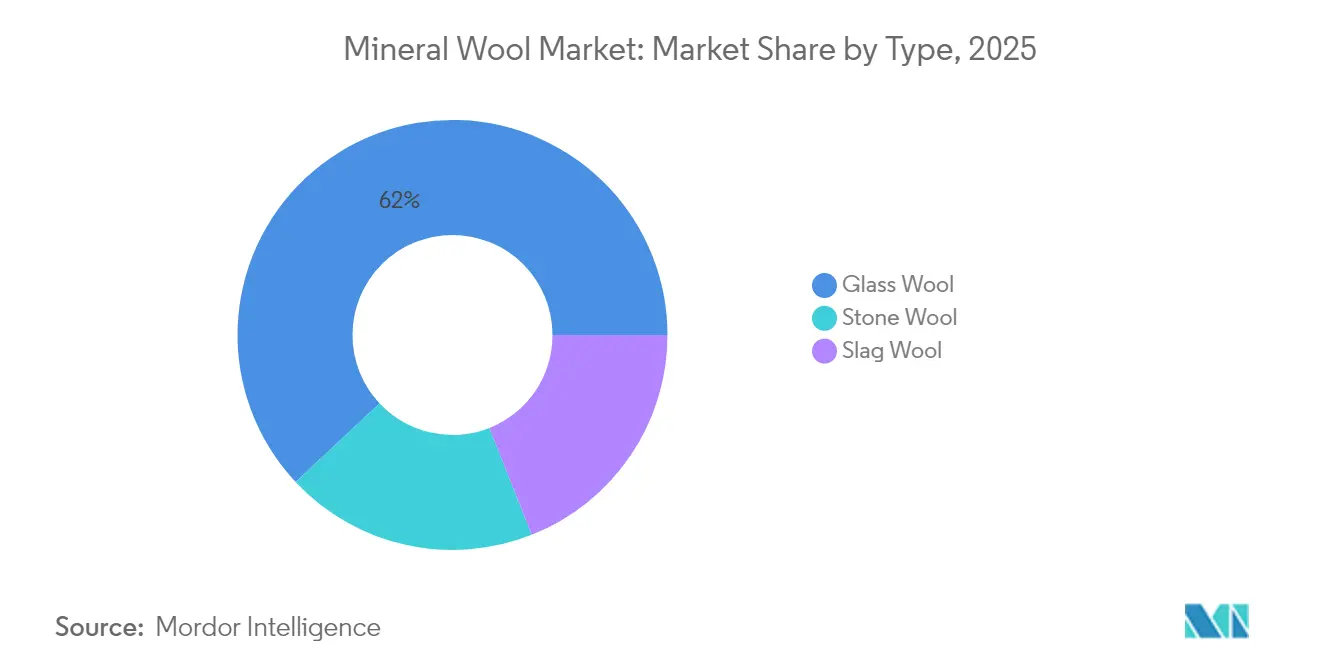
- By type, glass wool led with a 61.98% market share of the mineral wool market in 2025 and is projected to advance at a 6.78% CAGR through 2031.
- By product type, blanket formats captured 67.12% of the mineral wool market size in 2025; this product type is also the fastest-growing, with a 6.22% CAGR through 2031.
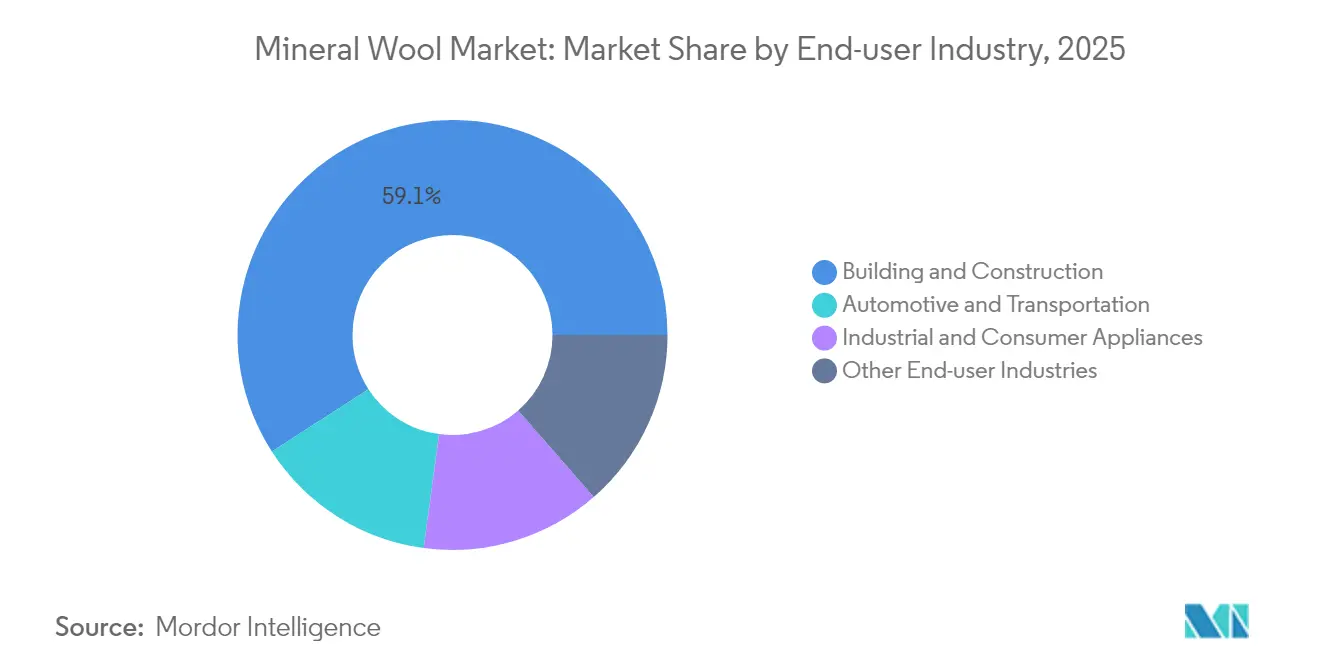
- By end-user industry, the building and construction sector contributed 59.12% of demand in 2025, and it is expected to expand at a 6.1% CAGR through 2031.
- By geography, the Asia-Pacific region accounted for 41.78% of the mineral wool market in 2025, and it is projected to post the fastest 6.25% CAGR from 2025 to 2031.
Note: Market size and forecast figures in this report are generated using Mordor Intelligence’s proprietary estimation framework, updated with the latest available data and insights as of 2026.
Market Trends and Insights
Drivers Impact Analysis of Mineral Wool Market*
| Driver | (~) % Impact on CAGR Forecast | Geographic Relevance | Impact Timeline |
|---|---|---|---|
| Building and construction boom in energy-efficient envelopes | +2.1% | Global (China, India, EU-27, North America) | Medium term (2-4 years) |
| Mandatory energy-performance and fire-safety regulations | +1.8% | EU-27, UK, China, India, Australia | Short term (≤2 years) |
| Tightening green-building codes in emerging Asia-Pacific | +1.3% | China, India, ASEAN | Medium term (2-4 years) |
| Circular-economy push for mineral-wool recycling streams | +0.6% | EU-27 | Long term (≥4 years) |
| Rise of modular prefab panels accelerating demand | +0.9% | North America, Northern Europe, Australia | Short term (≤2 years) |
| Source: Mordor Intelligence | |||


Building And Construction Boom In Energy-Efficient Envelopes
Global decarbonization policies are steering retrofit budgets toward mineral-wool-based envelopes that pair air-sealing membranes with smart glazing. Regulation 2024/1681 in the EU obliges member states to renovate 3% of public buildings yearly, translating to a EUR 275 billion insulation opportunity this decade. India’s 2024 Energy Conservation Building Code overlays prescriptive U-values across 27 climate zones, while China’s DG/TJ08-205-2024 locks in 75% energy savings for new projects in Shanghai. Modular construction—scaling at 6.2% CAGR through 2024—now embeds mineral-wool cores into factory-built wall cassettes, trimming on-site labor by 40% and compressing installation schedules[1]Modular Building Institute, “2024 Modular Construction Report,” modular.org.
Mandatory Energy-Performance And Fire-Safety Regulations
Litigation over combustible façades propels the mineral wool market as regulators outlaw polymer foams in tall buildings. The UK’s 2024 update to Approved Document B bans non-A-rated insulation above 18 m, a benchmark mirrored by Australia’s National Construction Code 2025 Performance Requirement FP1.4. EU Regulation 2024/3110 extends reaction-to-fire tests to sandwich panels, closing loopholes that once favored polyurethane cores. Parallel limits on VOCs in phenolic binders, as outlined in the Industrial Emissions Directive 2024/1785, reduce foam-production costs, narrowing the price gap with mineral wool[2]European Parliament, “Regulation 2024/1681 on the Energy Performance of Buildings,” europa.eu.
Tightening Green-Building Codes In Emerging Asia-Pacific
Emerging Asia is leapfrogging legacy rules by embedding envelope thermal modeling into permit processes. India links floor-area-ratio bonuses to four-star GRIHA certification, mandating cavity insulation in most climate zones. Vietnam’s 2024 Circular 08/TT-BXD imposes energy audits for commercial buildings larger than 2,500 m², while Indonesia subsidizes mineral wool in 50,000 affordable homes. Guangzhou now requires thermal-performance reports that benchmark insulation thicknesses of 60–100 mm before project approval, signaling a shift toward performance-based design.
Circular-Economy Push For Mineral-Wool Recycling Streams
Europe produced 2.5 million tons of mineral-wool waste in 2020, yet recycling stood below 10%. Austria’s landfill ban from 2027 forces producers to build take-back loops, targeting a 30% recycling rate by 2030, which will add EUR 8–12 per m² for demolition contractors, as per BML.GV.AT. Rockwool and Knauf operate pilot plants in the Netherlands and Sweden that re-blend cleaned wool into virgin melts at a 15–20% ratio, reducing furnace energy consumption by 25%. New EU End-of-Waste criteria finalized in 2024 designate clean mineral wool as a secondary raw material, trimming cross-border shipping costs by 40%.
Restraints Impact Analysis of Mineral Wool Market*
| Restraint | (~) % Impact on CAGR Forecast | Geographic Relevance | Impact Timeline |
|---|---|---|---|
| Health and carcinogenicity concerns over respirable fibres | −0.7% | Global (EU-27, North America) | Medium term (2-4 years) |
| Price-driven substitution by low-cost polymer foams | −1.2% | ASEAN, Latin America, Middle East & Africa | Short term (≤2 years) |
| Volatile basalt/coke/binder input prices | −0.5% | Europe | Short term (≤2 years) |
| Source: Mordor Intelligence | |||
Health And Carcinogenicity Concerns Over Respirable Fibres
Ambiguity around bio-solubility fragments market access. EU Note Q exempts modern fibers from carcinogen labeling if the weighted half-life in lung fluid is under 40 days, yet OSHA still mandates hazard warnings on fibers below 3 µm. Insurance premiums for U.S. contractors rose 15–25% in 2024 due to liability concerns. 3M’s 2024 patent for ≥3 µm ceramic-glass fibres achieves 1,000°C performance while sidestepping respirable-dust generation, hinting at next-generation non-respirable products.
Price-Driven Substitution By Low-Cost Polymer Foams
Mineral wool trades at a 50–60% premium to EPS and a 20–30% premium to PIR because melting basalt or cullet at 1,400 °C is an energy-intensive process. Gas-linked input spikes in late 2023 lifted rock-wool list prices by 4.8–5.9% across Europe, while petrochemical foams enjoyed 12% cheaper feedstocks. In Southeast Asia, EPS controls 65% of low-rise insulation; mineral wool penetration is <15% beyond Singapore and Malaysia, where fire codes are stricter.
*Our forecasts treat driver/restraint impacts as directional, not additive. The impact forecasts reflect baseline growth, mix effects, and variable interactions.
Mineral Wool Market Segment Analysis
By Type:
Glass Wool Growth Outpaces Stone WoolGlass wool represented 61.98% of 2025 demand and continues to expand at a 6.78% CAGR, giving it the clear lead in the mineral wool market. The segment benefits from recycled-content mandates; Recticel integrated 19.2% post-consumer cullet in 2024 and targets 25% by 2030, reducing embodied carbon by 1.2 kg CO2-eq per kg of product. Stone wool, prized for its service temperatures exceeding 600 °C in industrial settings, grows more slowly at 5.55% because its density of 120–160 kg/m³ inflates logistics costs by 40% compared with glass wool batts. Slag wool remains inexpensive in Eastern Europe and parts of China due to the abundance of blast-furnace slag; however, as steel mills shift to electric-arc technology, this outlet is expected to shrink, restraining its 4.12% CAGR growth.
Second-order effects reinforce glass wool’s ascendancy. Owens Corning reported USD 1.02 billion in insulation revenue for Q3 2024, a 6% increase, driven by glass-wool shipments across the southern United States, where code-mandated R-30 walls have become the default. Conversely, Rockwool’s Asia-Pacific sales declined 5% as Chinese builders shifted to glass-wool blankets for easier retrofitting. Ultra-thin battery-pack mats, built on glass-ceramic composites patented by 3M, create fresh high-margin niches that stone wool cannot meet owing to density constraints.


By Product Type:
Blankets Dominate Residential RetrofitsBlanket insulation controlled 67.12% of 2025 volume and is tracking a 6.22% CAGR to 2031, reinforcing its dominance in the mineral wool market. Retrofits in houses built before 1990 drive demand for blankets because compressible batts can be easily installed into irregular stud bays without the need for adhesives, reducing installation labor by 30–40%. Board products, with an 18.96% share, serve curtain-wall façades and sub-grade walls where a compressive strength of more than 40 kPa is mandatory. They log a 5.63% CAGR as rainscreen cladding becomes mainstream in commercial builds.
Loose-fill commands 10.48% share, supported by a 5.86% growth path lifted by US federal tax credits that reimburse 30% of attic-insulation spend up to USD 1,200 annually. Saint-Gobain’s Isover brand introduced a bio-based binder in 2024 that reduces formaldehyde emissions by 60%, alleviating concerns about indoor air quality in schools and hospitals. Smaller niches—including stitched mats and wired blankets for marine bulkheads—collectively hold 3.44% but command premium pricing due to weight and fire-resistance needs.
By End-User Industry:
Buildings Lead, EVs AccelerateBuilding and construction accounted for 59.12% of mineral wool in 2025 and is projected to rise by 6.1% annually to 2031, maintaining its position as the anchor customer. North American orders leapt 8% in Rockwool’s Q3 2024 books on the back of Inflation Reduction Act subsidies targeting envelope retrofits, yet Europe stayed flat as German permits fell 20% and France postponed EPBD enforcement to mid-2025. India’s green-materials market, meanwhile, is sprinting toward USD 38 billion next year, drawing seven domestic wool makers into the GRIHA catalogue.
Lithium-ion battery packs can reach temperatures of up to 800°C in thermal runaway events, and glass-ceramic mats outperform polymer foams in both temperature tolerance and non-combustibility. Industrial and consumer appliances are squeezed by aerogel blankets that achieve equal R-values at one-third the thickness. Marine, aerospace, and other niche sectors supply the remaining 13.59%, with composite-integrated solutions chipping away at conventional wool usage.
Geography Analysis
APAC Mineral Wool Market
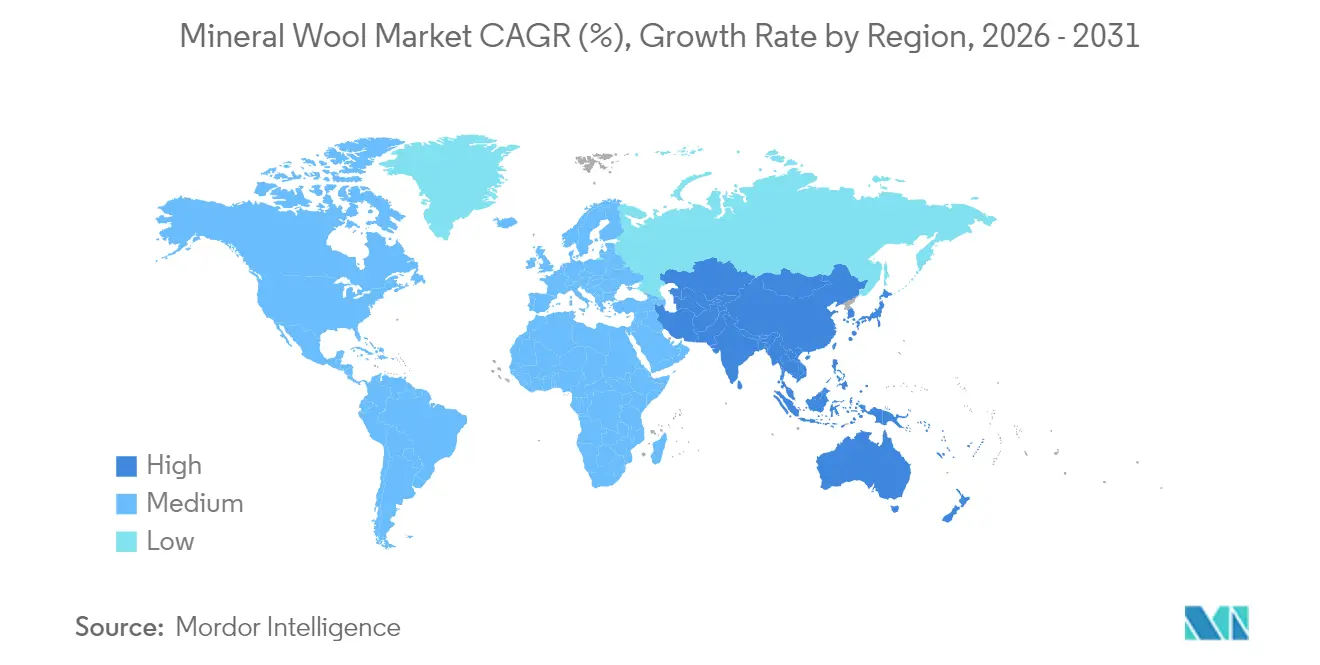
The Asia-Pacific region dominated with 41.78% of global demand in 2025 and is projected to advance at a 6.25% CAGR to 2031, reinforcing its position at the center of the mineral wool market. Shanghai’s DG/TJ08-205-2024 code mandates 75% energy savings, effectively prescribing continuous exterior insulation, while Beijing and Shenzhen issue similar drafts. India’s revised ECBC lists prescriptive wall and roof U-values, pairing them with FAR incentives, which catalyze the uptake of mineral wool in commercial high-rises. Japan budgeted JPY 120 billion in 2024 to retrofit pre-1980 homes, and South Korea’s Green Remodeling Fund covers up to 50% of insulation costs, spurring blanket orders for multi-family towers.
North America Mineral Wool Market
In North America, Rockwool earmarked DKK 1.3 billion for new lines in Mississippi and upgrades in Ontario, ensuring local supply as demand accelerates. Owens Corning leverages its backward-integrated glass capacity to protect its 31.4% insulation EBITDA margin, even as soda-ash prices fluctuate. Canada’s 2024 budget sets aside CAD 4.4 billion for home-energy rebates, while Mexico now insists on thermal insulation in social-housing zones with >1,500 heating- or cooling-degree-days.
Europe Mineral Wool Market
In Europe, construction softness in Germany, France, and Italy chills demand, though Regulation 2024/1681 obliges 3% annual retrofit of public buildings, equating to EUR 275 billion insulation spend to 2030. Eastern Europe and the Nordics offset some weakness: Poland’s Cigacice plant expansion adds 50,000 t of stone-wool capacity, and Sweden buys recycled-content boards to fulfill circular-procurement rules.
Middle East and South America Mineral Wool Market
Saudi mega-projects NEOM and Qiddiya specify non-combustible insulation in high-rise towers, drawing Kingspan and Saint-Gobain investments in Dammam. Brazil now enforces roof R-values in five bioclimatic zones under Programa Casa Verde e Amarela, opening blanket demand across São Paulo and Rio Grande do Sul. The UAE updated its Green Building Regulations in 2024, obliging envelope insulation on all conditioned buildings beyond 500 m².

Regulatory Landscape
Building-energy and fire-safety policy continues to tighten insulation specifications across major demand centers, increasing compliance requirements for non-combustible mineral wool and raising expectations for documentation supporting performance claims. In the European Union, the recast Energy Performance of Buildings Directive (EU) 2024/1275 became effective from 24 May 2026, requiring Member States to set minimum energy performance requirements and establish national building renovation plans that operationalize zero-emission building pathways; Ireland transposed this via S.I. No. 168/2026 and introduced an A0 category for zero-emission buildings. In the United Kingdom, 2026 updates tied to Future Homes and Buildings Standards (supported by Approved Document L 2026) further elevate whole-dwelling energy outcomes, while parallel fire-safety rules (including bans on lower-rated insulation in tall buildings referenced in the report context) reinforce mineral wool adoption in exterior-wall and facade applications.
Regulation is also expanding beyond operational energy into product verification, labeling, and manufacturing emissions controls. In the United States, FTC insulation labeling requirements under 16 CFR Part 460 continue to govern R-value disclosures, while the U.S. EPA is advancing low-embodied-carbon procurement infrastructure via Product Category Rules and related criteria for construction materials supported by Inflation Reduction Act funding, pushing suppliers toward standardized environmental reporting. New Zealand updated Building Product Specifications (Amendment 1 effective 2 April 2026), defining technical requirements for determining insulation thermal resistance (R-value) using specified ASTM and ISO standards and increasing the emphasis on test-method traceability for products sold into regulated building pathways.
Value Chain Analysis
The mineral wool value chain starts with raw materials and energy supply, then moves through high-temperature melting, fiberization, binder application, curing, finishing, and distribution into construction and industrial channels. Glass wool relies heavily on silica sand and recycled glass (cullet), while stone/rock wool uses basalt/diabase and, in some regions, slag; binders and additives are critical for handling, VOC performance, and end-use specifications. Production is energy intensive because melting takes place at very high temperatures, making plants sensitive to natural gas, coal, and electricity pricing and to emissions-control requirements (for example, U.S. EPA NESHAP requirements governing mineral wool production emissions). This input mix and energy profile drives many leading players toward vertical integration and long-term sourcing to stabilize cost and quality.
Manufacturers then sell through a mix of direct accounts (industrial end users, OEMs, large contractors) and intermediated channels (specialty insulation distributors, building-material merchants, installer networks), with logistics and density influencing cost-to-serve by product type (blankets and batts versus boards). On the demand side, building codes and fire standards (Euroclass A1/A2 and country equivalents) require certification, documentation, and third-party test evidence, pulling technical service and compliance into the commercial process. End-of-life and circularity are becoming more operationally relevant, particularly in Europe where take-back and recycling pilots (noted in the report context) add reverse-logistics steps and reprocessing interfaces back into the melt, linking demolition contractors and waste handlers more tightly to producer networks.
Competitive Landscape
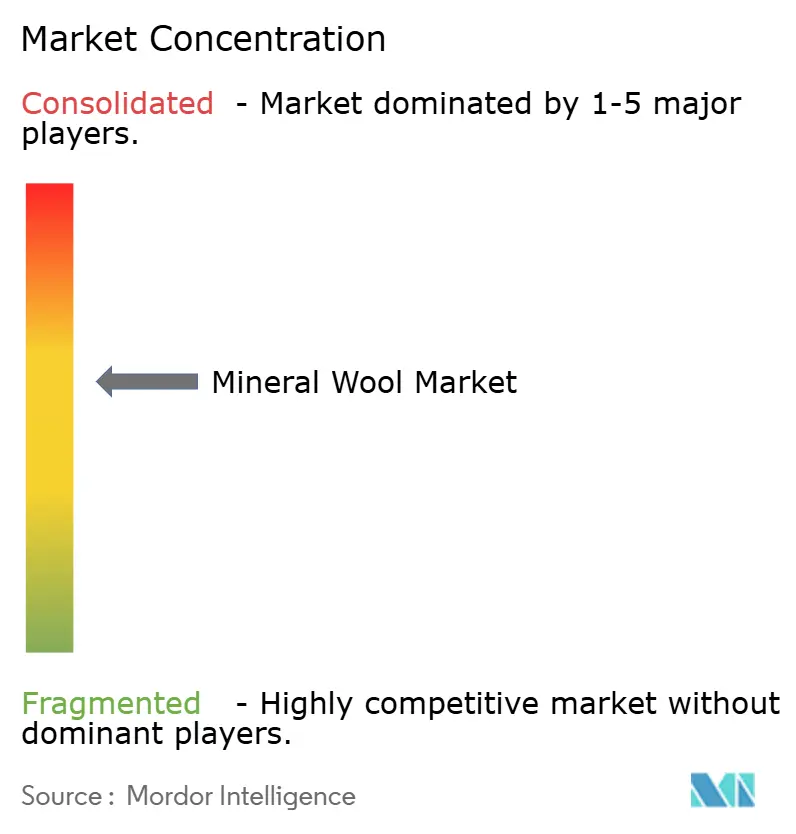
The Mineral Wool market is moderately concentrated. Rockwool operates 51 plants across 39 countries and booked EUR 2.96 billion in nine-month revenue, with a 23.4% EBITDA margin, thanks to in-house basalt quarries and coke furnaces. Owens Corning generated USD 1.02 billion in Q3 2024 insulation sales and sustains a 31.4% segment margin via captive glass-fiber lines that buffer silica-sand volatility. Saint-Gobain’s High Performance Solutions arm nudged 3.3% growth against flat group sales by pivoting to aerogel and vacuum-insulated panels that deliver R-50-plus per inch, doubling mineral wool yet commanding triple-digit premiums. Niche innovators fill whitespace. Aspen-Aerogels assets boost Saint-Gobain’s ultra-thin portfolio, while TECHNONICOL’s 2024 BIM plugin slashes design time 40% for Russian and Eastern European contractors.
Mineral Wool Industry Leaders
Saint-Gobain
ROCKWOOL A/S
Owens Corning
Knauf Insulation
Johns Manville
- *Disclaimer: Major Players sorted in no particular order
Mineral Wool Market Companies Covered in this Report
- ARMACELL
- BRUCHA Panel
- CertainTeed, LLC
- Etex Group
- Fletcher Insulation
- Guardian Fiberglass
- Isolatek International
- Johns Manville
- Kingspan Group
- Knauf Insulation
- Lattonedil
- Owens Corning
- Recticel
- Rockwool International AS
- Saint-Gobain
- TECHNONICOL
- USD Corporation

Market Opportunities and Future Outlook
White-space is opening where building policy and procurement are moving from prescriptive insulation thickness toward verified performance, embodied-carbon documentation, and fire-safe envelope design. The EU recast EPBD (Directive (EU) 2024/1275, effective from 24 May 2026) pushes Member States toward minimum energy performance requirements and national renovation plans, which elevates demand for insulation systems that can be documented for both thermal performance and compliance pathways. In parallel, public procurement signals are sharpening around standardized environmental reporting in the United States through EPA-led criteria and Product Category Rules for construction materials, creating a clearer route for mineral wool producers that can supply consistent EPD-ready data and recycled-content formulations for government and institutional projects.
Supply-side investments and portfolio moves show where manufacturers are placing capacity and capability to meet these requirements while localizing supply. ROCKWOOL broke ground in April 2026 on a USD 175 million stone wool manufacturing facility in Wallula, Washington, underscoring the focus on North American capacity close to construction markets, while ROCKWOOL also signed an agreement in May 2026 to acquire a stone wool factory in Hungary from Ravago Building Solutions, supporting an expanded European footprint and shorter lead times. Product innovation for code-driven applications is also visible: Byucksan launched a lightweight mineral wool product for sandwich panels in April 2026 in Korea with a fire-resistant structure certification focus, pointing to demand in panelized construction where combustibility scrutiny is high. On the constraints side, tighter air-emissions requirements for mineral wool manufacturing (including a U.S. EPA final rule referenced in the evidence pack) increase the value of newer plants and upgraded abatement systems, raising barriers for older, smaller facilities and creating scope for consolidation, modernization, and premium pricing where compliance capacity is scarce.
Recent Industry Developments in Mineral Wool Market
- April 2026: ROCKWOOL held a groundbreaking for a USD 175 million stone wool manufacturing facility in Wallula, Washington, strengthening its North American capacity roadmap. The project aligns supply with building-envelope and industrial demand while shortening delivery lanes versus imports and distant plants. The investment also signals continued capital allocation into modern production platforms designed to meet evolving performance and sustainability requirements.
- November 2025: Knauf Insulation Romania opened a new glass mineral wool production facility in Târnăveni, Mureș County with 75,000 tonnes of annual capacity. The site expands regional supply for residential and public-building retrofit programs that are increasingly tied to energy-performance compliance. Added output also increases competitive intensity in Central and Eastern Europe where lead times and local availability often drive brand selection.
- February 2024: Saint-Gobain introduced a bio-based binder for Isover mineral wool that reduces formaldehyde emissions by 60%, addressing indoor air quality and specification barriers in schools, hospitals, and other sensitive buildings. The move supports differentiation in bids where VOC and health criteria are screened alongside R-value and fire rating. It also reinforces the shift toward product designs that reduce installation and occupancy concerns without compromising non-combustibility.


Mineral Wool Market Report Scope and Research Methodology
Market Definition and Coverage
This market covers revenue generated from mineral wool insulation materials sold into end users for thermal, acoustic, and fire protection needs. The sizing is built around mineral wool fibers made from mineral and glass sources and tracked at the point of sale into construction, industrial, and related applications.
Scope exclusions: Excluded from this sizing are non-mineral insulation materials such as polymer foams, cellulose, and other fiber alternatives, even if they are used in the same projects.
Segments Covered in This Report
- By Type
- Glass Wool
- Stone Wool
- Slag Wool
- By Product Type
- Board
- Blanket
- Loose Wool
- Other Product Type
- By End-user Industry
- Automotive and Transportation
- Building and Construction
- Industrial and Consumer Appliances
- Other End-user Industries
- By Geography
- Asia-Pacific
- China
- India
- Japan
- South Korea
- ASEAN Countries
- Rest of Asia-Pacific
- North America
- United States
- Canada
- Mexico
- Europe
- Germany
- France
- United Kingdom
- Italy
- Spain
- Russia
- Rest of Europe
- South America
- Brazil
- Argentina
- Rest of South America
- Middle East and Africa
- Saudi Arabia
- South Africa
- Rest of Middle-East and Africa
- Asia-Pacific
Data Sources, Market Sizing, and Validation
Desk Research
Desk work was used to build the demand context and to keep the model anchored to public signals that move with insulation consumption. We relied on sources such as national construction and housing statistics, energy efficiency and building code publications, customs and trade data releases, and environmental or fire safety standards references.
We also reviewed materials and manufacturing indicators from sources such as industrial production releases, trade association updates, company annual reports and investor presentations, and reputed press coverage on capacity additions and plant utilization. In a few places, we used paid subscriptions for company financials and intelligence, patent databases, and shipment level import and export screening to sanity check volumes and trade flows. These desk sources are not exhaustive, and many other public references were also used for data collection, validation, and clarification.
Primary Interviews and Surveys
Primary work focused on conversations and structured surveys with manufacturers, distributors, installers, and large buyers that specify insulation in projects. Input from these respondents was checked across APAC, EMEA, and the Americas to test demand drivers such as new builds, retrofits, and industrial maintenance, and then adjust assumptions when desk indicators were thin.
Distribution of primary research fieldwork respondents
| Company type | Respondent position | Region |
|---|---|---|
| Top tier: 28% | CXOs: 13% | APAC: 43% |
| Mid tier: 56% | Functional/Unit leaders: 27% | EMEA: 31% |
| Smaller Players: 16% | Managers: 60% | Americas: 26% |
Market-Sizing & Forecasting
The model starts from a top-down build where construction activity and insulation intensity are used to reconstruct the mineral wool demand pool, and then it is expanded into non-building use where applicable. Once that structure is in place, we corroborate totals using selective bottom-up approximations such as sampled price per ton or per square meter by product form, distributor channel checks, and supplier revenue splits, and then correct any overstatement.
Key inputs used in the sizing include building floor area additions and renovation cycles, the share of projects adopting energy efficiency upgrades, fire safety driven specification rates, import and export flows for mineral wool products, and typical price movements by product form (boards, blankets, and loose wool). When direct country data is missing, gaps are handled by proxying from similar construction intensity markets and then rebalancing through interview feedback, so the regional roll-up stays realistic.
For forecasting, scenario analysis was used with a central case guided by expert expectations on construction starts, retrofit programs, industrial capex cycles, and expected price progression under energy and raw material cost trends. The final projection is reviewed so growth does not break known constraints like capacity additions, trade availability, and practical installation limits.
Data Validation & Update Cycle
Outputs are validated by checking whether the implied volumes and pricing are consistent with independent signals such as construction output, insulation penetration trends, and trade flow direction. If a country level result shows unusual jumps, the underlying drivers are rechecked, and follow-up calls are triggered to confirm whether a real event happened or the input is off.
Before sign-off, the model is reviewed in steps, starting with unit checks and assumption ranges, followed by regional roll-up consistency, and then a final analyst review of the full spreadsheet logic. The report is refreshed annually, and interim updates are made when a material event changes demand, supply, or pricing. Right before delivery, a fresh review pass is done so clients receive the latest updated view available.
Mordor Intelligence's Mineral Wool Market Size Measured Against Other Published Estimates
Published market numbers for mineral wool can be far apart, even when the topic sounds the same, because the counted products and the timing assumptions are not always aligned. Differences also come from whether estimates lean more on construction indicators, trade led signals, or supplier revenue cues, and how each source handles pricing over the forecast window.
Ceramic fiber wool and other high-temperature refractories are kept outside Mordor Intelligence's scope, which can pull the total down versus studies that treat them as part of the same mineral wool family. In other cases, a gap shows up because some publishers start from a 2024 base year and then apply a higher growth rate without clearly reconciling to construction and renovation cycles, or they use a faster price uplift assumption across boards and blankets than what buyers and installers report.
Benchmark comparison
| Source | Market Size | Gaps in Research Methodology |
|---|---|---|
| Mordor Intelligence | USD 20.73 B (2026) | |
| Industry Data Provider A | USD 14.80 B (2024) | Uses an earlier base year and applies a relatively high CAGR through 2032, which can underplay the 2025 to 2026 step-up and may blend pricing and volume effects without showing a construction-linked reconciliation. |
| Global Publisher B | USD 15.20 B (2024) | Includes a broader application lens and a longer horizon to 2034, and the stated scope can be interpreted to mix adjacent high-temperature wool categories, which tends to inflate totals compared with insulation-only revenue tracking. |
Looking across the table, the spread is mainly explained by year alignment and what gets counted as mineral wool versus adjacent thermal materials. Our approach stays traceable because the demand pool is tied to construction and industrial indicators, and the pricing logic is checked through channel feedback before totals are finalized.


Key Questions Answered in the Report
How big is the mineral wool market in 2026?
The mineral wool market size is USD 20.73 billion in 2026 and is projected to reach USD 27.39 billion by 2031.
Which product type holds the largest share?
Blanket insulation leads with 67.12% of 2025 volume, thanks to labor savings in residential retrofits.
Why is glass wool growing faster than stone wool?
Glass wool benefits from recycled-content mandates and lower logistics costs, supporting a 6.78% CAGR through 2031.
What drives mineral wool demand in Asia-Pacific?
Stricter energy codes in China and India, plus retrofit subsidies in Japan and South Korea, fuel a 6.25% regional CAGR.
Who are the top players in mineral wool products?
Rockwool International, Owens Corning, Saint-Gobain, Knauf Insulation, and Kingspan together generate about 55–60% of global sales.
Page last updated on:


 Your data is secure and never sold or shared.


