Military Truck Market Size and Share
Market Overview
| Study Period | 2020 - 2031 |
|---|---|
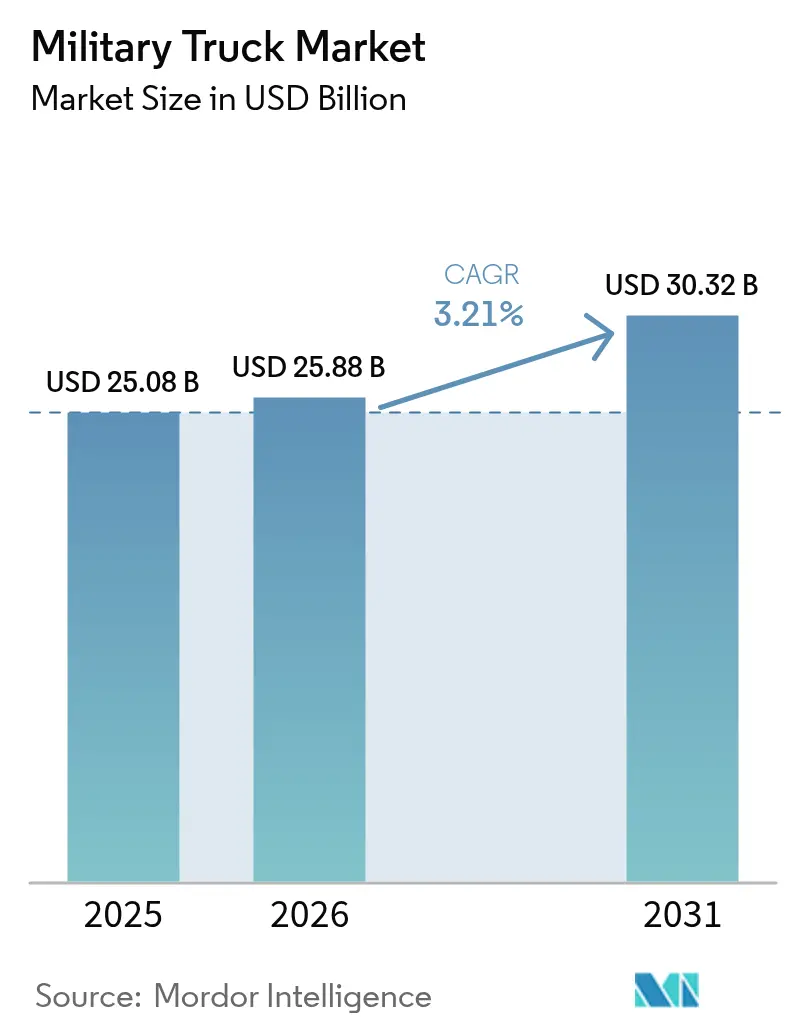
| Market Size (2026) | USD 25.88 Billion |
| Market Size (2031) | USD 30.32 Billion |
| Growth Rate (2026 - 2031) | 3.21% CAGR |
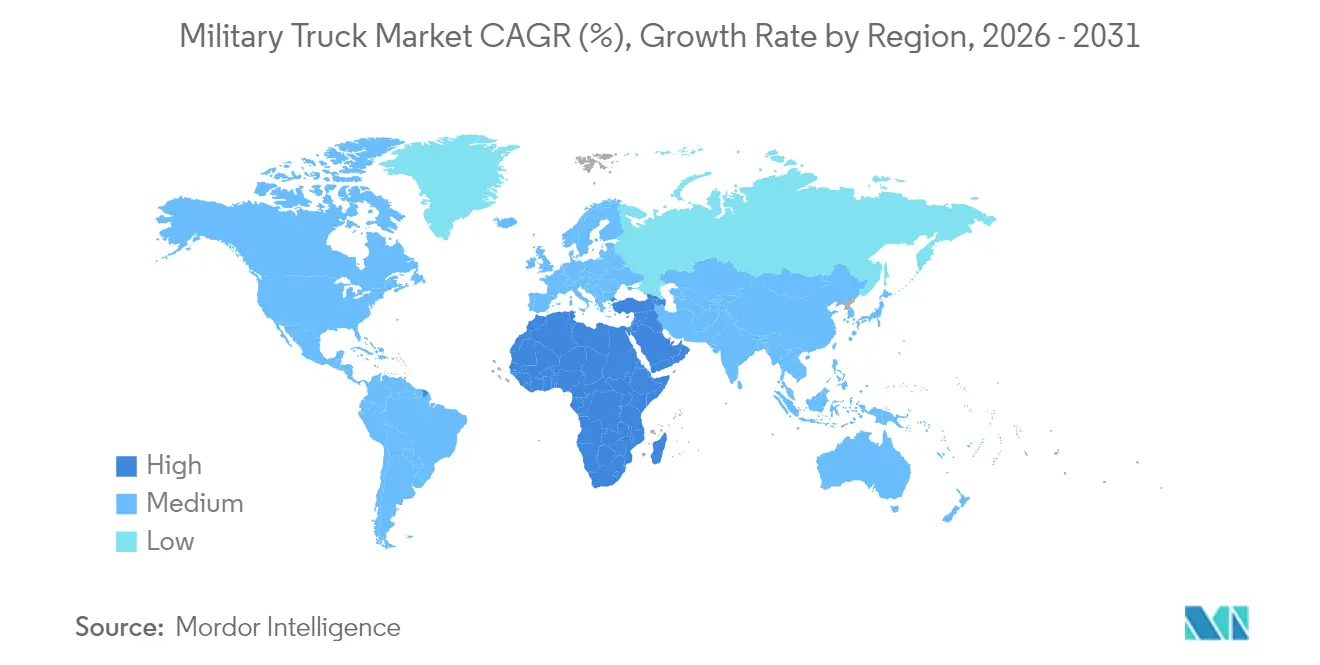
| Fastest Growing Market | Middle East |
| Largest Market | Asia Pacific |
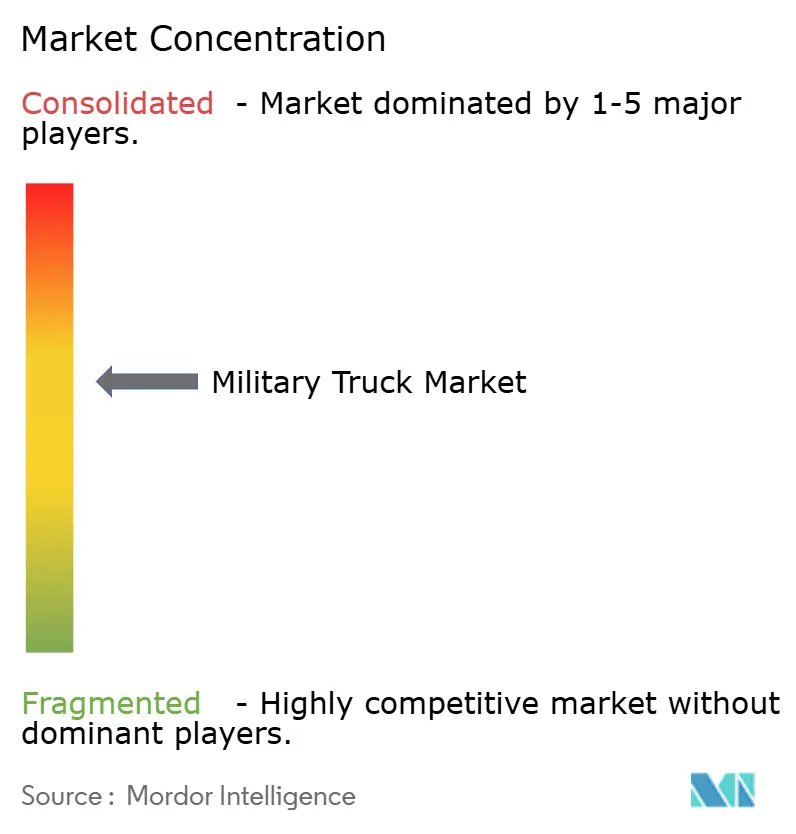
| Market Concentration | Medium |
Major Players *Disclaimer: Major Players sorted in no particular order Image © Mordor Intelligence. Reuse requires attribution under CC BY 4.0. | |
Military Truck Market Analysis by Mordor Intelligence
The military truck market size was valued at USD 25.08 billion in 2025 and estimated to grow from USD 25.88 billion in 2026 to reach USD 30.32 billion by 2031, at a CAGR of 3.21% during the forecast period (2026-2031). Growth remains steady rather than explosive because defense ministries focus on high-value capabilities such as hybrid-electric propulsion, open-systems electronics, and modular mission payloads. Budgets still tilt toward recapitalizing aging fleets that entered service in the 1990s, yet commanders now insist that new vehicles arrive network-ready and fuel-efficient. Demand continues to reflect two intertwined realities: geopolitical flashpoints that raise requirements for rapid logistics and the fiscal pressure to stretch every dollar. As a result, premium valuations persist even while total procurement volumes no longer expand at the rates seen a decade ago, and vendors differentiate on technology rather than raw production scale.
Key Report Takeaways
- By application, troop transport held 39.85% of the military truck market share in 2025, whereas command and control shelter vehicles are forecast to expand at a 6.02% CAGR to 2031.
- By weight class, heavy vehicles (greater than 10 tons Gross Vehicle Weight (GVW)) led with 43.10% of the military truck market size in 2025, while light vehicles (less than 4 tons GVW) are poised to advance at a 5.32% CAGR through 2031.
- By propulsion type, diesel systems accounted for 61.05% of the military truck market size in 2025; hybrid-electric platforms are projected to grow at a 7.31% CAGR.
- By end-user, army forces represented 59.20% revenue in 2025, while special operations units recorded the highest 5.18% CAGR to 2031.
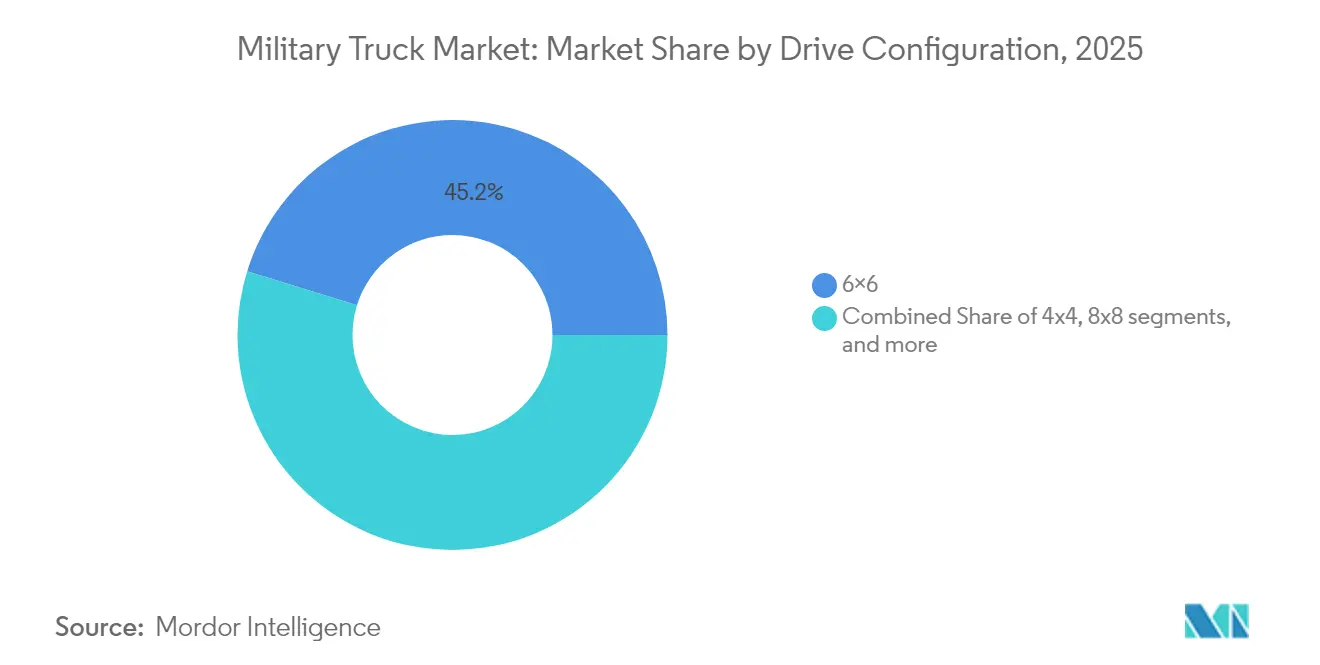
- By drive configuration, 6×6 units controlled 45.20% revenue share in 2025, yet 8×8 designs are expected to show the fastest 6.71% CAGR.
- By transmission, manual retained 67.30% of the market share in 2025, yet automatic is projected to advance at a 7.10% CAGR across the forecast horizon.
- By geography, Asia-Pacific commanded a 33.55% share in 2025, whereas the Middle East is on track for the highest 5.55% CAGR to 2031.
Note: Market size and forecast figures in this report are generated using Mordor Intelligence’s proprietary estimation framework, updated with the latest available data and insights as of 2026.
Global Military Truck Market Trends and Insights
Drivers Impact Analysis*
| Driver | % Impact on CAGR Forecast | Geographic Relevance | Impact Timeline |
|---|---|---|---|
| Rising defense‐equipment modernization budgets | +0.8% | Asia-Pacific and Middle East | Medium term (2-4 years) |
| Fleet recapitalization to replace ageing tactical trucks | +0.6% | North America and Europe | Long term (≥ 4 years) |
| Surge in demand for multi-role logistics platforms | +0.5% | Global (early adoption in NATO) | Short term (≤ 2 years) |
| Modular open-systems architecture enabling plug-and-play mission kits | +0.4% | North America and Europe | Medium term (2-4 years) |
| Hybrid-electric drivetrains that slash fuel-convoy signatures | +0.3% | United States and EU allies | Long term (≥ 4 years) |
| Offset-driven local assembly lines in emerging economies | +0.2% | Middle East and Asia-Pacific | Medium term (2-4 years) |
| Source: Mordor Intelligence | |||
Rising Defense Equipment Modernization Budgets
Military planners are replacing decades-old fleets that no longer match today’s networked battlefield. Saudi Arabia lifted its 2025 appropriation to USD 78 billion and set a 2030 goal of sourcing 50% of systems domestically, a policy that stimulates factory partnerships and knowledge transfer.[1]Army Recognition, “Saudi Arabia Targets 50% Defense Localization,” armyrecognition.com Similar priorities appear across Asia, where governments insist that each new truck integrates encrypted radios, counter-IED wiring, and modular armor. Fresh platforms thus cost more per unit, yet buyers tolerate the premium because they value payload flexibility and digital resilience.
Fleet Recapitalization to Replace Ageing Tactical Trucks
Legacy vehicles that date to the Cold War suffer mounting maintenance bills and cybersecurity gaps. The US Army’s Family of Heavy Tactical Vehicles order, worth USD 1.54 billion, placed with Oshkosh through 2029, illustrates structured replacement that sweeps away 1980s-era trucks. European forces followed suit; Germany signed a logistics contract for EUR 330 million (USD 383.6 million) covering 568 new Rheinmetall trucks in 2025. The recapitalization wave is global because incremental upgrades can no longer fix obsolete electrical architectures.
Surge in Demand for Multi-Role Logistics Platforms
Doctrinal emphasis on expeditionary operations now requires one chassis to serve several missions. The US Marine Corps specifications for its medium tactical truck include hybrid-electric drive, 10 kW onboard power, and palletized modules that swap from cargo to shelter in under an hour. Similar flexibility appears in Dutch procurement of 1,185 modular Manticore vehicles capable of homeland security, disaster relief, and conventional logistics roles. Versatility lowers the overall vehicle count, so commanders favor trucks that re-role quickly.
Modular Open-Systems Architecture Enabling Plug-and-Play Mission Kits
The US Army’s Ground Combat Systems Common Infrastructure Architecture standardizes electronics so that sensors, radios, and electronic-warfare suites bolt onto any new or legacy platform without rewriting code.[2]United States Army, “Hybrid Electric Bradley Demonstrator Advances,” army.mil The result is faster tech insertion and a curb on vendor lock-in. NATO programs now demand VICTORY-compliant data buses, ensuring that a future radar or counter-drone suite can be fielded in months rather than years. Armor, weapons, and power systems are modular, letting commanders tailor protection or firepower to the threat.
Restraints Impact Analysis*
| Restraint | % Impact on CAGR Forecast | Geographic Relevance | Impact Timeline |
|---|---|---|---|
| Post-conflict budget contraction and re-prioritization | -0.7% | Global (particularly Western nations) | Short term (≤ 2 years) |
| High acquisition and life-cycle cost of next-gen platforms | -0.5% | Global (acute in budget-constrained markets) | Medium term (2-4 years) |
| Supply-chain fragility for armor steel and power electronics | -0.4% | Global (China-dependent supply chains) | Medium term (2-4 years) |
| Carbon-footprint scrutiny limiting new diesel procurements | -0.2% | North America and EU (expanding to allied nations) | Long term (≥ 4 years) |
| Source: Mordor Intelligence | |||
Post-Conflict Budget Contraction and Re-Prioritization
Following major operations, treasuries often trim defense outlays to fund domestic programs. Recent US Army helicopter cancellations show how quickly procurement plans can change when lawmakers seek savings. Truck programs become soft targets because militaries can extend service lives through rebuilds, postponing replacement. This creates a near-term dip in orders even though capability gaps persist.
High Acquisition and Life-Cycle Cost of Next-Gen Platforms
Automatic transmissions, hybrid drives, and active protection raise sticker prices above legacy equivalents. The Army’s cost study found that automatic gearboxes cut long-run expenses but force a higher upfront bill that some budget-constrained states cannot justify. Alternative propulsion further requires charging or hydrogen infrastructure, compounding cost. Supply chain volatility for armor steel and microelectronics adds unpredictability, prompting ministries to delay or scale back contracts.
*Our forecasts treat driver/restraint impacts as directional, not additive. The impact forecasts reflect baseline growth, mix effects, and variable interactions.
Segment Analysis
By Application: Command Centers Drive Growth
Command and control shelter trucks remain the fastest-rising category at a 6.02% CAGR, reflecting the imperative for mobile headquarters that can process battlefield data in real time. The military truck market size for these vehicles will widen as each brigade specifies at least one dedicated digital node to host advanced C4ISR software. In contrast, troop transport still held the dominant 39.85% slice of the military truck market share in 2025, because every army needs to move personnel regardless of technological shifts. Logistics, fuel, and water tanker fleets follow a steady replacement curve since they underpin everyday sustainment operations. Field ambulances grow modestly yet command a high price per unit due to integrated ICU modules and ballistic protection. Recovery and fire-fighting variants receive renewed attention where military forces support civilian disaster relief.
Second-order effects cascade across the supply chain. More shelter variants create a pull for high-capacity alternators and climate-control units. Modular body suppliers also see increased demand as armies prefer ISO-compatible containers that slot onto flatbeds. Vendors that already ship open-architecture mission computers have a strategic advantage because they can port software across the expanding fleet with minimal adaptation. For troop carriers, ergonomic seating and blast-attenuating floors differentiate offerings, especially for special operations units. The competitive gap widens for companies that can integrate transport and digital command formats on a common chassis, reducing training and spares complexity.


By Weight Class: Light Vehicles Gain Momentum
Heavy trucks above 10 tons Gross Vehicle Weight (GVW) held 43.10% revenue in 2025, driven by strategic lift roles such as tank transporters and bridging units that cannot be downsized. Yet the light segment below 4 tons GVW is growing quickly at 5.32% CAGR as urban and special operations scenarios dominate planning assumptions. Lightweight 4×4 pickups, many based on commercial designs but militarized with rollover protection and weapon mounts, give commanders an inexpensive platform that can be air-lifted in C-130 or sling-loaded under helicopters. Medium vehicles from 4 to 10 tons GVW remain the backbone because they balance payload and mobility for day-to-day logistics.
The shift to lighter classes reshapes procurement logistics. Fewer heavy low-boys are ordered, freeing funds for agile units inside a tilt-rotor aircraft. Tire and suspension suppliers pivot to run-flat designs optimized for lower weights, while additive spares manufacturing at forward bases becomes viable for simpler drivelines. On the other hand, heavy segment vendors defend their share by adding advanced driver assistance and prognostics that boost uptime, emphasizing that one oversized truck can sometimes replace three light units in rough terrain. Decision-makers, therefore, view fleet composition as a portfolio, blending classes rather than pivoting entirely to one end of the spectrum.
By Propulsion Type: Electrification Accelerates
Diesel retains 61.05% of the 2025 fleet thanks to its global fueling network and proven cold-start reliability. Even so, hybrid-electric powertrains lead growth at 7.31% CAGR as armies experiment with silent approach missions and fuel savings that shrink convoy footprints. Early trials under US Department of Defense climate plans confirm double-digit range gains while auxiliary power units disappear because traction batteries handle sensor loads. Full-battery and hydrogen platforms remain prototypes, yet research budgets rise because governments tie carbon-reduction targets to procurement awards.
Technology transition triggers new vendor dynamics. Engine builders partner with inverter specialists, and battery suppliers court militaries with ruggedized modules that meet shock and electromagnetic hardening standards. Training schools must update curricula since technicians now handle high-voltage systems. Forward operators still worry about charging in austere environments, so hybrid rather than pure-electric becomes the bridge technology of choice. Caterpillar and Cummins have demonstration gen-sets that convert JP-8 into electricity, offering a path to charge plug-in hybrids without civilian grid support.
By End-User: Special Operations Lead Growth
Conventional army formations consumed 59.20% of 2025 revenue because they field the broadest force structures. Special operations commands, however, advance at a 5.18% CAGR since they secure funding priority for precision raids and counter-terror missions that rely on low-profile trucks. SOCOM’s Ground Mobility Vehicle 1.1 fleet, for example, fits inside CH-47 and V-22 aircraft yet carries remote-weapon stations and electronic-warfare pods. Navy-Marine and air-force users follow a flatter replacement curve tied to amphibious capabilities and expeditionary air-base support. At the same time, paramilitary and homeland security agencies buy modest volumes keyed to border patrol and disaster response tasks.
Growth in special operations orders incentivizes suppliers to offer modular turrets, lightweight armor, and quick-detach mission kits. Commercial off-the-shelf passenger vehicles converted for military use win some competitions when budgets stress speed over bespoke design. Nevertheless, purpose-built platforms still dominate where survivability against small arms and mines remains non-negotiable. Industry observers expect more public-private partnerships that pool small series production across allied nations to keep unit costs manageable.
By Drive Configuration: 8×8 Systems Advance
The familiar 6×6 format represented 45.20% of revenue in 2025 because it offers ample payload at an acceptable cost. Yet 8×8 growth at a 6.71% CAGR signals rising payload and crew protection requirements in rough terrain. Newer 8×8 trucks feature independent suspensions, central-tire-inflation, and all-wheel steering that rival tracked vehicles off-road. Armies in Europe, the Middle East, and South America now compete for transporters that can keep pace with wheeled infantry fighting vehicles. Four-by-four designs dominate liaison, command, and special operations niches where curb weight must stay under helicopter limits.
Logistics planners recalculate deck space aboard roll-on, roll-off ships and railcars because 8×8 chassis are longer and taller. Vendors respond with folding ROPS structures and air suspension that drops ride height for strategic sealift. Meanwhile, predictive-maintenance sensors now ship on most configurations, and data analytics reveal that 8×8 drivetrains need fewer unscheduled repairs thanks to reduced axle loading per wheel. This fact feeds a cost-of-ownership argument that offsets the higher acquisition price.
By Transmission: Automation Gains Traction
Manual gearboxes retained 67.30% of the global truck count in 2025, largely because many countries prize simple field-level repairability. Even so, automatic transmissions advance at 7.10% CAGR due to easier driver training and smoother power delivery. Allison Transmission’s militarized 4000-series now appears in both North American and European tenders, reflecting newly accepted trade-offs between initial expense and lifecycle value. Automation dovetails with hybrid drives since torque converters and electronic controls blend seamlessly with electric motors.
As adoption rises, doctrinal debates over driver skill fade. Combat units point out that automatic shifts cut fatigue on long convoys and improve acceleration under fire. Maintenance data show fewer clutch overhauls, and simulators shorten license qualification by weeks. Meanwhile, suppliers integrate health monitoring into transmission control units, sending alerts before failures. Over the next decade the tipping point is expected where fully automatic or automated-manual boxes become default except in ultra-light pickups.
Geography Analysis
The Asia-Pacific region retained leadership with a 33.55% revenue share in 2025, reflecting sustained modernization across China, India, South Korea, and Australia. Recent spending programs, such as Australia’s Land 8116 heavy truck acquisition and India’s field artillery tractor replacement, prioritize domestic production lines, aligning with strategic industrial policies. This deep procurement pipeline ensures capacity utilization for local chassis builders and promotes technology transfer in transmissions, armor, and telematics. Regional growth also benefits from rising amphibious and disaster-response missions tied to climate events, creating supplemental demand for all-terrain logistics trucks.
The Middle East registers the fastest 5.55% CAGR through 2031 on the back of Saudi Arabia’s USD 78 billion allocation that mandates 50% industrial localization by the end of this decade. Off-take agreements underpin new joint ventures between Riyadh and European primes, covering 4×4 utility vehicles, 6×6 tactical cargo trucks, and 8×8 missile carriers. Meanwhile, the United Arab Emirates and Qatar pursue similar offsets to broaden national workforces in advanced welding, powertrain assembly, and software integration. Ongoing regional conflicts continue to stress logistics chains, reinforcing the argument for fresh fleets that can move supplies under threat.
North America remains a mature but sizable buyer driven by fleet recapitalization rather than sheer expansion. The US Army resets its inventory with FMTV A2 and JLTV-based command variants, focusing on cyber-hardened electronics and hybrid prototypes to lower fuel demand. Canada mirrors this approach by contracting 85 enhanced recovery trucks capable of towing modern heavy armor. European demand tracks a similar replacement rhythm, anchored by Germany’s multi-year Rheinmetall framework and the adoption of the Netherlands’ JLTV. South America and Africa record slower procurement, constrained by fiscal ceilings. Yet, Brazil’s army continues incremental purchases of 6×6 Guarani support trucks assembled domestically, while select African states rely on foreign military financing for light utility vehicles.

Competitive Landscape
The military truck market is moderately concentrated. Oshkosh Corporation sits at the forefront with an end-to-end range covering light, medium, and heavy classes, plus ongoing FMTV A2 and heavy tactical vehicle contracts worth over USD 1.7 billion combined. Rheinmetall follows closely in Europe, capitalizing on its HX3 family that secured a EUR 330 million (USD 383.5 million) order for 568 Bundeswehr logistics trucks in 2025. BAE Systems leverages combat-vehicle experience to develop hybrid electric demonstrators under a USD 32.2 million US Army program, positioning itself for future production awards.
Competitive intensity now hinges on technology rather than price alone. Vendors differentiate through open-architecture electronics, autonomous convoy aids, and predictive maintenance software. Rheinmetall’s HX3 Common Tactical Truck prototype integrates drive-by-wire steering and remote-operated gun mounts to align with emerging US Army standards. Oshkosh answers with advanced intelligent suspension and anti-lock braking tuned for off-road braking on 55° slopes. Meanwhile, niche suppliers such as MATBOCK and Polaris Defense carve space in the light tactical sub-segment, offering hybrid kits and fuel cell auxiliaries that extend silent range.[5]Fuelcellsworks, “Polaris and SFC Energy Partner on Fuel-Cell Defense Vehicles,” fuelcellsworks.com
Partnership ecosystems expand under localization mandates. European primes enter equity ventures in the Middle East and Asia to satisfy offset quotas, transferring chassis weld lines while retaining engine and electronics supply. US companies pursue similar models through licensed assembly plants in Poland and Kuwait. As modular standards mature, subsystem specialists, including gearbox, sensor, and armor vendors, can sell across multiple prime contractors, gradually eroding traditional platform lock-in. Over the next five years, competitive edges will likely depend on the depth of digital twin data and the ability to deliver incremental software upgrades without pulling the vehicle from service.
Military Truck Industry Leaders
Rheinmetall AG
Oshkosh Corporation
Iveco Group
Dongfeng Motor Group
BAE Systems plc
- *Disclaimer: Major Players sorted in no particular order

Recent Industry Developments
- June 2025: Oshkosh Defense secured a three-year FMTV A2 extension to supply medium tactical vehicles to the US Army and allied buyers through 2028.
- May 2025: SFC Energy and Polaris Government and Defense partnered to integrate EMILY 3000 fuel-cell systems into special operations vehicles for NATO forces.
- February 2025: Oshkosh Defense received a USD 214.8 million order for 240 FMTV trucks supporting US Army and Air Force modernization.
- January 2025: Rheinmetall landed a EUR 330 million (USD 383.5 million) contract for 568 logistics trucks for the German Bundeswehr, including swap-body systems.


Research Methodology Framework and Report Scope
Market Definitions and Key Coverage
Our study defines the military truck market as newly built, tactical wheeled vehicles that meet defense procurement standards, span light-duty 4×4s to heavy 8×8 logistics carriers above 10 tons gross weight, and support cargo, troop, fuel, medical, recovery, and command missions across land-based formations of the Army, Navy, Air Force, and homeland security forces worldwide.
Scope note: tracked combat vehicles, civilian pickups, armored cars, and unmanned ground robots fall outside this scope.
Segmentation Overview
- By Application
- Cargo Logistics
- Troop Transport
- Fuel and Water Tanker
- Command and Control Shelter
- Field Ambulance
- Recovery/Fire-fighting
- Special-purpose (Mine-clearing, Bridging, NBC)
- By Weight Class
- Light (Less than 4 tons GVW)
- Medium (4 to 10 tons GVW)
- Heavy (Greater than 10 tons GVW)
- By Propulsion Type
- Diesel
- Hybrid-Electric
- Full-Electric
- Hydrogen Fuel-cell
- By End-user
- Army
- Navy/Marine Corps
- Air Force
- Special Operations Forces
- Paramilitary and Homeland Security
- By Drive Configuration
- 4×4
- 6×6
- 8×8 and Above
- By Transmission
- Manual
- Automatic
- By Geography
- North America
- United States
- Canada
- Mexico
- South America
- Brazil
- Rest of South America
- Europe
- United Kingdom
- Germany
- France
- Rest of Europe
- Asia-Pacific
- China
- India
- Japan
- South Korea
- Rest of Asia-Pacific
- Middle East and Africa
- Middle East
- Saudi Arabia
- Israel
- Rest of Middle East
- Africa
- South Africa
- Rest of Africa
- Middle East
- North America
Detailed Research Methodology and Data Validation
Primary Research
Our team interviewed logistics planners, former acquisition officers, program managers at vehicle makers, and regional fleet maintainers across North America, Europe, Asia-Pacific, and the Middle East. Their inputs clarified replacement cycles, electrification pilots, and discount structures, allowing us to fine-tune cost assumptions and validate secondary findings.
Desk Research
We gathered foundational data from open sources such as SIPRI military-expenditure tables, NATO budget releases, UN Comtrade customs codes for heavy vehicles, and defense procurement bulletins, complemented by company filings, press releases, and patent libraries on Questel. News streams on Dow Jones Factiva and tender notices from Tenders Info enriched delivery counts and price curves. These references framed historical demand and helped us track average selling prices. The list is illustrative; many additional sources informed cross-checks throughout the build.
Market-Sizing & Forecasting
Totals were first derived through a top-down reconstruction of land-mobility capital outlays, allocating shares to tactical trucks by service branch and weight class before converting budgets to unit volumes with average acquisition costs. Select bottom-up supplier roll-ups and channel checks validated and adjusted those figures. Key variables include national defense capital spend, active troop strength, planned replacement batches, drivetrain mix, inflation-indexed unit prices, and scrappage rates. Forecasts combine multivariate regression with ARIMA smoothing, while scenario analysis stress-tests budget swings. Regional gaps in supplier data were bridged with weighted averages vetted in primary calls.
Data Validation & Update Cycle
Outputs pass automated variance checks, peer review, and senior sign-off. Reports refresh annually, and interim updates trigger after major contract awards, conflict escalations, or macro shocks, so clients always receive the most current view.
Why Mordor's Military Truck Baseline Earns Unmatched Trust
Published estimates often diverge because publishers choose different platform boundaries, currency bases, and update cadences. According to Mordor Intelligence, our disciplined scope, consistent budget mapping, and annual refresh cycle limit drift and keep figures transparent.
Key gap drivers include wider inclusion of armored fighting vehicles by some studies, optimistic electrification uptake assumptions, or older exchange rates.
Benchmark comparison
| Market Size | Anonymized source | Primary gap driver |
|---|---|---|
| USD 25.08 Bn (2025) | Mordor Intelligence | |
| USD 24.65 Bn (2024) | Global Consultancy A | Includes light combat vehicles; uses 2022 exchange rates |
| USD 20.15 Bn (2024) | Regional Consultancy B | Excludes paramilitary demand; applies aggressive unit-price discounts |
These contrasts show that Mordor's careful variable selection and regular updates deliver a balanced, reproducible baseline that decision-makers can trust.


Key Questions Answered in the Report
What is the current value of the military truck market?
The military truck market is valued at USD 25.88 billion in 2026, with a projected CAGR of 3.21% through 2031.
Which application segment is expanding fastest?
Command and control shelter vehicles are growing at a 6.02% CAGR because militaries need dedicated digital command platforms on mobile chassis.
Why are hybrid-electric trucks gaining momentum?
Hybrid drivetrains cut battlefield fuel use by about 20%, reduce acoustic signatures, and generate silent onboard power, making them attractive despite higher upfront costs.
Which region shows the highest growth?
The Middle East leads regional growth at a 5.55% CAGR, supported by Saudi Arabia’s increased defense budget and localization initiatives.
Who are the top competitors in the market?
Oshkosh Corporation, Rheinmetall AG, and BAE Systems plc hold a combined 38% share of recent contract awards, differentiating through hybrid propulsion and modular designs.
How are localization policies influencing procurement?
Offset mandates in regions such as the Middle East drive joint ventures and in-country assembly, giving an edge to manufacturers willing to transfer technology and skills.
Page last updated on:


