Military Transport Aircraft Market Size and Share
Market Overview
| Study Period | 2020 - 2031 |
|---|---|
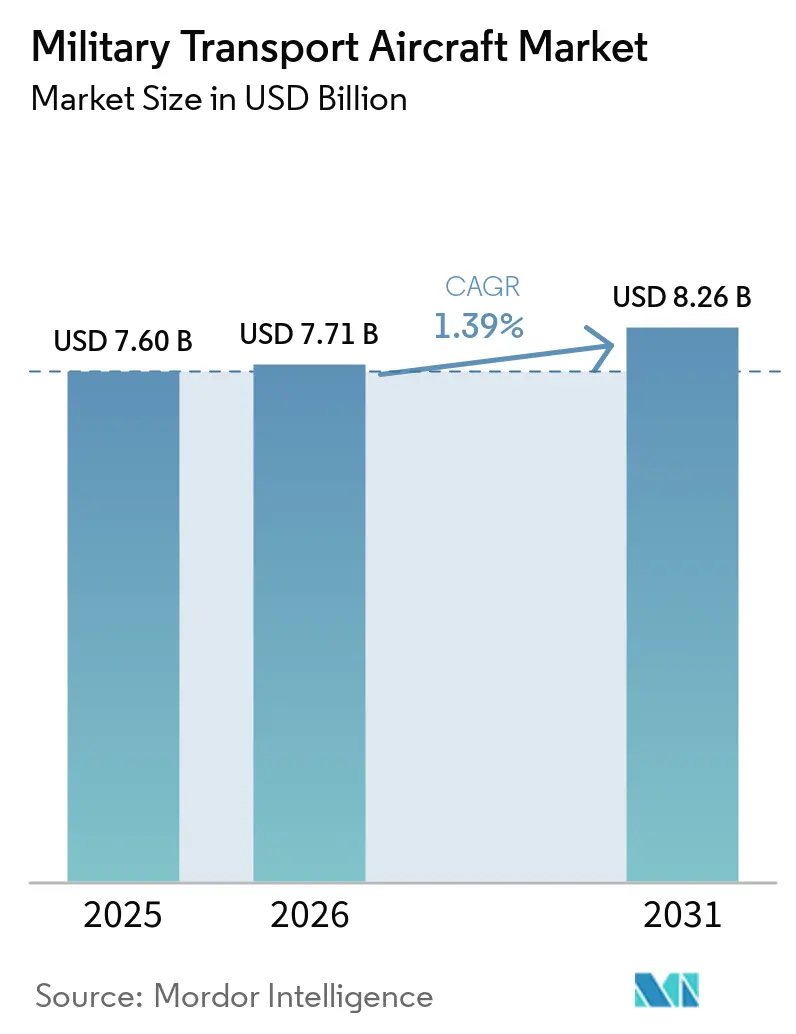
| Market Size (2026) | USD 7.71 Billion |
| Market Size (2031) | USD 8.26 Billion |
| Growth Rate (2026 - 2031) | 1.39% CAGR |
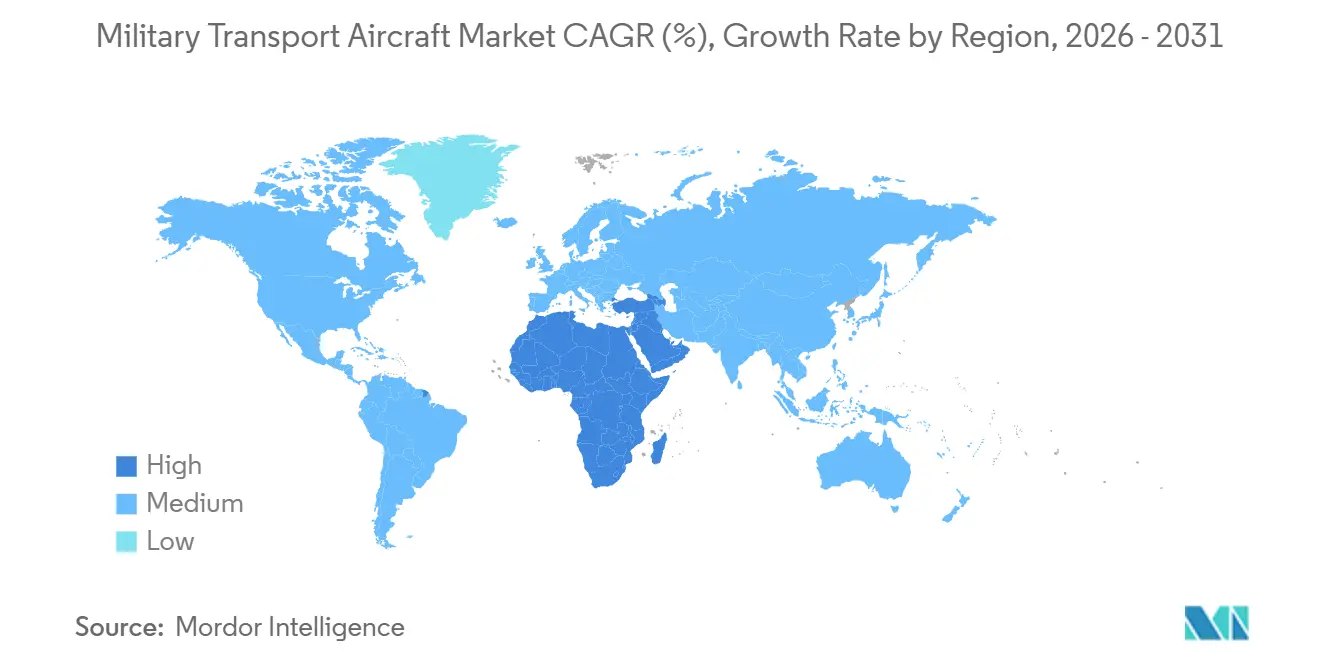
| Fastest Growing Market | Middle East and Africa |
| Largest Market | Asia Pacific |
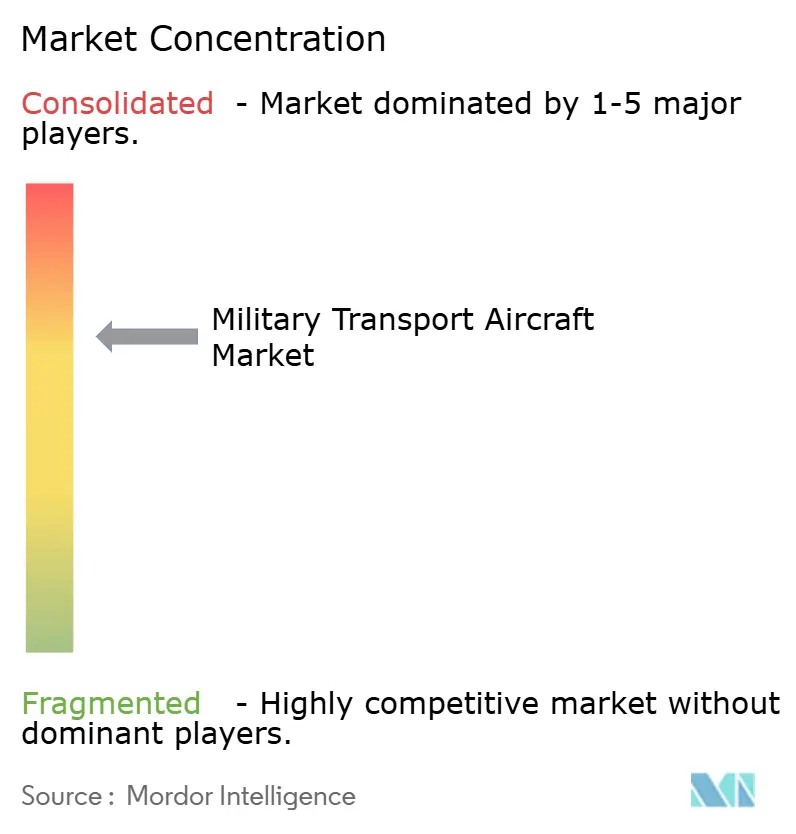
| Market Concentration | Medium |
Major Players *Disclaimer: Major Players sorted in no particular order Image © Mordor Intelligence. Reuse requires attribution under CC BY 4.0. | |
Military Transport Aircraft Market Analysis by Mordor Intelligence
The military transport aircraft market size was valued at USD 7.60 billion in 2025 and estimated to grow from USD 7.71 billion in 2026 to reach USD 8.26 billion by 2031, at a CAGR of 1.39% over 2026-2031. Operators are pivoting capital from new-build procurement to sustainment, fleet-life extensions, and performance-based MRO frameworks to support dispersed operations and higher aircraft availability targets. The operating model tilt is visible in strategic modernization contracts that extend the life of existing fleets while addressing avionics obsolescence and cyber-hardened mission systems. Regional demand signals align with policy-led industrialization, where final assembly lines and indigenous MRO hubs are favored to reduce lifecycle dependencies and compress delivery timelines, as seen in India’s large C-295 program footprint. Humanitarian and disaster-response requirements continue to rise within defense mandates, strengthening the case for dual-use-certified airlifters that can shift from combat support to civil relief on short notice.
Key Report Takeaways
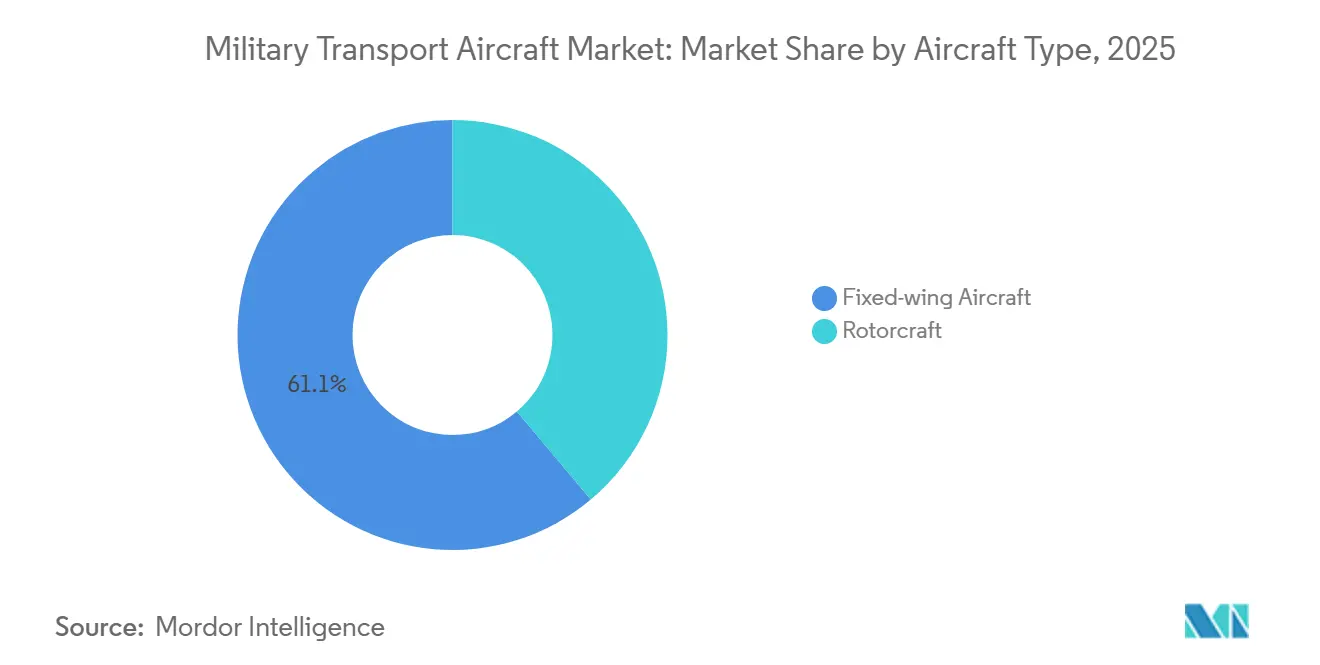
- By aircraft type, fixed-wing platforms led the military transport aircraft market with 61.12% market share in 2025; rotorcraft are forecast to advance at a 4.20% CAGR through 2031.
- By application, troop and cargo airlifting led the military transport aircraft market with a 44.85% revenue share in 2025; humanitarian and disaster relief is projected to expand at a 5.45% CAGR through 2031.
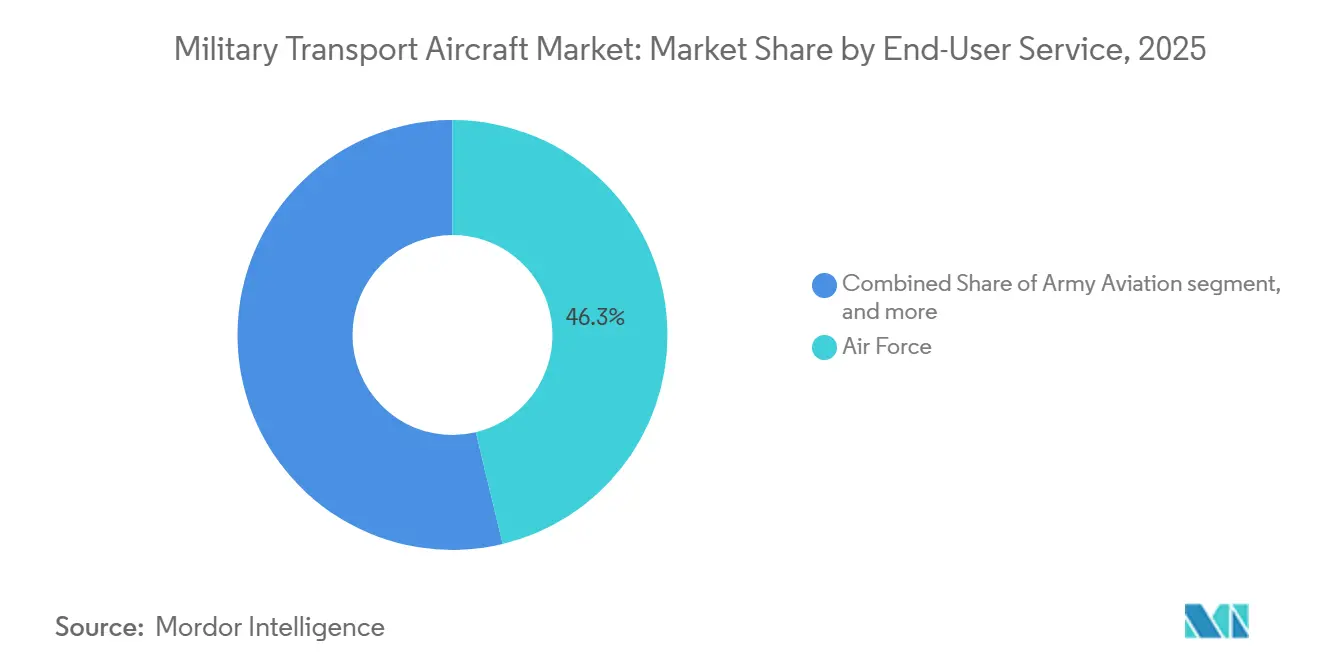
- By end-user service, the Air Force segment accounted for 46.25% of the military transport aircraft market in 2025, while the paramilitary and coast guard segments are projected to expand at a 3.86% CAGR through 2031.
- By propulsion, turbofan-powered models accounted for 52.05% of the military transport aircraft market in 2025; turboshaft-equipped airframes are expected to post a 5.15% CAGR between 2026 and 2031.
- By geography, the Asia-Pacific region commanded 39.05% of the military transport aircraft market share in 2025. In contrast, the Middle East and Africa are anticipated to register the fastest growth, with a 3.60% CAGR through 2031.
Note: Market size and forecast figures in this report are generated using Mordor Intelligence’s proprietary estimation framework, updated with the latest available data and insights as of 2026.
Global Military Transport Aircraft Market Trends and Insights
Driver Impact Analysis*
| Driver | (~) % Impact on CAGR Forecast | Geographic Relevance | Impact Timeline |
|---|---|---|---|
| Escalating defense budgets in Asia-Pacific and the Middle East | +0.5% | Asia-Pacific (China, India, Japan), Middle East (Saudi Arabia, UAE, Qatar) | Medium term (2-4 years) |
| Fleet-modernization programs replacing aging C-130/L-100 and An-26 classes | +0.4% | Global, with concentration in North America, Europe, Asia-Pacific | Long term (≥ 4 years) |
| Geopolitical flashpoints spurring urgent lift capability | +0.3% | Europe (NATO Eastern flank), Indo-Pacific (Japan, South Korea, Australia), Middle East | Short term (≤ 2 years) |
| Expansion of humanitarian and disaster-relief missions requiring dual-role airlifters | +0.2% | Global, particularly Southeast Asia, Africa, Caribbean, and Pacific Island nations | Medium term (2-4 years) |
| Digital-thread MRO reducing downtime and enlarging aftermarket revenue pools | +0.2% | North America, Europe, advanced Asia-Pacific (Japan, South Korea, Australia) | Medium term (2-4 years) |
| Emerging eVTOL logistics aircraft for agile last-mile resupply | +0.1% | North America (US military trials), Europe, initial Asia-Pacific adopters | Long term (≥ 4 years) |
| Source: Mordor Intelligence | |||
Escalating Defense Budgets in Asia-Pacific and the Middle East
Rising allocations across priority theaters are fueling procurement of multi-mission airlifters as well as localized assembly, training, and in-country sustainment. India’s C-295 program exemplifies this policy shift, combining platform acquisition with local manufacturing and lifecycle support to advance self-reliance and availability objectives. In Europe, aggregate defense spending accelerated in 2025, strengthening air-mobility renewal agendas and pooled logistics arrangements that improve response times and interoperability. Budget momentum in the Gulf is translating into offset-heavy frameworks that prioritize sovereign MRO capacity and joint ventures to reduce long-term external dependencies on original equipment manufacturers. Procurement teams increasingly seek platforms that blend combat readiness with civil certification pathways, which ease overflight approvals during humanitarian operations and cross-border missions. Export-control guardrails remain a design factor in these budgets, with ITAR and allied regimes shaping the addressable market for US-origin systems and creating openings for alternative suppliers that meet the same mission envelope under different licensing constraints.
Fleet-modernization Programs Replacing Aging C-130/L-100 and AN-26 Classes
Modernization has moved from episodic upgrades to structured, multi-year programs that anchor airworthiness, avionics refresh, and cyber survivability over longer horizons. The United States awarded a flight-deck modernization effort for its heavy-lifter fleet that uses a modular open systems approach to address obsolescence and to extend useful life, a signal that operators favor incremental capability accrual on proven airframes.[1]Boeing Media Relations, “Boeing Flight Deck Modernization Keeps C-17A Mission Ready,” Boeing Press Release, boeing.mediaroom.com In parallel, platform families at the tactical end of the spectrum continue to attract new orders as legacy transports age out of service and interoperability becomes a premium requirement for multinational missions. European programs are consolidating around fewer types to capture scale in training, spares, and mission system integration, even as specific programs manage cost adjustments within larger order backlogs. Operators are tying vendor compensation to availability and mission-capable rates, aligning sustainment incentives with sortie generation and reducing downtime risk throughout the aircraft's life. These programs increasingly mandate standardized digital baselines, making it easier to integrate diagnostics, predictive maintenance, and rapid configuration changes across fleets that switch between airlift, medevac, and tanker roles.
Geopolitical Flashpoints Spurring Urgent Lift Capability
High-intensity and gray-zone events have pushed mobility commands to deliver lift on compressed notice and from varied basing modes. Allied operations in Europe illustrate the need to execute large-scale supply and relief missions across multiple corridors while maintaining deconflicted civil and military traffic under tight schedules. In the Middle East, humanitarian airdrops under active contingency demonstrate the premium on aircraft that can be configured and deployed quickly, with crews trained to operate in mixed civil-military airspace.[2]U.S. Central Command Public Affairs, “U.S. Central Command Conducts 13th Humanitarian Airdrop into Gaza,” U.S. Central Command, centcom.mil Indo-Pacific concepts of operation place greater value on platforms that can operate from dispersed airfields and austere strips within contested zones, elevating short-field performance and defensive avionics as key differentiators. The same flashpoints are accelerating interoperability investments so units can plug into coalition logistics, command networks, and medical evacuation protocols without extensive reconfiguration. Training, spares pre-positioning, and allied certification are therefore moving up the priority list for procurement offices that need capability on day one.
Expansion of Humanitarian and Disaster-relief Missions Requiring Dual-role Airlifters
Climate-driven events and complex emergencies are increasing the share of missions that require rapid evacuations, medical support, and the delivery of relief supplies over long distances. Government operations in North America have deployed transport fleets at scale for wildfire response and severe-weather evacuations, confirming the operational value of dual-use platforms for domestic missions.[3]U.S. Central Command Public Affairs, “U.S. Central Command Conducts 13th Humanitarian Airdrop into Gaza,” U.S. Central Command, centcom.mil Allied frameworks have also prioritized civil protection and disaster relief within their operations portfolios, expanding the mission set for tactical and strategic airlifters under combined tasking. This mission shift reinforces demand for aircraft with civil airworthiness, easing insurance, overflight, and access to mixed-use airports during relief operations. Procurement specifications now more often include medevac kits, roll-on/roll-off mission systems, and cargo-floor reinforcements that support rapid reconfiguration among people, vehicles, and pallets. The net effect is a larger base of flying hours tied to non-combat tasks and a stronger business case for performance-based sustainment to keep availability high during peak disaster seasons.
Restraint Impact Analysis*
| Restraint | (~) % Impact on CAGR Forecast | Geographic Relevance | Impact Timeline |
|---|---|---|---|
| Supply-chain constraints for widebody composite structures and aero-engines | -0.4% | Global, acute in North America and Europe due to supplier concentration | Medium term (2-4 years) |
| High total-ownership cost versus potential leased cargo conversions | -0.3% | Emerging markets in Southeast Asia, Africa, South America | Short term (≤ 2 years) |
| Export-control and ITAR barriers limiting platform addressable markets | -0.3% | US platforms (C-17, C-130J), NATO allies subject to EU Common Position | Long term (≥ 4 years) |
| Runway-availability risk in dispersed operations limiting heavy-lift utility | -0.2% | Asia-Pacific (island chains), Africa (infrastructure gaps), Arctic | Medium term (2-4 years) |
| Source: Mordor Intelligence | |||
Supply-chain Constraints for Widebody Composite Structures and Aero-engines
The composite raw material and prepreg markets are concentrated among a small set of suppliers, heightening schedule risk when one producer faces a disruption or a capacity reallocation. Large turboprop and turbofan programs with sole-source components can experience maintenance events that ripple across fleets, temporarily reducing availability, creating budget pressure, and requiring delivery rescheduling. The scale and cost of autoclaves, specialized bonding processes, and certified repair facilities limit the number of sites that can produce or repair critical structures at the pace operators demand. When fleets expand in regions with nascent industrial bases, logistics pipelines for composite parts can introduce additional lead time and inventory carrying costs. OEMs that deploy digital-twin tools and predictive analytics can temper these delays, but the underlying capacity constraint still caps throughput during surge orders. The net effect is a structural bottleneck that procurement teams factor into delivery schedules and that sustainment teams hedge with spares pooling and long-lead procurement.
High Total-ownership Cost Versus Potential Leased Cargo Conversions
Tighter export-control rules can narrow the range of eligible customers or extend approval timelines, which directly affects booking cycles and revenue recognition for platforms with restricted subsystems. Allied reforms have streamlined some defense trade within trusted blocs, yet carve-outs for sensitive technologies still cover avionics and mission systems used on transport aircraft. These restrictions affect not only headline sales but also upgrades, software loads, and specific payload configurations, complicating multinational interoperability. In response, some vendors develop parallel, civil-certified variants or mixed-content configurations to expand exportability without undermining core capability. Local-content mandates and offset frameworks further shape the feasible deal structure by prioritizing assembly, MRO, and in-country training capacity, as demonstrated by India’s program architecture for C-295 assembly and support. Over the long term, export controls and local-content rules together act as a filter on platform design choices and commercial strategies, pushing suppliers to plan for multiple certification pathways and modular system architectures.
*Our forecasts treat driver/restraint impacts as directional, not additive. The impact forecasts reflect baseline growth, mix effects, and variable interactions.
Segment Analysis
By Aircraft Type: Fixed-wing Dominance Drives Market Leadership
Fixed-wing transport aircraft accounted for 61.12% of the market in 2025, reflecting sustained demand for intertheater lift, long-range deployment, and tanker-enabled mobility that rotorcraft cannot match on payload or range. The military transport aircraft market is set to keep fixed-wing fleets at the center of strategic operations where speed, volume, and reach drive mission planning and allied interoperability. Tactical airlift now blends with tanker and medevac roles on common airframes, which reinforces investment in avionics, cybersecurity, and communications upgrades rather than wholesale type replacement. At the same time, multi-role tactical platforms continue to win orders in Europe and beyond, as seen in new C-295 commitments that replenish aging light and medium fleets while adding maritime patrol and surveillance variants to shared logistics pools. The military transport aircraft industry is consequently moving toward fewer core types with broader mission kits, which lowers training and sustainment costs across joint and coalition operations. In basing environments where runway conditions vary, fixed-wing operators are leaning on short-field and austere-runway performance to keep options open for forward-deployed missions.
Rotorcraft retain the remaining 38.88% and are projected to grow faster at a 4.20% CAGR through 2031 as dispersed operations and Agile Combat Employment reward vertical-lift agility for tactical resupply and personnel movement inside contested airspace. Rotary fleets excel at ship-to-shore connectors, remote-site insertions, and rapid backhaul under runway denial, and this use case mix supports persistent investment in heavy-lift and medium utility lines. On missions below 300 nautical miles and in complex terrain, rotorcraft offer a cost and time advantage over short-hop fixed-wing sorties, especially when ground handling, runway preparation, and threat exposure are factored into total cycle time. Procurement choices reflect payload and survivability trade-offs, with new engines and digital avionics improving lift, fuel burn, and self-protection. As more joint task forces rehearse distributed operations, planners are rebalancing fleets to ensure enough vertical-lift capacity exists to keep dispersed detachments supplied. This structural tilt complements rather than displaces fixed-wing dominance, which continues to carry the heaviest equipment and bulk cargo for theater-level movement.


By Application: Troop and Cargo Airlifting Dominance Challenged by Humanitarian Growth
Troop and cargo airlifting accounted for 44.85% of revenue in 2025 as allied operations maintained high demand for deployment, rotation, and materiel distribution across active theaters and forward presence locations. The military transport aircraft market continues to prioritize rapid embarkation, palletized cargo handling, and joint interoperability to sustain tempo across long supply lines and mixed basing networks. These missions shape avionics and communications upgrades that improve airspace deconfliction, coalition command integration, and ground-speed coordination at congested hubs. Growing interest in modular cargo systems and roll-on/roll-off kits is streamlining reconfiguration time between troop movements, cargo flights, and medical evacuations. Airlift requirements are also driving greater tanker-enabled flexibility to stretch range, increase payload, and enable multi-leg delivery patterns without reliable en route infrastructure. With aircrew hours closely managed to preserve readiness, investment in training devices, mission rehearsal tools, and digital flight-deck modernization is tied directly to throughput gains.
Humanitarian and disaster relief is the fastest-growing application, projected at a 5.45% CAGR through 2031. The military transport aircraft market is adapting to more frequent requests for evacuation, medical support, and emergency airland or airdrop of essential supplies, which favors dual-use-certified platforms and civil-derivative variants. Operations in North America illustrate how defense assets shift to domestic relief roles at peak demand while maintaining readiness for allied missions abroad. NATO’s civil protection activities further validate multi-role configurations that move seamlessly between defense and humanitarian tasking under unified command arrangements. Certification requirements are converging on equipment that supports medical modules, night-vision operations, and performance on short or damaged runways. As a result, growth in relief missions is shaping the design and procurement of transports that must satisfy both military standards and civil airworthiness frameworks.
By End-User Service: Air Force Share Challenged by Paramilitary Expansion
The Air Force segment accounted for 46.25% of the military transport aircraft market in 2025, driven by strategic-range requirements, aerial refueling integration, and global command-and-control (C2) connectivity. This segment continues to drive the largest block upgrades for avionics, cybersecurity, and communications, ensuring compatibility with coalition networks and mission planning systems across theaters. The military transport aircraft industry is also seeing joint-service standardization in training and sustainment to improve availability while tempering operating costs. Navy and Marine aviation units use transports during amphibious operations and logistics ashore to avoid reliance on major ports. Army aviation commands focus on theater logistics and tactical movement of personnel and supplies in complex terrain. These roles, together, underscore the need for a balanced mix of fixed-wing and rotary-wing aircraft to provide both strategic lift and last-mile resupply.
Paramilitary and coast guard segments are projected to grow at a 3.86% CAGR through 2031, as border-control, maritime security, and interdiction missions demand a versatile airlift that can switch rapidly between search-and-rescue and medevac missions. These agencies often procure lighter transports that share civil certification baselines to simplify overflight and access to mixed-use airports during multi-agency operations. Acquisition cycles can be shorter than those of traditional defense programs, underscoring the importance of aligned certification and training pipelines. The expanding scope of maritime patrol and coastal enforcement expands the addressable fleet of light transports capable of carrying personnel, sensors, and relief cargo. Where budgets are tighter, agencies extend life through targeted avionics refreshes and interior refits while leveraging pooled MRO capacity with defense operators. This steady expansion complements Air Force-led strategic mobility, ensuring adequate coverage for domestic missions and transnational cooperation.
By Propulsion Type: Turbofan Stability Contrasts Turboshaft Acceleration
Turbofan-powered platforms accounted for 52.05% of the military transport aircraft market share in 2025, a position supported by intertheater mobility, tanker-enabled range, and higher cruise speeds that compress deployment timelines. Strategic fleets remain the backbone of rapid global response, and modernization budgets prioritize cockpit upgrades, cybersecurity hardening, and communications modernization that extend life and expand mission interoperability. Turboprop transports retain advantages in fuel economy and high-altitude performance, which keeps them relevant on shorter runways and in mountainous terrain. The military transport aircraft industry is converging on mixed propulsion portfolios tailored to mission radius, payload class, and basing conditions.
Turboshaft-equipped airframes are forecast to post the highest growth at a 5.15% CAGR through 2031, reflecting the growing importance of vertical-lift in dispersed operations and runway-denied environments. Heavy-lift rotorcraft provide outsized payload movement where runways are limited or contested, while medium utility helicopters enable frequent point-to-point resupply inside complex terrain and urban settings. Digital avionics, improved engines, and survivability suites are increasing mission effectiveness and reducing fuel burn, thereby enhancing both tactical value and cost control. Short-field performance and austere-site capability remain top selection criteria, with mission kits expanding to include medevac, firefighting, and cargo hooks for multi-role flexibility. Training investments and simulator proliferation are improving crew proficiency and safety margins during night or adverse-weather conditions. As allied doctrines emphasize agility, turboshaft growth is anchored to the need for persistent lift inside contested zones.
Geography Analysis
Asia-Pacific accounted for 39.05% of the military transport aircraft market in 2025, supported by new-platform procurement linked to domestic assembly and sustainment ecosystems. India’s program to assemble and support a large fleet of light- to medium-sized transports has reinforced the case for in-country capability that reduces lifecycle risk and accelerates fleet readiness. Regional planners are standardizing across fewer platform types to capture scale in training, spares, and mission systems. Mission profiles in the region often require a balance between intertheater reach and short-field performance for archipelagic and mountainous geographies. Civil certification pathways are also relevant for disaster response missions and for access to mixed-use airports during regional crises. As industrial bases mature, Asia-Pacific customers are integrating local MRO and component manufacturing to improve availability and sovereign control of critical upgrades.
North America sustains a large installed base and continues to fund modernization that extends fleet life and raises mission-capable rates across strategic and tactical platforms. Modernization contracts for heavy lifters are solving avionics obsolescence while enabling modular upgrades that can be fielded with less downtime than legacy approaches. Domestic operations have kept transports active in humanitarian roles, including wildfire and severe-weather response, which place a premium on rapid configuration and high dispatch reliability. Joint exercises and coalition operations continue to refine interoperability with NATO partners, strengthening shared logistics and command networks. Procurement decisions in the region reflect a preference for performance-based logistics and digital sustainment, which align incentives with uptime and lifecycle cost control. The regulatory environment includes stringent export controls that shape third-party resale and foreign participation in upgrades, thereby affecting allied fleet planning timelines.
Europe is sustaining elevated defense outlays and narrowing platform diversity to harvest efficiency in training, MRO, and mission-system integration. New orders for light- to medium-sized transports in late 2025 point to steady modernization of legacy fleets and the expansion of multi-mission roles that include maritime patrol and surveillance. The Middle East and Africa are expected to deliver the fastest growth at a 3.60% CAGR through 2031, as offset-heavy procurement frameworks prioritize local assembly and MRO, thereby supporting sovereign control over sustainment and customization. Allied operations and relief missions across the broader region continue to validate the need for reliable lift, short-field performance, and dual-use certification. Industrial policy and export-control regimes guide platform choices and contract structures, which shape timelines for fielding and upgrades. As interoperability with transatlantic partners increases, European and Middle Eastern operators are investing in compatible communications, navigation, and identification systems to reduce mission friction and speed deployment.

Competitive Landscape
Market competition centers on lifecycle economics, availability guarantees, and the breadth of mission kits that can be fielded quickly without complex retrofit. A leading US prime reported a sharp year-on-year decline in new-unit deliveries for its flagship tactical transport in 2025. It absorbed unfavorable adjustments tied to sustainment commitments, consistent with the industry-wide shift from unit-driven to availability-driven revenue. Another global OEM secured a major flight-deck modernization award to update avionics to a modular open systems architecture, mitigating obsolescence risk and extending service life into the out-years. European suppliers sustained new transport orders and reported solid intake, while also recognizing program-level adjustments to align costs, schedules, and capabilities across large multinational fleets.
Programs that couple civil certification with military mission kits are gaining attention for their export agility and insurance, as well as overflight and access advantages during relief operations. Regional procurement wins for light- to medium-duty transports in 2025 underscore a value proposition built around austere-field performance, modular payloads, and proven logistics support. Sustained humanitarian operations in allied frameworks have reinforced dual-use requirements, pushing vendors to pre-certify for both civil and military standards to reduce integration lead times. On the supply side, composite material concentration remains a structural risk that OEMs hedge through long-term agreements, dual qualification, and digital quality control in manufacturing and repair. Vendors that instrument fleets with predictive analytics are improving time-on-wing and reducing unscheduled events, which makes performance-based logistics more viable over multi-year horizons.
Industrial policy is a competitive dimension in its own right, with buyers favoring bids that include local assembly, sovereign MRO, and workforce development. India’s large transport assembly and sustainment footprint signals a preference for structured offsets that raise local capability and shorten turnaround times for mission kits and depot-level work. Export-control rules also shape competition, both by defining the customer set that can access specific subsystems and by extending approval timelines, which can steer some buyers to platforms with fewer licensing dependencies. Across leading programs, modernization awards show that primes and Tier-1 suppliers are prioritizing open architectures and scalable digital backbones that enable faster, less disruptive upgrades. The combined effect is a competitive field defined as much by lifecycle and regulatory execution as by baseline aircraft performance.
Military Transport Aircraft Industry Leaders
Airbus SE
Lockheed Martin Corporation
The Boeing Company
Leonardo S.p.A.
Embraer S.A.
- *Disclaimer: Major Players sorted in no particular order

Recent Industry Developments
- March 2026: The Indian Ministry of Defence (MoD) announced a USD 10.9 billion investment to modernize its tactical airlift fleet by acquiring 60 transport aircraft for the Indian Air Force. According to the current plan, 12 aircraft will be delivered ready to fly. The remaining 48 aircraft will be assembled in collaboration with domestic partners in India, using a majority of indigenous components.
- October 2025: Embraer, the Brazilian aerospace company, inaugurated its office in India. To mark the occasion, the company signed a strategic cooperation agreement with the Mahindra Group to enhance the C-390 Millennium military transport aircraft for the Indian Air Force.
- September 2025: Portugal signed a contract with Embraer, acquiring a sixth KC-390 Millennium transport aircraft and establishing 10 new purchase options for allied nations. The Portuguese Air Force, which introduced the KC-390 in 2023, is the first operator globally to expand its initial order.
- September 2025: Sweden agreed to procure four C-390 Millennium military transport aircraft from Embraer. These aircraft will replace the Swedish Hercules planes, which have been in service for over 60 years. The first delivery is scheduled for 2027.


Global Military Transport Aircraft Market Report Scope
The military transport aircraft market encompasses the design, development, manufacturing, procurement, modernization, and lifecycle support of military aircraft designed for transporting troops, equipment, vehicles, supplies, and specialized mission payloads. This market includes both fixed-wing airlifters and rotary-wing transport platforms.
The military transport aircraft market is segmented by aircraft type, application, end-user service, propulsion type, and geography. By aircraft type, the market is segmented into fixed-wing aircraft and rotorcraft. By application, the market is segmented into troop and cargo airlifting, humanitarian and disaster relief, and special missions. By end-user service, the market is segmented into Air Force, Army Aviation, Naval/Marine Corps Aviation, Joint/Special Operations, and Paramilitary and Coast Guard operators. By propulsion type, the market is segmented into turboprop, turboshaft, and turbofan-powered aircraft. The report also covers the market sizes and forecasts for the military transport aircraft market in major countries across different regions. For each segment, the market size is provided in terms of value (USD).
| Fixed-wing Aircraft |
| Rotorcraft |
| Troop and Cargo Airlifting |
| Humanitarian and Disaster Relief |
| Special Missions (MEDEVAC, SAR, VIP) |
| Air Force |
| Army Aviation |
| Naval/Marine Corps Aviation |
| Joint/Special Operations |
| Paramilitary and Coast Guard |
| Turboprop |
| Turboshaft |
| Turbofan |
| North America | United States | |
| Canada | ||
| Mexico | ||
| Europe | United Kingdom | |
| France | ||
| Germany | ||
| Spain | ||
| Italy | ||
| Russia | ||
| Rest of Europe | ||
| Asia-Pacific | China | |
| India | ||
| Japan | ||
| South Korea | ||
| Australia | ||
| Indonesia | ||
| Rest of Asia-Pacific | ||
| South America | Brazil | |
| Rest of South America | ||
| Middle East and Africa | Middle East | Saudi Arabia |
| United Arab Emirates | ||
| Qatar | ||
| Rest of Middle East | ||
| Africa | South Africa | |
| Nigeria | ||
| Rest of Africa | ||
| By Aircraft Type | Fixed-wing Aircraft | ||
| Rotorcraft | |||
| By Application | Troop and Cargo Airlifting | ||
| Humanitarian and Disaster Relief | |||
| Special Missions (MEDEVAC, SAR, VIP) | |||
| By End-User Service | Air Force | ||
| Army Aviation | |||
| Naval/Marine Corps Aviation | |||
| Joint/Special Operations | |||
| Paramilitary and Coast Guard | |||
| By Propulsion Type | Turboprop | ||
| Turboshaft | |||
| Turbofan | |||
| By Geography | North America | United States | |
| Canada | |||
| Mexico | |||
| Europe | United Kingdom | ||
| France | |||
| Germany | |||
| Spain | |||
| Italy | |||
| Russia | |||
| Rest of Europe | |||
| Asia-Pacific | China | ||
| India | |||
| Japan | |||
| South Korea | |||
| Australia | |||
| Indonesia | |||
| Rest of Asia-Pacific | |||
| South America | Brazil | ||
| Rest of South America | |||
| Middle East and Africa | Middle East | Saudi Arabia | |
| United Arab Emirates | |||
| Qatar | |||
| Rest of Middle East | |||
| Africa | South Africa | ||
| Nigeria | |||
| Rest of Africa | |||


Market Definition
- Aircraft Type - All the military aircraft which are used for various applications are included under military aviation market.
- Sub-Aircraft Type - For this study, all the military fixed-wing transport aircraft which are used for troops and cargo carrying are considered.
- Body Type - Various models of fixed-wing transport aircraft are considered in this study.
| Keyword | Definition |
|---|---|
| IATA | IATA stands for the International Air Transport Association, a trade organization composed of airlines around the world that has an influence over the commercial aspects of flight. |
| ICAO | ICAO stands for International Civil Aviation Organization, a specialized agency of the United Nations that supports aviation and navigation around the globe. |
| Air Operator Certificate (AOC) | A certificate granted by a National Aviation Authority permitting the conduct of commercial flying activities. |
| Certificate Of Airworthiness (CoA) | A Certificate Of Airworthiness (CoA) is issued for an aircraft by the civil aviation authority in the state in which the aircraft is registered. |
| Gross Domestic Product (GDP) | Gross domestic product (GDP) is a monetary measure of the market value of all the final goods and services produced in a specific time period by countries. |
| RPK (Revenue Passenger Kilometres) | The RPK of an airline is the sum of the products obtained by multiplying the number of revenue passengers carried on each flight stage by the stage distance - it is the total number of kilometers traveled by all revenue passengers. |
| Load Factor | The load factor is a metric used in the airline industry that measures the percentage of available seating capacity that has been filled with passengers. |
| Original Equipment Manufacturer (OEM) | An original equipment manufacturer (OEM) traditionally is defined as a company whose goods are used as components in the products of another company, which then sells the finished item to users. |
| International Transportation Safety Association (ITSA) | International Transportation Safety Association (ITSA) is an international network of heads of independent safety investigation authorities (SIA). |
| Available Seats Kilometre (ASK) | This metric is calculated by multiplying Available Seats (AS) in one flight, defined above, multiplied by the distance flown. |
| Gross Weight | The fully-loaded weight of an aircraft, also known as “takeoff weight,” which includes the combined weight of passengers, cargo, and fuel. |
| Airworthiness | The ability of an aircraft, or other airborne equipment or system, to operate in flight and on the ground without significant hazard to aircrew, ground crew, passengers or to other third parties. |
| Airworthiness Standards | Detailed and comprehensive design and safety criteria applicable to the category of aeronautical product (aircraft, engine or propeller). |
| Fixed Base Operator (FBO) | A business or organization that operates at an airport. An FBO provides aircraft operating services like maintenance, fueling, flight training, charter services, hangaring, and parking. |
| High Net worth Individuals (HNWIs) | High Net worth Individuals (HNWIs) are individuals with over USD 1 million in liquid financial assets. |
| Ultra High Net worth Individuals (UHNWIs) | Ultra High Net worth Individuals (UHNWIs) are individuals with over USD 30 million in liquid financial assets. |
| Federal Aviation Administration (FAA) | The division of the Department of Transportation is concerned with aviation. It operates Air Traffic Control and regulates everything from aircraft manufacturing to pilot training to airport operations in the United States. |
| EASA (European Aviation Safety Agency) | The European Aviation Safety Agency is a European Union agency established in 2002 with the task of overseeing civil aviation safety and regulation. |
| Airborne Warning and Control System (AW&C) aircraft | Airborne Warning and Control System (AEW&C) aircraft is equipped with a powerful radar and on-board command and control center to direct the armed forces. |
| The North Atlantic Treaty Organization (NATO) | The North Atlantic Treaty Organization (NATO), also called the North Atlantic Alliance, is an intergovernmental military alliance between 30 member states – 28 European and two North American. |
| Joint Strike Fighter (JSF) | Joint Strike Fighter (JSF) is a development and acquisition program intended to replace a wide range of existing fighter, strike, and ground attack aircraft for the United States, the United Kingdom, Italy, Canada, Australia, the Netherlands, Denmark, Norway, and formerly Turkey. |
| Light Combat Aircraft (LCA) | A light combat aircraft (LCA) is a light, multirole jet/turboprop military aircraft, commonly derived from advanced trainer designs, designed for engaging in light combat. |
| Stockholm International Peace Research Institute (SIPRI) | Stockholm International Peace Research Institute (SIPRI) is an international institute that provides data, analysis, and recommendations for armed conflict, military expenditure, and arms trade as well as disarmament and arms control. |
| Maritime Patrol Aircraft (MPA) | A maritime patrol aircraft (MPA), also known as maritime reconnaissance aircraft is a fixed-wing aircraft designed to operate for long durations over water in maritime patrol roles, in particular, anti-submarine warfare (ASW), anti-ship warfare (AShW), and search and rescue (SAR). |
| Mach Number | The Mach number is defined as the ratio of true airspeed to the speed of sound at the altitude of a given aircraft. |
| Stealth Aircraft | Stealth is a Common term applied to low observable (LO) technology and doctrine, that makes an aircraft near invisible to radar, infrared or visual detection. |


Research Methodology
Mordor Intelligence follows a four-step methodology in all our reports.
- Step-1: Identify Key Variables: In order to build a robust forecasting methodology, the variables and factors identified in Step-1 are tested against available historical market numbers. Through an iterative process, the variables required for market forecast are set and the model is built on the basis of these variables.
- Step-2: Build a Market Model: Market-size estimations for the historical and forecast years have been provided in revenue and volume terms. For sales conversion to volume, the average selling price (ASP) is kept constant throughout the forecast period for each country, and inflation is not a part of the pricing.
- Step-3: Validate and Finalize: In this important step, all market numbers, variables and analyst calls are validated through an extensive network of primary research experts from the market studied. The respondents are selected across levels and functions to generate a holistic picture of the market studied.
- Step-4: Research Outputs: Syndicated Reports, Custom Consulting Assignments, Databases & Subscription Platforms


