Market Overview
| Study Period | 2017 - 2030 |
| Base Year For Estimation | 2024 |
| Forecast Data Period | 2025 - 2030 |
| Market Size (2025) | USD 60.17 Billion |
| Market Size (2030) | USD 75.52 Billion |
| Growth Rate (2025 - 2030) | 4.65% CAGR |
| Market Concentration | High |
Major Players*Disclaimer: Major Players sorted in no particular order Image © Mordor Intelligence. Reuse requires attribution under CC BY 4.0. |
|

Military Aviation Market Analysis
The Military Aviation Market size is estimated at 60.17 billion USD in 2025, and is expected to reach 75.52 billion USD by 2030, growing at a CAGR of 4.65% during the forecast period (2025-2030).
The global military aviation landscape has been significantly influenced by escalating geopolitical tensions and increased defense spending worldwide. In 2022, global military expenditure reached a record high of USD 2,240 billion, marking a 3.7% increase from the previous year. The Russia-Ukraine conflict has been a major catalyst for this surge, prompting nations worldwide to reassess their military capabilities and operational readiness. The five largest military spenders the United States, China, Russia, India, and Saudi Arabia collectively accounted for 63% of global military spending, highlighting the concentrated nature of defense investments among major powers.
The military aviation market is witnessing a substantial transformation through fleet modernization initiatives across major military powers. The fixed-wing aircraft segment has demonstrated particular momentum, accounting for approximately 57% of global military aircraft deliveries in 2022. This trend is driven by the increasing procurement of next-generation combat aircraft, with countries like the United States, Germany, India, Australia, and the United Arab Emirates leading substantial procurement programs. NATO nations are actively pursuing fleet modernization and expansion programs, with a particular focus on advanced fixed-wing aircraft capabilities.
Indigenous manufacturing capabilities have become a strategic priority for numerous nations seeking to reduce dependency on foreign suppliers and strengthen domestic defense industrial bases. Countries are increasingly focusing on developing local manufacturing capabilities and fostering technological expertise within their borders. For instance, Saudi Arabia's Vision 2030 initiative aims to increase local military equipment spending to 50% by 2030, representing a significant shift towards domestic manufacturing capability. This trend is reshaping traditional supply chains and creating new opportunities for local defense manufacturers and military aircraft manufacturers.
The industry is experiencing a significant technological evolution with the integration of advanced capabilities in military aircraft. Over 7,700 military aircraft are expected to be delivered during 2023-2030, reflecting the substantial modernization wave sweeping across global military forces. Multi-mission military helicopters are emerging as a crucial component of military aviation strategies, with countries increasingly seeking versatile platforms capable of performing diverse operations. This trend is particularly evident in the procurement patterns of nations like India, Kuwait, Qatar, Australia, Russia, and the United Arab Emirates, who are investing in enhanced combat capabilities through advanced rotorcraft acquisitions.
Global Military Aviation Market Trends
Increased border tensions and the need for new aircraft has led to a surge in defense expenditure
- Asia-Pacific spent a total of USD 569 billion on military expenditures. Geopolitical conflicts such as border issues between China and India, internal security challenges, maritime surveillance, and counter-terrorism operations are some of the factors aiding the growth of the fixed-wing aircraft fleet of the countries in this region. The rise in military spending in China and India was the main cause of the increase in 2022. The combined military spending of the two nations in the region in 2022 was 66%. The increase in defense spending of the nations over the past ten years was driven by economic growth and territorial disputes.
- Major military powers, including India, China, Japan, and South Korea, are present in the Asia-Pacific region and are yearly growing their defense budgets. This budget includes a significant portion for the improvement and expansion of air superiority, which is driving the growth of military aviation in the region. For instance, in the budget of FY 2023, the Indian government allocated about 10% more for the Indian Air Force compared to the previous budget, including payments for the new Rafale fighters and the manufacturing of Sukhoi-30MKIs and Tejas fighters.
- The increased military spending in the Asia-Pacific region is intended to gain an advantage in several political and border conflicts, such as the tension in the South China Sea with many regional sovereign entities and border conflicts between India-China and India-Pakistan. The defense spending of major countries in China is expected to cross over USD 400 billion by 2030.

Understand The Key Trends Shaping This Market
Download PDF
Fleet modernization and new procurements are projected to improve the APAC's military active fleet
- By the end of 2022, there were 15,543 active aircraft in the Asia-Pacific region, of which fixed-wing aircraft accounted for 60% while rotorcraft accounted for the remaining fleet. China, India, Japan, and South Korea together accounted for 55% of the total active fleet in the region.
- In 2020, the average aircraft fleet age in Asia-Pacific amounted to 9.5 years, which was projected to increase by 2030, when the average aircraft fleet age across the region was expected to be 10.7 years. The older aircraft, some of which date back to the 1960s, have been slowly phased out by the Indian Air Force. The MiG 21 and MiG 27 have been the backbone of the Indian Air Force (IAF). The average age of these aircraft is around 45 years. Australia’s two fighter aircraft, FA-18 and F-35, have been in service for the last 16 years and 8 years, respectively.
- Countries such as China, India, and South Korea are expanding their aircraft fleet size to fulfill the demands of modern warfare. They may continue to produce and acquire next-generation aircraft during the forecast period. The regional armed forces are also enhancing the capabilities of helicopters with cutting-edge technology to obtain military superiority over the external threat.
- Asia Pacific's active fleet increased by 3% in 2022 compared to 2017. Indonesia and Thailand accounted for 63% of the total fleet in Southeast Asia. In the coming years, the aircraft fleet may increase as major countries like Thailand, Malaysia, Singapore, Indonesia, and the Philippines plan to procure over 135 aircraft. The active fleet of the region is expected to expand at a healthy rate during the forecast period.

OTHER KEY INDUSTRY TRENDS COVERED IN THE REPORT
- The Asia-Pacific economies have been subject to an increase in economic pressure due to a surge in public debt, which has had a negative impact on their defense spending
- The increased inflation has adversely impacted the growth of the region
- In South America, commodity exporters have been able to capitalize on external demand as an engine for growth
- Fleet replacement programs for older aircraft are projected to be the main driver for Middle Eastern military aviation
- The fleet replacement programs for aging aircraft are expected to aid in active fleet numbers
- Major military powers in the region have surged their defense expenditure
- The defense expenditure in the region has declined due to the reduction of military budgets by major military powers
- The Ukraine-Russia War is expected to improve defense contribution, even with economic growth uncertainty
- Improving economic stability can aid in the growth of North America
- Fixed-wing aircraft accounted for 54% of the total fleet in the European military aviation market
- Fleet modernization and the rising need for modernization of aircraft are the driving factors in North America
- NATO alliances are contributing to the region's defense spending
- Geopolitical threats are the main reason behind the increase in defense spending in the region
Segment Analysis: Sub Aircraft Type
Fixed-wing Aircraft Segment in Military Aviation Market
The fixed-wing aircraft segment dominates the military aviation market, accounting for approximately 87% of the total market share in 2024. This significant market position is driven by the extensive procurement of next-generation fighter aircraft by several countries, including the United States, Germany, India, Australia, the United Arab Emirates, and China. The segment's growth is primarily fueled by military forces' plans to replace their aging military aircraft fleet with advanced fighter jets, large military transport aircraft, and special-mission aircraft. Countries worldwide are investing heavily in modernizing their fixed-wing military aircraft fleet and procuring next-generation aircraft to enhance their aerial combat capabilities and maintain air superiority.
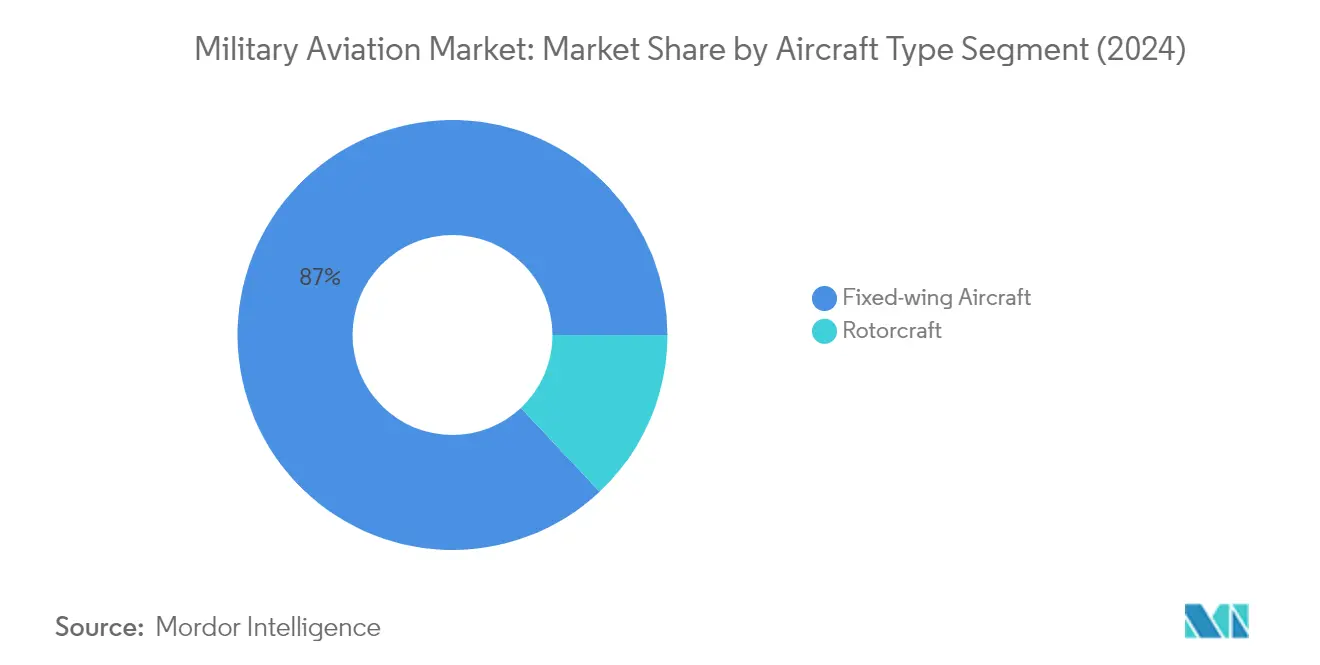
Rotorcraft Segment in Military Aviation Market
The military rotorcraft segment is experiencing the fastest growth in the military aviation market, with an expected growth rate of approximately 7% during 2024-2029. This growth is driven by increasing military conflicts, terrorism, border disputes, territory invasions, and violations worldwide. Regional armed forces are upgrading their military helicopters with cutting-edge technologies to gain military advantages over their adversaries. The segment's expansion is further supported by the changing nature of modern warfare, characterized by asymmetric threats and complex operational environments, which necessitate highly adaptable and flexible platforms. The rise of hybrid warfare, combining conventional and unconventional tactics, has also increased the demand for helicopters with advanced ISR capabilities.
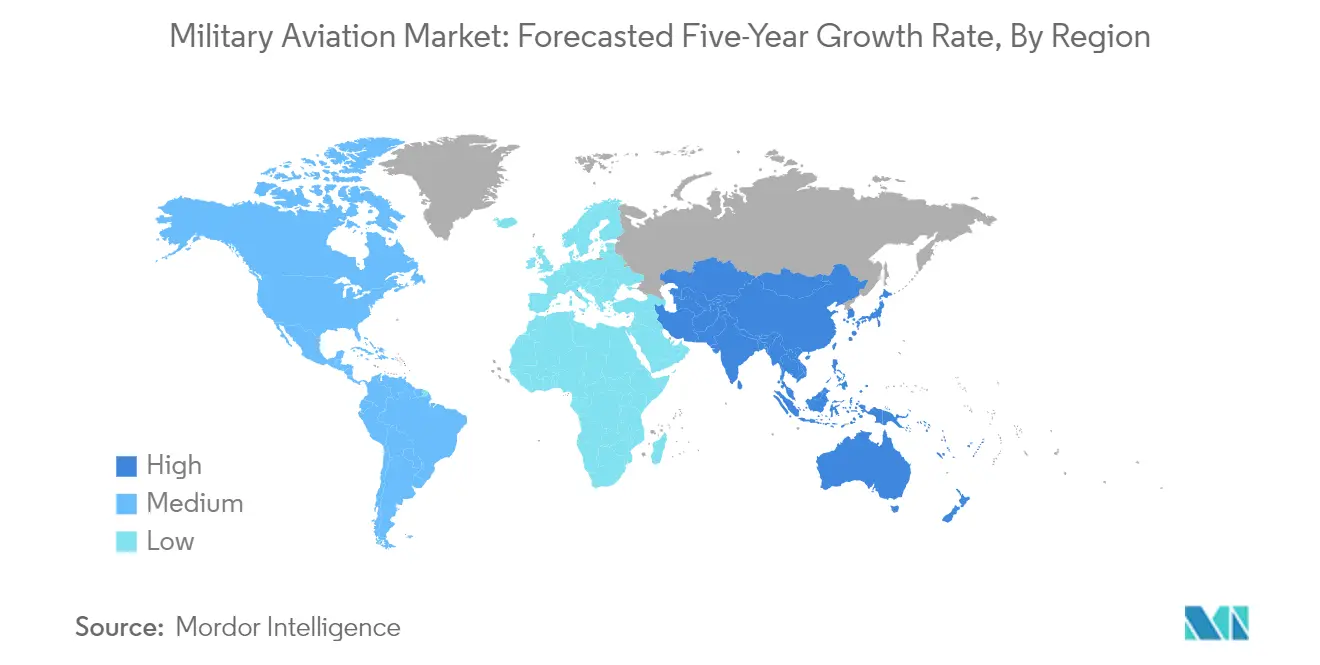
Military Aviation Market Geography Segment Analysis
Military Aviation Market in Asia-Pacific
The Asia-Pacific military aviation market is characterized by increasing defense modernization initiatives and growing geopolitical tensions in the region. Countries like China, India, Japan, and South Korea are making significant investments in next-generation military aircraft and advanced military technologies. The region's focus on indigenous manufacturing capabilities and strategic partnerships with global defense contractors is reshaping the competitive landscape. Rising territorial disputes and maritime security concerns are driving the procurement of both fixed-wing and rotary military aircraft across multiple countries.
Military Aviation Market in China
China represents the largest market for military aviation in the Asia-Pacific region, with approximately 25% market share in 2024. The country's military modernization program emphasizes developing advanced fighter aircraft, transport planes, and combat helicopters. China's focus on technological self-reliance has led to significant investments in indigenous aircraft development programs. The country's strategic initiatives include expanding its fleet of stealth fighter aircraft, maritime patrol aircraft, and military transport aircraft capabilities. The domestic defense industry has made substantial progress in developing advanced avionics, propulsion systems, and combat capabilities.
Military Aviation Market in India
India emerges as the fastest-growing market in the Asia-Pacific region, with a projected growth rate of approximately 15% from 2024 to 2029. The country's ambitious military modernization plans include significant investments in both fixed-wing and rotary-wing platforms. India's focus on indigenous manufacturing through initiatives like "Make in India" has attracted major global aerospace companies for local production and technology transfer. The country's procurement strategy emphasizes multi-role combat aircraft, transport planes, and advanced military helicopters to enhance its operational capabilities.
Military Aviation Market in Europe
The European military aviation market is undergoing significant transformation driven by regional security concerns and modernization requirements. Countries across the region are investing in advanced fighter aircraft, transport planes, and military helicopters. The ongoing geopolitical tensions have accelerated defense spending and procurement programs. The region's focus on collaborative defense projects and interoperability among NATO members continues to shape market dynamics.
Military Aviation Market in Germany
Germany stands as the largest military aviation market in Europe, commanding approximately 20% of the regional market share in 2024. The country's comprehensive military modernization program includes significant investments in next-generation military aircraft, transport planes, and combat helicopters. Germany's strategic focus on enhancing its air force capabilities has led to major procurement initiatives and upgrades of existing platforms. The country's defense industry maintains strong partnerships with European and global aerospace manufacturers.
Military Aviation Market in Turkey
Turkey demonstrates the highest growth potential in the European region, with an estimated growth rate of approximately 14% from 2024 to 2029. The country's ambitious plans for military aviation include developing indigenous aircraft and helicopter programs. Turkey's strategic location and regional security concerns drive investments in advanced military aviation capabilities. The country's focus on building domestic aerospace capabilities has resulted in several successful indigenous development programs.
Military Aviation Market in Middle East and Africa
The Middle East and Africa region's military aviation market is characterized by significant modernization initiatives and regional security challenges. Countries in this region are actively investing in advanced military aircraft and related technologies to enhance their defense capabilities. The market is driven by ongoing regional tensions and the need to replace aging military aircraft fleets.
Military Aviation Market in Saudi Arabia
Saudi Arabia represents the largest military aviation market in the Middle East and Africa region. The kingdom's comprehensive military modernization program includes significant investments in advanced fighter aircraft, military transport planes, and combat helicopters. Saudi Arabia's focus on enhancing its air force capabilities has led to major procurement programs with leading global aerospace manufacturers. The country's strategic initiatives aim to develop domestic aerospace capabilities while maintaining a modern and capable air force.
Military Aviation Market in United Arab Emirates
The United Arab Emirates emerges as the fastest-growing market in the Middle East and Africa region. The UAE's strategic focus on building advanced military aviation capabilities includes the procurement of next-generation fighter aircraft and military helicopters. The country's investment in military aviation technologies reflects its commitment to maintaining regional security and developing domestic defense capabilities. The UAE's procurement strategy emphasizes advanced combat aircraft and multi-role platforms.
Military Aviation Market in North America
The North American military aviation market, encompassing the United States, Canada, and Mexico, represents the largest regional market globally. The United States dominates the region's military aviation sector, leading both in market size and technological advancement. The region's market is characterized by significant investments in next-generation aircraft development, advanced combat systems, and military helicopter programs. Canada and Mexico maintain focused procurement programs aligned with their specific defense requirements and strategic priorities. The market benefits from strong research and development capabilities, established aerospace manufacturing infrastructure, and ongoing modernization initiatives across all three countries.
Military Aviation Market in South America
The South American military aviation market, comprising Brazil, Chile, and Colombia, demonstrates growing potential with increasing defense modernization initiatives. Brazil emerges as both the largest and fastest-growing market in the region, leading major procurement programs for both fixed-wing and rotary aircraft. The region's military aviation sector is characterized by fleet modernization efforts, indigenous development programs, and strategic partnerships with global aerospace manufacturers. Countries in the region are focusing on enhancing their air force capabilities through targeted procurement of combat aircraft, military transport planes, and training aircraft. The market dynamics are shaped by regional security requirements, budget constraints, and efforts to develop domestic aerospace capabilities.
Get Analysis on Important Geographic Markets
Download PDF
Military Aviation Industry Overview
Top Companies in Military Aviation Market
The military aviation market is characterized by continuous product innovation across fixed-wing and rotary aircraft segments, with major players investing heavily in next-generation fighter jets, transport military aircraft, and combat helicopters. Companies are demonstrating operational agility by expanding their production facilities and strengthening their supply chain networks to meet increasing defense requirements globally. Strategic partnerships and collaborations have become crucial, particularly in developing advanced technologies like stealth capabilities, autonomous systems, and enhanced avionics. Market leaders are focusing on geographical expansion through local manufacturing facilities and offset agreements, while also emphasizing research and development to maintain technological superiority. The industry has witnessed significant moves in securing long-term contracts for military aircraft deliveries and maintenance services, particularly in emerging markets where military modernization programs are driving demand.
Market Dominated by Established Defense Conglomerates
The military aviation industry exhibits a highly consolidated structure dominated by large defense conglomerates with extensive manufacturing capabilities and technological expertise. These major players, primarily based in North America and Europe, have established strong relationships with government defense departments and maintain significant market share through their diverse product portfolios and long-standing industry presence. The military aircraft industry demonstrates high entry barriers due to substantial capital requirements, complex regulatory frameworks, and the need for advanced technological capabilities, which favors established players with proven track records.
The industry landscape is characterized by strategic alliances and joint ventures rather than traditional mergers and acquisitions, as companies seek to combine complementary capabilities and share development costs for new aircraft programs. Local players in emerging markets are gradually gaining prominence through government support and offset requirements, leading to technology transfer agreements and manufacturing partnerships with global leaders. The market structure encourages long-term relationships between manufacturers and customers, with contracts often spanning multiple years and including comprehensive maintenance and support services.
Innovation and Adaptability Drive Future Success
Success in the military aerospace market increasingly depends on companies' ability to innovate while maintaining cost efficiency and reliability. Market leaders must focus on developing modular and upgradeable platforms that can adapt to evolving military requirements and incorporate emerging technologies. Companies need to strengthen their digital capabilities, including cybersecurity features and network-centric warfare compatibility, while also investing in sustainable technologies to meet future environmental regulations. Building strong local partnerships and establishing regional manufacturing facilities will become crucial for accessing new markets and meeting offset requirements.
For emerging players and contenders, success lies in identifying specialized market segments and developing niche capabilities that complement existing platforms. Companies must focus on building strong relationships with defense agencies and prime contractors while investing in research and development to create differentiated offerings. The ability to provide comprehensive lifecycle support services and maintain flexibility in production capabilities will be essential for long-term success. Future market dynamics will be influenced by geopolitical factors, changing military doctrines, and the increasing emphasis on indigenous manufacturing capabilities in key markets, requiring companies to maintain adaptable business strategies and strong local presence.
Military Aviation Market Leaders
-
Airbus SE
-
Dassault Aviation
-
Lockheed Martin Corporation
-
Textron Inc.
-
The Boeing Company
- *Disclaimer: Major Players sorted in no particular order

Need More Details on Market Players and Competitors?
Download PDF
Military Aviation Market News
- June 2023: Airbus Flight Academy Europe, a subsidiary of Airbus that supplies training services for the pilots and civilian cadets of the French Armed Forces, signed a memorandum of understanding (MoU) with AURA AERO.
- May 2023: The US State Department approved a potential sale of CH-47 Chinook helicopters, engines, and equipment worth USD 8.5 billion to Germany.
- March 2023: Boeing has been awarded a contract by the US government to manufacture 184 AH-64E Apache attack helicopters for the US military and international customers. The US government announced USD 1.95 million, indicating that the helicopter will be delivered to the US military and overseas buyers - specifically Australia and Egypt - as a part of the paramilitary process to the Foreign Service (FMS) from the US government. Contract completion is expected by the end of 2027.
Free With This Report
We provide a complimentary and exhaustive set of data points on global and regional metrics that present the fundamental structure of the industry. Presented in the form of 45+ free charts, the section covers data on commercial aircraft deliveries by manufacturer, backlogs of commercial aircraft, active military aircraft fleet by type of aircraft, overall business jets and helicopters fleet by manufacturer and also classified by type of ownership.


List of Tables & Figures
- Figure 1:
- GROSS DOMESTIC PRODUCT, USD, ASIA-PACIFIC, 2017 - 2030
- Figure 2:
- GROSS DOMESTIC PRODUCT, USD, EUROPE, 2017 - 2030
- Figure 3:
- GROSS DOMESTIC PRODUCT, USD, MIDDLE EAST AND AFRICA, 2017 - 2030
- Figure 4:
- GROSS DOMESTIC PRODUCT, USD, NORTH AMERICA, 2017 - 2028
- Figure 5:
- GROSS DOMESTIC PRODUCT, USD, SOUTH AMERICA, 2017 - 2030
- Figure 6:
- ACTIVE MILITARY AIRCRAFT FLEET BY COUNTRY, NUMBER OF AIRCRAFT, VOLUME, ASIA-PACIFIC, 2016 - 2030
- Figure 7:
- ACTIVE MILITARY AIRCRAFT FLEET BY COUNTRY, NUMBER OF AIRCRAFT, VOLUME, EUROPE, 2016 - 2030
- Figure 8:
- ACTIVE MILITARY AIRCRAFT FLEET BY COUNTRY, NUMBER OF AIRCRAFT, VOLUME, MIDDLE EAST AND AFRICA, 2016 - 2030
- Figure 9:
- ACTIVE MILITARY AIRCRAFT FLEET BY COUNTRY, NUMBER OF AIRCRAFT, VOLUME, NORTH AMERICA, 2016 - 2030
- Figure 10:
- ACTIVE MILITARY AIRCRAFT FLEET BY COUNTRY, NUMBER OF AIRCRAFT, VOLUME, SOUTH AMERICA, 2016 - 2030
- Figure 11:
- DEFENSE SPENDING, USD, ASIA-PACIFIC, 2017 - 2030
- Figure 12:
- DEFENSE SPENDING, USD, EUROPE, 2017 - 2030
- Figure 13:
- DEFENSE SPENDING, USD, MIDDLE EAST AND AFRICA, 2017 - 2030
- Figure 14:
- DEFENSE SPENDING, USD, NORTH AMERICA, 2017 - 2030
- Figure 15:
- DEFENSE SPENDING, USD, SOUTH AMERICA, 2017 - 2030
- Figure 16:
- NUMBER OF NEW AIRCRAFT DELIVERIES, VOLUME, GLOBAL, 2017 - 2030
- Figure 17:
- NUMBER OF NEW AIRCRAFT DELIVERIES, USD, GLOBAL, 2017 - 2030
- Figure 18:
- MILITARY AVIATION DELIVERIES BY SUB AIRCRAFT TYPE, VOLUME, GLOBAL, 2017 - 2030
- Figure 19:
- MILITARY AVIATION DELIVERIES BY SUB AIRCRAFT TYPE, USD, GLOBAL, 2017 - 2030
- Figure 20:
- MILITARY AVIATION DELIVERIES BY SUB AIRCRAFT TYPE, VOLUME %, GLOBAL, 2017 VS 2023 VS 2030
- Figure 21:
- MILITARY AVIATION DELIVERIES BY SUB AIRCRAFT TYPE, VALUE %, GLOBAL, 2017 VS 2023 VS 2030
- Figure 22:
- FIXED-WING AIRCRAFT DELIVERIES BY BODY TYPE, VOLUME, GLOBAL, 2017 - 2030
- Figure 23:
- FIXED-WING AIRCRAFT DELIVERIES BY BODY TYPE, USD, GLOBAL, 2017 - 2030
- Figure 24:
- FIXED-WING AIRCRAFT DELIVERIES BY BODY TYPE, VOLUME %, GLOBAL, 2017 VS 2023 VS 2030
- Figure 25:
- FIXED-WING AIRCRAFT DELIVERIES BY BODY TYPE, VALUE %, GLOBAL, 2017 VS 2023 VS 2030
- Figure 26:
- GLOBAL MILITARY AVIATION MARKET, BY MULTI-ROLE AIRCRAFT, UNITS, 2017 - 2030
- Figure 27:
- GLOBAL MILITARY AVIATION MARKET, BY MULTI-ROLE AIRCRAFT, USD, 2017 - 2030
- Figure 28:
- GLOBAL MILITARY AVIATION MARKET, BY BODY TYPE, USD, %, 2023 VS 2030
- Figure 29:
- GLOBAL MILITARY AVIATION MARKET, BY TRAINING AIRCRAFT, UNITS, 2017 - 2030
- Figure 30:
- GLOBAL MILITARY AVIATION MARKET, BY TRAINING AIRCRAFT, USD, 2017 - 2030
- Figure 31:
- GLOBAL MILITARY AVIATION MARKET, BY BODY TYPE, USD, %, 2023 VS 2030
- Figure 32:
- GLOBAL MILITARY AVIATION MARKET, BY TRANSPORT AIRCRAFT, UNITS, 2017 - 2030
- Figure 33:
- GLOBAL MILITARY AVIATION MARKET, BY TRANSPORT AIRCRAFT, USD, 2017 - 2030
- Figure 34:
- GLOBAL MILITARY AVIATION MARKET, BY BODY TYPE, USD, %, 2023 VS 2030
- Figure 35:
- GLOBAL MILITARY AVIATION MARKET, BY OTHERS, UNITS, 2017 - 2030
- Figure 36:
- GLOBAL MILITARY AVIATION MARKET, BY OTHERS, USD, 2017 - 2030
- Figure 37:
- GLOBAL MILITARY AVIATION MARKET, BY BODY TYPE, USD, %, 2023 VS 2030
- Figure 38:
- ROTORCRAFT DELIVERIES BY BODY TYPE, VOLUME, GLOBAL, 2017 - 2030
- Figure 39:
- ROTORCRAFT DELIVERIES BY BODY TYPE, USD, GLOBAL, 2017 - 2030
- Figure 40:
- ROTORCRAFT DELIVERIES BY BODY TYPE, VOLUME %, GLOBAL, 2017 VS 2023 VS 2030
- Figure 41:
- ROTORCRAFT DELIVERIES BY BODY TYPE, VALUE %, GLOBAL, 2017 VS 2023 VS 2030
- Figure 42:
- GLOBAL MILITARY AVIATION MARKET, BY MULTI-MISSION HELICOPTER, UNITS, 2017 - 2030
- Figure 43:
- GLOBAL MILITARY AVIATION MARKET, BY MULTI-MISSION HELICOPTER, USD, 2017 - 2030
- Figure 44:
- GLOBAL MILITARY AVIATION MARKET, BY BODY TYPE, USD, %, 2023 VS 2030
- Figure 45:
- GLOBAL MILITARY AVIATION MARKET, BY TRANSPORT HELICOPTER, UNITS, 2017 - 2030
- Figure 46:
- GLOBAL MILITARY AVIATION MARKET, BY TRANSPORT HELICOPTER, USD, 2017 - 2030
- Figure 47:
- GLOBAL MILITARY AVIATION MARKET, BY BODY TYPE, USD, %, 2023 VS 2030
- Figure 48:
- GLOBAL MILITARY AVIATION MARKET, BY OTHERS, UNITS, 2017 - 2030
- Figure 49:
- GLOBAL MILITARY AVIATION MARKET, BY OTHERS, USD, 2017 - 2030
- Figure 50:
- GLOBAL MILITARY AVIATION MARKET, BY BODY TYPE, USD, %, 2023 VS 2030
- Figure 51:
- MILITARY AVIATION DELIVERIES BY REGION, VOLUME, GLOBAL, 2017 - 2030
- Figure 52:
- MILITARY AVIATION DELIVERIES BY REGION, USD, GLOBAL, 2017 - 2030
- Figure 53:
- MILITARY AVIATION DELIVERIES BY REGION, VOLUME %, GLOBAL, 2017 VS 2023 VS 2030
- Figure 54:
- MILITARY AVIATION DELIVERIES BY REGION, VALUE %, GLOBAL, 2017 VS 2023 VS 2030
- Figure 55:
- MILITARY AVIATION DELIVERIES BY COUNTRY, VOLUME, ASIA-PACIFIC, 2017 - 2030
- Figure 56:
- MILITARY AVIATION DELIVERIES BY COUNTRY, USD, ASIA-PACIFIC, 2017 - 2030
- Figure 57:
- MILITARY AVIATION DELIVERIES BY COUNTRY, VOLUME %, ASIA-PACIFIC, 2017 VS 2023 VS 2030
- Figure 58:
- MILITARY AVIATION DELIVERIES BY COUNTRY, VALUE %, ASIA-PACIFIC, 2017 VS 2023 VS 2030
- Figure 59:
- GLOBAL MILITARY AVIATION MARKET, BY AUSTRALIA, UNITS, 2017 - 2030
- Figure 60:
- GLOBAL MILITARY AVIATION MARKET, BY AUSTRALIA, USD, 2017 - 2030
- Figure 61:
- MILITARY AVIATION DELIVERIES SHARE, VALUE, %, AUSTRALIA, 2023 VS 2030
- Figure 62:
- GLOBAL MILITARY AVIATION MARKET, BY CHINA, UNITS, 2017 - 2030
- Figure 63:
- GLOBAL MILITARY AVIATION MARKET, BY CHINA, USD, 2017 - 2030
- Figure 64:
- MILITARY AVIATION DELIVERIES SHARE, VALUE, %, CHINA, 2023 VS 2030
- Figure 65:
- GLOBAL MILITARY AVIATION MARKET, BY INDIA, UNITS, 2017 - 2030
- Figure 66:
- GLOBAL MILITARY AVIATION MARKET, BY INDIA, USD, 2017 - 2030
- Figure 67:
- MILITARY AVIATION DELIVERIES SHARE, VALUE, %, INDIA, 2023 VS 2030
- Figure 68:
- GLOBAL MILITARY AVIATION MARKET, BY INDONESIA, UNITS, 2017 - 2030
- Figure 69:
- GLOBAL MILITARY AVIATION MARKET, BY INDONESIA, USD, 2017 - 2030
- Figure 70:
- MILITARY AVIATION DELIVERIES SHARE, VALUE, %, INDONESIA, 2023 VS 2030
- Figure 71:
- GLOBAL MILITARY AVIATION MARKET, BY JAPAN, UNITS, 2017 - 2030
- Figure 72:
- GLOBAL MILITARY AVIATION MARKET, BY JAPAN, USD, 2017 - 2030
- Figure 73:
- MILITARY AVIATION DELIVERIES SHARE, VALUE, %, JAPAN, 2023 VS 2030
- Figure 74:
- GLOBAL MILITARY AVIATION MARKET, BY MALAYSIA, UNITS, 2017 - 2030
- Figure 75:
- GLOBAL MILITARY AVIATION MARKET, BY MALAYSIA, USD, 2017 - 2030
- Figure 76:
- MILITARY AVIATION DELIVERIES SHARE, VALUE, %, MALAYSIA, 2023 VS 2030
- Figure 77:
- GLOBAL MILITARY AVIATION MARKET, BY PHILIPPINES, UNITS, 2017 - 2030
- Figure 78:
- GLOBAL MILITARY AVIATION MARKET, BY PHILIPPINES, USD, 2017 - 2030
- Figure 79:
- MILITARY AVIATION DELIVERIES SHARE, VALUE, %, PHILIPPINES, 2023 VS 2030
- Figure 80:
- GLOBAL MILITARY AVIATION MARKET, BY SINGAPORE, UNITS, 2017 - 2030
- Figure 81:
- GLOBAL MILITARY AVIATION MARKET, BY SINGAPORE, USD, 2017 - 2030
- Figure 82:
- MILITARY AVIATION DELIVERIES SHARE, VALUE, %, SINGAPORE, 2023 VS 2030
- Figure 83:
- GLOBAL MILITARY AVIATION MARKET, BY SOUTH KOREA, UNITS, 2017 - 2030
- Figure 84:
- GLOBAL MILITARY AVIATION MARKET, BY SOUTH KOREA, USD, 2017 - 2030
- Figure 85:
- MILITARY AVIATION DELIVERIES SHARE, VALUE, %, SOUTH KOREA, 2023 VS 2030
- Figure 86:
- GLOBAL MILITARY AVIATION MARKET, BY THAILAND, UNITS, 2017 - 2030
- Figure 87:
- GLOBAL MILITARY AVIATION MARKET, BY THAILAND, USD, 2017 - 2030
- Figure 88:
- MILITARY AVIATION DELIVERIES SHARE, VALUE, %, THAILAND, 2023 VS 2030
- Figure 89:
- GLOBAL MILITARY AVIATION MARKET, BY REST OF ASIA-PACIFIC, UNITS, 2017 - 2030
- Figure 90:
- GLOBAL MILITARY AVIATION MARKET, BY REST OF ASIA-PACIFIC, USD, 2017 - 2030
- Figure 91:
- MILITARY AVIATION DELIVERIES SHARE, VALUE, %, REST OF ASIA-PACIFIC, 2023 VS 2030
- Figure 92:
- MILITARY AVIATION DELIVERIES BY COUNTRY, VOLUME, EUROPE, 2017 - 2030
- Figure 93:
- MILITARY AVIATION DELIVERIES BY COUNTRY, USD, EUROPE, 2017 - 2030
- Figure 94:
- MILITARY AVIATION DELIVERIES BY COUNTRY, VOLUME %, EUROPE, 2017 VS 2023 VS 2030
- Figure 95:
- MILITARY AVIATION DELIVERIES BY COUNTRY, VALUE %, EUROPE, 2017 VS 2023 VS 2030
- Figure 96:
- GLOBAL MILITARY AVIATION MARKET, BY FRANCE, UNITS, 2017 - 2030
- Figure 97:
- GLOBAL MILITARY AVIATION MARKET, BY FRANCE, USD, 2017 - 2030
- Figure 98:
- MILITARY AVIATION DELIVERIES SHARE, VALUE, %, FRANCE, 2023 VS 2030
- Figure 99:
- GLOBAL MILITARY AVIATION MARKET, BY GERMANY, UNITS, 2017 - 2030
- Figure 100:
- GLOBAL MILITARY AVIATION MARKET, BY GERMANY, USD, 2017 - 2030
- Figure 101:
- MILITARY AVIATION DELIVERIES SHARE, VALUE, %, GERMANY, 2023 VS 2030
- Figure 102:
- GLOBAL MILITARY AVIATION MARKET, BY ITALY, UNITS, 2017 - 2030
- Figure 103:
- GLOBAL MILITARY AVIATION MARKET, BY ITALY, USD, 2017 - 2030
- Figure 104:
- MILITARY AVIATION DELIVERIES SHARE, VALUE, %, ITALY, 2023 VS 2030
- Figure 105:
- GLOBAL MILITARY AVIATION MARKET, BY NETHERLANDS, UNITS, 2017 - 2030
- Figure 106:
- GLOBAL MILITARY AVIATION MARKET, BY NETHERLANDS, USD, 2017 - 2030
- Figure 107:
- MILITARY AVIATION DELIVERIES SHARE, VALUE, %, NETHERLANDS, 2023 VS 2030
- Figure 108:
- GLOBAL MILITARY AVIATION MARKET, BY RUSSIA, UNITS, 2017 - 2030
- Figure 109:
- GLOBAL MILITARY AVIATION MARKET, BY RUSSIA, USD, 2017 - 2030
- Figure 110:
- MILITARY AVIATION DELIVERIES SHARE, VALUE, %, RUSSIA, 2023 VS 2030
- Figure 111:
- GLOBAL MILITARY AVIATION MARKET, BY SPAIN, UNITS, 2017 - 2030
- Figure 112:
- GLOBAL MILITARY AVIATION MARKET, BY SPAIN, USD, 2017 - 2030
- Figure 113:
- MILITARY AVIATION DELIVERIES SHARE, VALUE, %, SPAIN, 2023 VS 2030
- Figure 114:
- GLOBAL MILITARY AVIATION MARKET, BY TURKEY, UNITS, 2017 - 2030
- Figure 115:
- GLOBAL MILITARY AVIATION MARKET, BY TURKEY, USD, 2017 - 2030
- Figure 116:
- MILITARY AVIATION DELIVERIES SHARE, VALUE, %, TURKEY, 2023 VS 2030
- Figure 117:
- GLOBAL MILITARY AVIATION MARKET, BY UK, UNITS, 2017 - 2030
- Figure 118:
- GLOBAL MILITARY AVIATION MARKET, BY UK, USD, 2017 - 2030
- Figure 119:
- MILITARY AVIATION DELIVERIES SHARE, VALUE, %, UK, 2023 VS 2030
- Figure 120:
- GLOBAL MILITARY AVIATION MARKET, BY REST OF EUROPE, UNITS, 2017 - 2030
- Figure 121:
- GLOBAL MILITARY AVIATION MARKET, BY REST OF EUROPE, USD, 2017 - 2030
- Figure 122:
- MILITARY AVIATION DELIVERIES SHARE, VALUE, %, REST OF EUROPE, 2023 VS 2030
- Figure 123:
- MILITARY AVIATION DELIVERIES BY COUNTRY, VOLUME, MIDDLE EAST AND AFRICA, 2017 - 2030
- Figure 124:
- MILITARY AVIATION DELIVERIES BY COUNTRY, USD, MIDDLE EAST AND AFRICA, 2017 - 2030
- Figure 125:
- MILITARY AVIATION DELIVERIES BY COUNTRY, VOLUME %, MIDDLE EAST AND AFRICA, 2017 VS 2023 VS 2030
- Figure 126:
- MILITARY AVIATION DELIVERIES BY COUNTRY, VALUE %, MIDDLE EAST AND AFRICA, 2017 VS 2023 VS 2030
- Figure 127:
- GLOBAL MILITARY AVIATION MARKET, BY ALGERIA, UNITS, 2017 - 2030
- Figure 128:
- GLOBAL MILITARY AVIATION MARKET, BY ALGERIA, USD, 2017 - 2030
- Figure 129:
- MILITARY AVIATION DELIVERIES SHARE, VALUE, %, ALGERIA, 2023 VS 2030
- Figure 130:
- GLOBAL MILITARY AVIATION MARKET, BY EGYPT, UNITS, 2017 - 2030
- Figure 131:
- GLOBAL MILITARY AVIATION MARKET, BY EGYPT, USD, 2017 - 2030
- Figure 132:
- MILITARY AVIATION DELIVERIES SHARE, VALUE, %, EGYPT, 2023 VS 2030
- Figure 133:
- GLOBAL MILITARY AVIATION MARKET, BY QATAR, UNITS, 2017 - 2030
- Figure 134:
- GLOBAL MILITARY AVIATION MARKET, BY QATAR, USD, 2017 - 2030
- Figure 135:
- MILITARY AVIATION DELIVERIES SHARE, VALUE, %, QATAR, 2023 VS 2030
- Figure 136:
- GLOBAL MILITARY AVIATION MARKET, BY SAUDI ARABIA, UNITS, 2017 - 2030
- Figure 137:
- GLOBAL MILITARY AVIATION MARKET, BY SAUDI ARABIA, USD, 2017 - 2030
- Figure 138:
- MILITARY AVIATION DELIVERIES SHARE, VALUE, %, SAUDI ARABIA, 2023 VS 2030
- Figure 139:
- GLOBAL MILITARY AVIATION MARKET, BY UNITED ARAB EMIRATES, UNITS, 2017 - 2030
- Figure 140:
- GLOBAL MILITARY AVIATION MARKET, BY UNITED ARAB EMIRATES, USD, 2017 - 2030
- Figure 141:
- MILITARY AVIATION DELIVERIES SHARE, VALUE, %, UNITED ARAB EMIRATES, 2023 VS 2030
- Figure 142:
- GLOBAL MILITARY AVIATION MARKET, BY REST OF MIDDLE EAST AND AFRICA, UNITS, 2017 - 2030
- Figure 143:
- GLOBAL MILITARY AVIATION MARKET, BY REST OF MIDDLE EAST AND AFRICA, USD, 2017 - 2030
- Figure 144:
- MILITARY AVIATION DELIVERIES SHARE, VALUE, %, REST OF MIDDLE EAST AND AFRICA, 2023 VS 2030
- Figure 145:
- MILITARY AVIATION DELIVERIES BY COUNTRY, VOLUME, NORTH AMERICA, 2017 - 2030
- Figure 146:
- MILITARY AVIATION DELIVERIES BY COUNTRY, USD, NORTH AMERICA, 2017 - 2030
- Figure 147:
- MILITARY AVIATION DELIVERIES BY COUNTRY, VOLUME %, NORTH AMERICA, 2017 VS 2023 VS 2030
- Figure 148:
- MILITARY AVIATION DELIVERIES BY COUNTRY, VALUE %, NORTH AMERICA, 2017 VS 2023 VS 2030
- Figure 149:
- GLOBAL MILITARY AVIATION MARKET, BY CANADA, UNITS, 2017 - 2030
- Figure 150:
- GLOBAL MILITARY AVIATION MARKET, BY CANADA, USD, 2017 - 2030
- Figure 151:
- MILITARY AVIATION DELIVERIES SHARE, VALUE, %, CANADA, 2023 VS 2030
- Figure 152:
- GLOBAL MILITARY AVIATION MARKET, BY MEXICO, UNITS, 2017 - 2030
- Figure 153:
- GLOBAL MILITARY AVIATION MARKET, BY MEXICO, USD, 2017 - 2030
- Figure 154:
- MILITARY AVIATION DELIVERIES SHARE, VALUE, %, MEXICO, 2023 VS 2030
- Figure 155:
- GLOBAL MILITARY AVIATION MARKET, BY UNITED STATES, UNITS, 2017 - 2030
- Figure 156:
- GLOBAL MILITARY AVIATION MARKET, BY UNITED STATES, USD, 2017 - 2030
- Figure 157:
- MILITARY AVIATION DELIVERIES SHARE, VALUE, %, UNITED STATES, 2023 VS 2030
- Figure 158:
- GLOBAL MILITARY AVIATION MARKET, BY REST OF NORTH AMERICA, UNITS, 2017 - 2030
- Figure 159:
- GLOBAL MILITARY AVIATION MARKET, BY REST OF NORTH AMERICA, USD, 2017 - 2030
- Figure 160:
- MILITARY AVIATION DELIVERIES SHARE, VALUE, %, REST OF NORTH AMERICA, 2023 VS 2030
- Figure 161:
- MILITARY AVIATION DELIVERIES BY COUNTRY, VOLUME, SOUTH AMERICA, 2017 - 2030
- Figure 162:
- MILITARY AVIATION DELIVERIES BY COUNTRY, USD, SOUTH AMERICA, 2017 - 2030
- Figure 163:
- MILITARY AVIATION DELIVERIES BY COUNTRY, VOLUME %, SOUTH AMERICA, 2017 VS 2023 VS 2030
- Figure 164:
- MILITARY AVIATION DELIVERIES BY COUNTRY, VALUE %, SOUTH AMERICA, 2017 VS 2023 VS 2030
- Figure 165:
- GLOBAL MILITARY AVIATION MARKET, BY BRAZIL, UNITS, 2017 - 2030
- Figure 166:
- GLOBAL MILITARY AVIATION MARKET, BY BRAZIL, USD, 2017 - 2030
- Figure 167:
- MILITARY AVIATION DELIVERIES SHARE, VALUE, %, BRAZIL, 2023 VS 2030
- Figure 168:
- GLOBAL MILITARY AVIATION MARKET, BY CHILE, UNITS, 2017 - 2030
- Figure 169:
- GLOBAL MILITARY AVIATION MARKET, BY CHILE, USD, 2017 - 2030
- Figure 170:
- MILITARY AVIATION DELIVERIES SHARE, VALUE, %, CHILE, 2023 VS 2030
- Figure 171:
- GLOBAL MILITARY AVIATION MARKET, BY COLOMBIA, UNITS, 2017 - 2030
- Figure 172:
- GLOBAL MILITARY AVIATION MARKET, BY COLOMBIA, USD, 2017 - 2030
- Figure 173:
- MILITARY AVIATION DELIVERIES SHARE, VALUE, %, COLOMBIA, 2023 VS 2030
- Figure 174:
- GLOBAL MILITARY AVIATION MARKET, BY REST OF SOUTH AMERICA, UNITS, 2017 - 2030
- Figure 175:
- GLOBAL MILITARY AVIATION MARKET, BY REST OF SOUTH AMERICA, USD, 2017 - 2030
- Figure 176:
- MILITARY AVIATION DELIVERIES SHARE, VALUE, %, REST OF SOUTH AMERICA, 2023 VS 2030
- Figure 177:
- MOST ACTIVE COMPANIES, NUMBER OF STRATEGIC MOVES, GLOBAL, 2018-2023
- Figure 178:
- MOST ADOPTED STRATEGIES, COUNT, GLOBAL, 2018 - 2023
- Figure 179:
- MAJOR PLAYERS REVENUE SHARE (%), GLOBAL
Military Aviation Industry Segmentation
Fixed-Wing Aircraft, Rotorcraft are covered as segments by Sub Aircraft Type. Asia-Pacific, Europe, Middle East and Africa, North America, South America are covered as segments by Region.| Sub Aircraft Type | Fixed-Wing Aircraft | Multi-Role Aircraft | |
| Training Aircraft | |||
| Transport Aircraft | |||
| Others | |||
| Rotorcraft | Multi-Mission Helicopter | ||
| Transport Helicopter | |||
| Others | |||
| Region | Asia-Pacific | Australia | |
| China | |||
| India | |||
| Indonesia | |||
| Japan | |||
| Malaysia | |||
| Philippines | |||
| Singapore | |||
| South Korea | |||
| Thailand | |||
| Rest of Asia-Pacific | |||
| Europe | France | ||
| Germany | |||
| Italy | |||
| Netherlands | |||
| Russia | |||
| Spain | |||
| Turkey | |||
| UK | |||
| Rest of Europe | |||
| Middle East and Africa | Algeria | ||
| Egypt | |||
| Qatar | |||
| Saudi Arabia | |||
| United Arab Emirates | |||
| Rest of Middle East and Africa | |||
| North America | Canada | ||
| Mexico | |||
| United States | |||
| Rest of North America | |||
| South America | Brazil | ||
| Chile | |||
| Colombia | |||
| Rest of South America | |||
Sub Aircraft Type
| Fixed-Wing Aircraft | Multi-Role Aircraft |
| Training Aircraft | |
| Transport Aircraft | |
| Others | |
| Rotorcraft | Multi-Mission Helicopter |
| Transport Helicopter | |
| Others |
Region
| Asia-Pacific | Australia |
| China | |
| India | |
| Indonesia | |
| Japan | |
| Malaysia | |
| Philippines | |
| Singapore | |
| South Korea | |
| Thailand | |
| Rest of Asia-Pacific | |
| Europe | France |
| Germany | |
| Italy | |
| Netherlands | |
| Russia | |
| Spain | |
| Turkey | |
| UK | |
| Rest of Europe | |
| Middle East and Africa | Algeria |
| Egypt | |
| Qatar | |
| Saudi Arabia | |
| United Arab Emirates | |
| Rest of Middle East and Africa | |
| North America | Canada |
| Mexico | |
| United States | |
| Rest of North America | |
| South America | Brazil |
| Chile | |
| Colombia | |
| Rest of South America |
Need A Different Region or Segment?
Customize Now
Market Definition
- Aircraft Type - All the military aircraft and rotorcraft which are used for various applications are included in this study.
- Sub-Aircraft Type - For this study, sub-aircraft types such as fixed-wing aircraft and rotorcraft based on their application are considered.
- Body Type - Multi-Role Aircraft, Transport, Training Aircraft, Bombers, Reconnaissance Aircraft, Multi-Mission Helicopters, Transport Helicopters and various other aircraft and rotorcraft are considered in this study.
| Keyword | Definition |
|---|---|
| IATA | IATA stands for the International Air Transport Association, a trade organization composed of airlines around the world that has an influence over the commercial aspects of flight. |
| ICAO | ICAO stands for International Civil Aviation Organization, a specialized agency of the United Nations that supports aviation and navigation around the globe. |
| Air Operator Certificate (AOC) | A certificate granted by a National Aviation Authority permitting the conduct of commercial flying activities. |
| Certificate Of Airworthiness (CoA) | A Certificate Of Airworthiness (CoA) is issued for an aircraft by the civil aviation authority in the state in which the aircraft is registered. |
| Gross Domestic Product (GDP) | Gross domestic product (GDP) is a monetary measure of the market value of all the final goods and services produced in a specific time period by countries. |
| RPK (Revenue Passenger Kilometres) | The RPK of an airline is the sum of the products obtained by multiplying the number of revenue passengers carried on each flight stage by the stage distance - it is the total number of kilometers traveled by all revenue passengers. |
| Load Factor | The load factor is a metric used in the airline industry that measures the percentage of available seating capacity that has been filled with passengers. |
| Original Equipment Manufacturer (OEM) | An original equipment manufacturer (OEM) traditionally is defined as a company whose goods are used as components in the products of another company, which then sells the finished item to users. |
| International Transportation Safety Association (ITSA) | International Transportation Safety Association (ITSA) is an international network of heads of independent safety investigation authorities (SIA). |
| Available Seats Kilometre (ASK) | This metric is calculated by multiplying Available Seats (AS) in one flight, defined above, multiplied by the distance flown. |
| Gross Weight | The fully-loaded weight of an aircraft, also known as “takeoff weight,” which includes the combined weight of passengers, cargo, and fuel. |
| Airworthiness | The ability of an aircraft, or other airborne equipment or system, to operate in flight and on the ground without significant hazard to aircrew, ground crew, passengers or to other third parties. |
| Airworthiness Standards | Detailed and comprehensive design and safety criteria applicable to the category of aeronautical product (aircraft, engine or propeller). |
| Fixed Base Operator (FBO) | A business or organization that operates at an airport. An FBO provides aircraft operating services like maintenance, fueling, flight training, charter services, hangaring, and parking. |
| High Net worth Individuals (HNWIs) | High Net worth Individuals (HNWIs) are individuals with over USD 1 million in liquid financial assets. |
| Ultra High Net worth Individuals (UHNWIs) | Ultra High Net worth Individuals (UHNWIs) are individuals with over USD 30 million in liquid financial assets. |
| Federal Aviation Administration (FAA) | The division of the Department of Transportation is concerned with aviation. It operates Air Traffic Control and regulates everything from aircraft manufacturing to pilot training to airport operations in the United States. |
| EASA (European Aviation Safety Agency) | The European Aviation Safety Agency is a European Union agency established in 2002 with the task of overseeing civil aviation safety and regulation. |
| Airborne Warning and Control System (AW&C) aircraft | Airborne Warning and Control System (AEW&C) aircraft is equipped with a powerful radar and on-board command and control center to direct the armed forces. |
| The North Atlantic Treaty Organization (NATO) | The North Atlantic Treaty Organization (NATO), also called the North Atlantic Alliance, is an intergovernmental military alliance between 30 member states – 28 European and two North American. |
| Joint Strike Fighter (JSF) | Joint Strike Fighter (JSF) is a development and acquisition program intended to replace a wide range of existing fighter, strike, and ground attack aircraft for the United States, the United Kingdom, Italy, Canada, Australia, the Netherlands, Denmark, Norway, and formerly Turkey. |
| Light Combat Aircraft (LCA) | A light combat aircraft (LCA) is a light, multirole jet/turboprop military aircraft, commonly derived from advanced trainer designs, designed for engaging in light combat. |
| Stockholm International Peace Research Institute (SIPRI) | Stockholm International Peace Research Institute (SIPRI) is an international institute that provides data, analysis, and recommendations for armed conflict, military expenditure, and arms trade as well as disarmament and arms control. |
| Maritime Patrol Aircraft (MPA) | A maritime patrol aircraft (MPA), also known as maritime reconnaissance aircraft is a fixed-wing aircraft designed to operate for long durations over water in maritime patrol roles, in particular, anti-submarine warfare (ASW), anti-ship warfare (AShW), and search and rescue (SAR). |
| Mach Number | The Mach number is defined as the ratio of true airspeed to the speed of sound at the altitude of a given aircraft. |
| Stealth Aircraft | Stealth is a Common term applied to low observable (LO) technology and doctrine, that makes an aircraft near invisible to radar, infrared or visual detection. |
Need More Details on Market Definition?
Ask a Question
Research Methodology
Mordor Intelligence follows a four-step methodology in all our reports.
- Step-1: Identify Key Variables: In order to build a robust forecasting methodology, the variables and factors identified in Step-1 are tested against available historical market numbers. Through an iterative process, the variables required for market forecast are set and the model is built on the basis of these variables.
- Step-2: Build a Market Model: Market-size estimations for the historical and forecast years have been provided in revenue and volume terms. For sales conversion to volume, the average selling price (ASP) is kept constant throughout the forecast period for each country, and inflation is not a part of the pricing.
- Step-3: Validate and Finalize: In this important step, all market numbers, variables and analyst calls are validated through an extensive network of primary research experts from the market studied. The respondents are selected across levels and functions to generate a holistic picture of the market studied.
- Step-4: Research Outputs: Syndicated Reports, Custom Consulting Assignments, Databases & Subscription Platforms

Get More Details On Research Methodology
Download PDF


