Middle East Ready-to-Drink Tea Market Size and Share
Market Overview
| Study Period | 2021 - 2031 |
|---|---|
| Forecast Data Period | 2026 - 2031 |
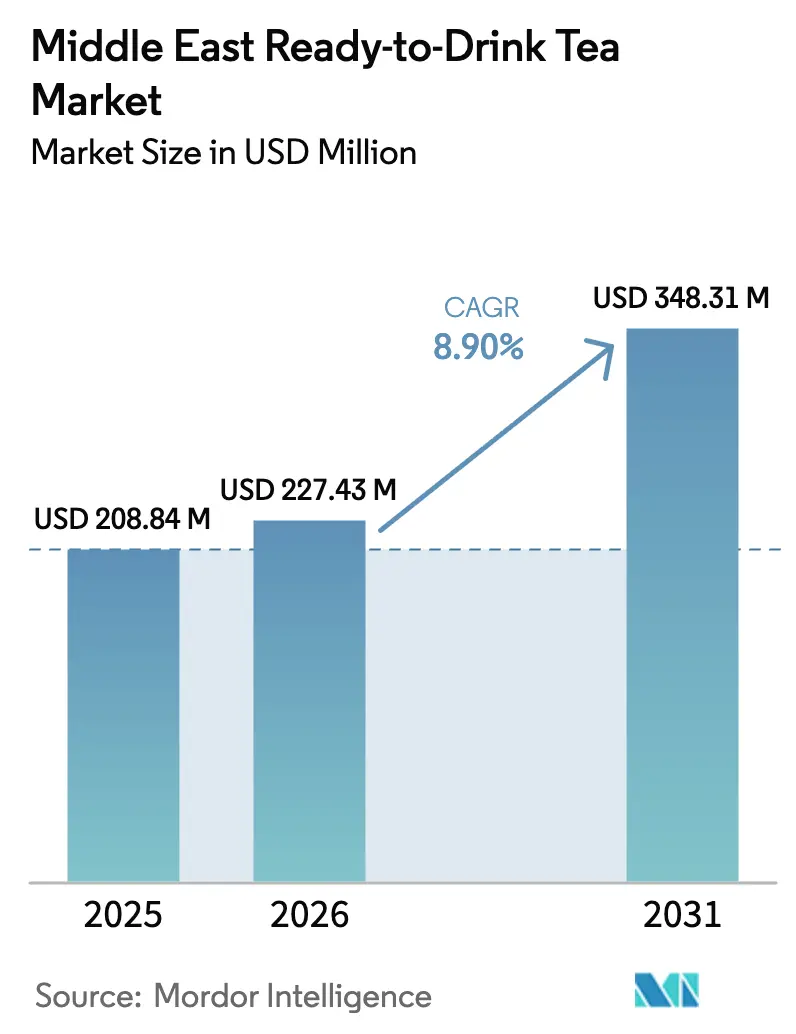
| Base Year Market Size (2025) | USD 208.84 Million |
| Market Size (2026) | USD 227.43 Million |
| Market Size (2031) | USD 348.31 Million |
| Growth Rate (2026 - 2031) | 8.90% CAGR |
| Market Concentration | Medium |
Major Players *Disclaimer: Major Players sorted in no particular order Image © Mordor Intelligence. Reuse requires attribution under CC BY 4.0. | |
Middle East Ready-to-Drink Tea Market Analysis by Mordor Intelligence
The Middle East ready-to-drink tea market size in 2026 is estimated at USD 227.43 million, growing from 2025 value of USD 208.84 million with 2031 projections showing USD 348.31 million, growing at 8.90% CAGR over 2026-2031. A clear shift away from carbonated soft drinks, intensified regulation of sugar-sweetened beverages, and a growing under-30 population that prioritizes health are driving demand. Saudi Arabia’s July 2025 caffeine-labeling mandate and the UAE’s June 2025 Nutri-Mark program reward reformulated low-sugar teas over legacy sodas. Freight volatility on Red Sea lanes, where the Shanghai Containerized Freight Index surged 170% between November 2023 and January 2024, continues to squeeze margins for import-reliant brands. Multinationals deepen localization to defend share while agile local firms leverage halal supply chains, functional ingredients, and digital commerce to capture white-space niches across the Middle East ready-to-drink tea market.
Key Report Takeaways
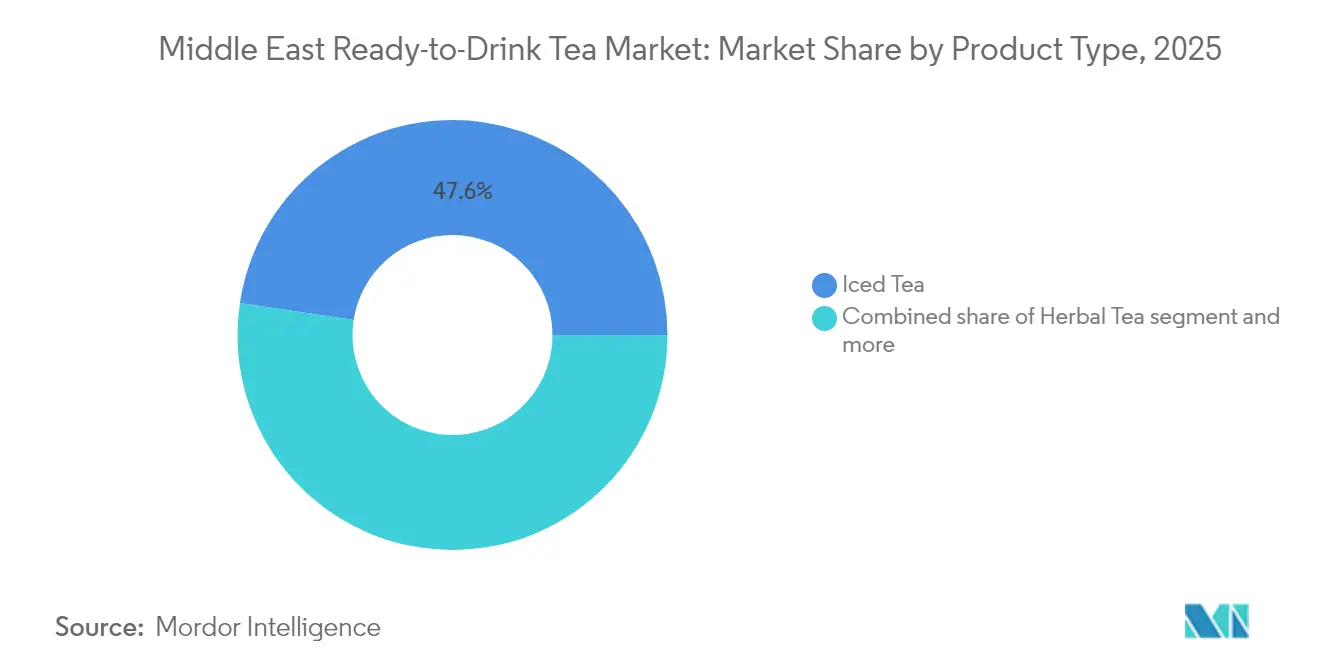
- By product type, iced tea led with a 47.62% volume share in 2025; herbal tea is expected to advance at an 10.89% CAGR to 2031.
- By packaging, PET bottles accounted for 56.89% revenue in 2025; aseptic cartons are rising at a 10.52% CAGR through 2031.
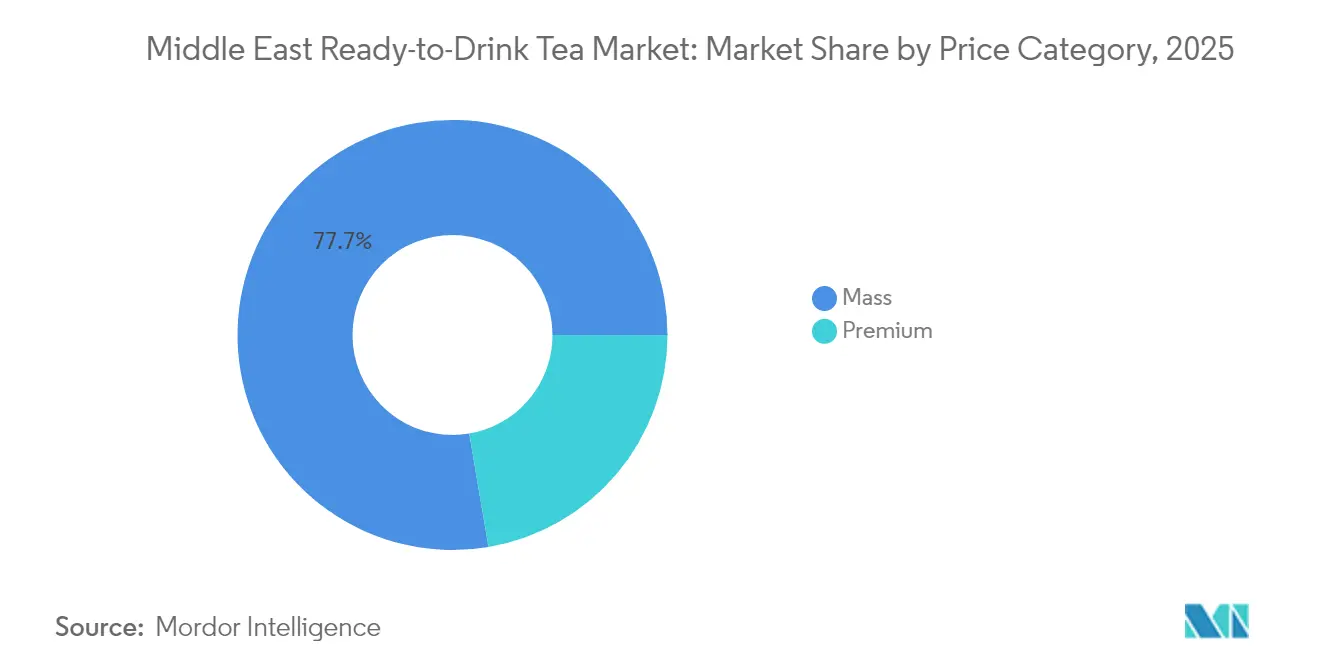
- By price tier, mass products held 77.68% of 2025 sales; premium SKUs post a 12.05% CAGR to 2031.
- By channel, off-trade accounted for 61.95% of the value in 2025; the on-trade is expected to expand at a 12.54% CAGR through 2031.
- By geography, Saudi Arabia captured 55.30% of the revenue in 2025; Qatar recorded the fastest 11.55% CAGR to 2031.
Note: Market size and forecast figures in this report are generated using Mordor Intelligence’s proprietary estimation framework, updated with the latest available data and insights as of 2026.
Middle East Ready-to-Drink Tea Market Trends and Insights
Drivers Impact Analysis*
| Driver | (~) % Impact on CAGR Forecast | Geographic Relevance | Impact Timeline |
|---|---|---|---|
| Convenient on-the-go tea for busy lifestyles | +1.8% | GCC, strongest in UAE and Saudi urban centers | Short term (≤ 2 years) |
| Premiumisation and functional positioning | +1.5% | UAE, Saudi Arabia, Qatar | Medium term (2-4 years) |
| Rising demand for flavored and specialty teas | +1.2% | Saudi Arabia, UAE, Kuwait, Bahrain | Medium term (2-4 years) |
| Influence of lifestyle trends and social media on tea choices | +1.0% | UAE, Saudi youth | Short term (≤ 2 years) |
| Functional teas with vitamins, probiotics, adaptogens | +1.3% | UAE wellness hubs, Saudi health cohorts | Long term (≥ 4 years) |
| Urban café culture driving RTD tea consumption | +1.4% | Dubai, Abu Dhabi, Riyadh, Doha | Medium term (2-4 years) |
| Source: Mordor Intelligence | |||


Convenient On-the-Go Tea for Busy Lifestyles
Morning commuters in Riyadh and Dubai increasingly grab single-serve RTD teas from petrol station coolers, with convenience outlets covering most of the UAE’s modern trade and over 40% in Saudi Arabia. Quick-commerce platforms deliver chilled bottles in under 30 minutes, shortening the decision-to-consumption window. Compliance with Saudi caffeine-disclosure rules enables brands to promote energy benefits without being classified as energy drinks, while small 200-milliliter aseptic cartons, such as Aujan’s, cater to handbags and school bags[1]Source: SIG, “CombiblocMini Launch,” sig.biz. These trends are driving impulse-led growth across the Middle East RTD tea market.
Premiumisation and Functional Positioning
Affluent consumers in Dubai Marina and Riyadh’s Diplomatic Quarter pay 30–50% more for teas with organic, single-origin, or functional claims. Startups like Nai Arabia offer 100% natural iced teas with hibiscus, pomegranate, and jasmine, while Seha Wellness delivers Ayurvedic blends across the GCC within three days. Lipton’s new lower-sugar powders aim to bridge premium and value tiers, and Almarai’s SAR 18 billion investment to expand aseptic capacity signals continued premiumization, collectively reinforcing the premium segment of the Middle East RTD tea market.
Rising Demand for Flavored and Specialty Teas
Peach, lemon, and berry once dominated RTD tea, but regional flavors like date, pomegranate, and saffron are gaining shelf space in Saudi hypermarkets. Traditional zhourat blends, rich in Rosa damascena and chamomile, provide antioxidant benefits supported by studies. Bubble-tea chains such as Tealive and Gong Cha have introduced Gen Z to exotic flavors like taro and lychee, raising expectations for retail SKUs. Lipton’s planned summer 2025 launches of fruit and herbal RTD teas could incorporate local notes like cardamom or rosewater, with specialty flavors helping to engage consumers and expand the Middle East RTD tea market.
Influence of Lifestyle Trends and Social Media on Tea Choices
Social media is a major driver of RTD tea consumption in the UAE and Egypt, with Instagram and TikTok shaping purchase decisions, particularly for premium and niche brands. Startups like Seha Wellness and Nai Arabia leverage direct-to-consumer e-commerce to bypass traditional retail, engage with communities, and capture higher margins. Meanwhile, Lipton’s March 2025 QR-code-enabled packaging connects offline products to online content, sustainability metrics, and brewing guides, collecting first-party consumer data. With smartphone penetration exceeding 90%, RTD brands must monitor trends in real-time to capitalize on fleeting ingredient hype cycles, such as matcha, butterfly pea, and kombucha, and PepsiCo’s April 2025 Riyadh headquarters expansion highlights the region’s focus on agile content creation and localized influencer networks to build brand equity.
Restraints Impact Analysis*
| Restraint | (~) % Impact on CAGR Forecast | Geographic Relevance | Impact Timeline |
|---|---|---|---|
| Strict regulatory frameworks on caffeine and stimulants | -0.8% | Saudi Arabia, UAE, Qatar | Short term (≤ 2 years) |
| Strong competition from traditional hot tea and coffee | -1.2% | GCC-wide, especially Saudi Arabia, UAE | Long term (≥ 4 years) |
| Dependence on imports increasing supply-chain costs | -0.9% | All GCC economies | Medium term (2-4 years) |
| Consumer skepticism toward “natural” claims after probes | -0.5% | UAE, Saudi affluent segments | Medium term (2-4 years) |
| Source: Mordor Intelligence | |||
Strict Regulatory Frameworks on Caffeine and Stimulant Content in GCC Countries
Saudi Arabia’s Food and Drug Authority requires the disclosure of caffeine content, high-sodium warnings, and physical activity icons on packaged beverages, effective July 1, 2025, which will increase compliance costs for RTD tea brands as they reformulate or redesign their packaging[2]Source: Saudi Food and Drug Authority, “Caffeine Labelling Regulation,” sfda.gov.sa. Abu Dhabi’s Sehhi program limits high-sugar beverages in schools and government facilities, reducing channels for mass-tier teas, while FASEH import clearance can take up to eight weeks without prior approvals. Halal audits further restrict flavors containing alcohol-based extracts. Although these regulations temper near-term growth, they encourage product reformulation across the Middle East RTD tea market.
Strong Competition from Traditional Hot Tea and Coffee
Traditional hot tea consumption remains deeply rooted in Saudi Arabia and the UAE, with Karak tea and Arabic coffee rituals central to social gatherings and Ramadan iftars, creating resistance to RTD alternatives. Dubai’s DMCC Tea Centre handled over 24,400 metric tonnes of loose-leaf tea in 2024, highlighting strong demand for brewed tea. Specialty coffee chains, now exceeding 11,000 locations regionally, also divert discretionary spending from bottled teas[3]Source: Zawya, “DMCC Tea Forum Highlights,” zawya.com. These cultural and habitual preferences limit the growth potential of the Middle East RTD tea market.
*Our forecasts treat driver/restraint impacts as directional, not additive. The impact forecasts reflect baseline growth, mix effects, and variable interactions.
Segment Analysis
By Product Type: Herbal Variants Outpace Iced Tea Incumbency
Iced tea accounted for 47.62% of the Middle East's RTD tea value in 2025, driven by decades of multinational investment in flavors such as lemon, peach, and unsweetened black tea, which is distributed widely through hypermarkets and petrol stations. Herbal tea, by contrast, is projected to grow at a 10.89% CAGR through 2031, fueled by its caffeine-free positioning and functional-ingredient narratives that appeal to wellness-focused consumers. Startups such as Seha Wellness, with Ayurvedic blends like Tranquili-Tea, Diges-Tea, and Immuni-Tea, and Nai Arabia, with Hibiscus Pomegranate Rose and Moroccan Mint iced teas, are carving niche segments by highlighting traditional Middle Eastern botanicals like zhourat, a blend of Rosa damascena, Matricaria chamomilla, and Aloysia citrodora, documented for antioxidant and antimicrobial benefits. Other RTD variants, including green, white, oolong, and matcha teas, collectively hold the remaining share, though ambient shelf stability and flavor preservation remain challenges for delicate varietals.
Global brands are also adapting to these trends. The Pepsi Lipton Partnership’s March 2024 US launch of Pure Leaf Zero Sugar Sweet Tea, sweetened with sucralose and acesulfame potassium, demonstrates strong consumer demand for zero-sugar beverages and provides a blueprint for Middle East SKUs navigating Saudi Arabia’s 42% sugar-sweetened beverage tax and the UAE’s Nutri-Mark labeling. Lipton’s May 2025 global rebrand, introducing lower- and zero-sugar iced tea powders under the “We Choose Tea” tagline, targets both hot and cold consumption occasions. Local players like Kinza Drinks, launched in 2022 by Al-Jameel International, are diversifying into hybrid formats such as pomegranate, berries, and Saudi cocktail carbonated beverages. While iced tea’s established distribution, brand recognition, and competitive pricing will sustain volume leadership, herbal tea’s rapid growth suggests it could capture 20–25% of the market by 2028–2029 if functional claims receive regulatory approval and supply-chain traceability is strengthened.


By Packaging Type: Aseptic Cartons Challenge PET Bottle Dominance
In 2025, PET bottles accounted for 56.89% of Middle East RTD tea packaging, favored for transparency, resealability, and compatibility with existing cold-chain infrastructure in hypermarkets and convenience stores. Aseptic cartons are projected to grow at a 10.52% CAGR through 2031, driven by their extended ambient shelf life (12–24 months), lower refrigeration costs, and sustainability narratives that highlight reduced carbon footprints. SIG’s November 2024 five-year partnership with Almarai, supported by a SAR 18 billion (USD 4.8 billion) investment, demonstrates regional commitment to aseptic technology, with cross-category applications for RTD tea. Alesayi Beverage Corporation’s 126,000-square-meter Jeddah mega-factory, featuring 22 high-speed production lines and SIG bag-in-box systems for HoReCa bulk dispensing, underscores the scale investments needed to compete across packaging formats.
Glass bottles and metal cans make up the remainder of the market, with glass positioned as a premium format and cans preferred for single-serve energy-drink-style RTD teas. Sustainability trends are gaining momentum, with Lamipak producing over 13 billion aseptic cartons globally in 2023, including bio-based and recyclable formats, aligning with UAE and Saudi Vision 2030 goals. Tetra Pak and Aujan are introducing innovative carton-based packaging for on-the-go consumption, demonstrating commercial viability and convenience. While PET’s scale, familiarity, and cost advantages will maintain its leadership, aseptic cartons’ ability to reduce cold-chain dependency and spoilage in remote GCC markets positions them to capture 25–30% of the segment by 2029–2030, provided brands invest in consumer education around recyclability and ambient storage benefits.
By Price Category: Premium Tier Gains Despite Mass Market Entrenchment
Mass-tier RTD tea dominated 77.68% of sales in 2025, driven by hypermarket private-label SKUs and multinational brands catering to price-conscious shoppers in Saudi Arabia through chains such as Lulu, Carrefour, and Panda. In contrast, premium RTD tea is expanding at a 12.05% CAGR through 2031, targeting affluent consumers in Dubai Marina, Abu Dhabi’s Saadiyat Island, and Riyadh’s Diplomatic Quarter who value organic certifications, single-origin sourcing, and functional ingredients over cost. Brands like Nai Arabia, offering 100% natural iced teas in flavors such as Hibiscus Pomegranate Rose, Peach Mango Jasmine, and Moroccan Mint, retail at 30–50% higher prices than mass-tier products but have secured distribution across GCC e-commerce platforms and specialty retailers. Seha Wellness’s Ayurvedic blends, priced at AED 40 (USD 11) per 75 grams with 2-3 day GCC shipping, highlight how functional benefits, stress relief, gut health, and immunity justify premium pricing when paired with heritage narratives.
Regional incumbents are also elevating RTD tea through strategic investments. Almarai’s SAR 18 billion plan through 2028, coupled with a five-year partnership with SIG for aseptic packaging expansion, demonstrates cross-category premiumization in dairy-adjacent beverages, informing RTD tea strategies. Lipton’s May 2025 global rebrand, introducing English Breakfast and Earl Grey blends alongside lower- and zero-sugar iced teas, positions the brand for premium-lite segments where health claims meet affordability. The region’s appetite for sophistication is reflected in Dubai Duty Free’s USD 310 million liquor sales, suggesting non-alcoholic premium RTD teas can attract flexi-drinkers aged 21-45 in hotels and lounges. While mass-tier products will maintain volume leadership due to entrenched distribution and cost advantages, premium RTD teas could capture 25-30% of value share by 2029-2030 if brands invest in consumer education, functional-ingredient storytelling, supply-chain transparency, and sustainability certifications that resonate with affluent Middle East consumers.
By Distribution Channel: HoReCa Outpaces Retail Despite Off-Trade Dominance
Off-trade channels, including supermarkets, hypermarkets, convenience stores, and online retail, accounted for 61.95% of Middle East RTD tea volume in 2025, reflecting decades of investment in modern retail distribution and cold-chain infrastructure. Supermarkets and hypermarkets dominate in the UAE and Saudi Arabia, with chains such as Lulu, Carrefour, and Panda featuring chilled RTD tea in end-aisle displays and checkout coolers. Convenience stores and petrol station kiosks cater to impulse purchases during peak traffic hours, particularly for single-serve PET bottles and metal cans, which are designed for on-the-go consumption. Online retail is expanding rapidly, with quick-commerce apps delivering chilled beverages within 30 minutes. Meanwhile, direct-to-consumer brands like Seha Wellness and Nai Arabia are leveraging e-commerce and social engagement to bypass traditional retail channels and capture higher margins.
On-trade (HoReCa) is growing at a 12.54% CAGR through 2031, driven by the UAE’s expanding foodservice sector, including Dubai’s specialty coffee outlets and Abu Dhabi’s fine dining segment. Alesayi Beverage Corporation’s Jeddah mega-factory has installed SIG bag-in-box aseptic systems (10-liter bags with SIG 2Pure Film) to serve HoReCa bulk dispensing, enabling cafés and restaurants to provide consistent RTD tea on tap without compromising shelf life. Digital B2B platforms also play a role, with Coca-Cola Europacific Partners reporting over EUR 2.3 billion in annual revenue from myCCEP.com across 13 markets, highlighting the potential for online ordering to boost volume in HoReCa and independent retail, though Middle East-specific penetration data remains undisclosed.
Geography Analysis
In 2025, Saudi Arabia dominated the Middle East RTD tea market with a 55.30% share, supported by major investments from multinational players. PepsiCo committed SAR 9 billion (approximately USD 2.4 billion) over eight years, while Nestlé pledged SAR 7 billion over the next decade. PepsiCo’s December 2024 launch of Sting energy drink and the April 2025 opening of an expanded Riyadh headquarters, featuring a SAR 30 million (USD 8 million) R&D center, highlight the company's deepening localization and product development efforts. Nestlé’s October 2024 groundbreaking of its first Saudi food factory, a USD 72 million facility with 15,000 tonnes annual capacity, signals potential expansion into RTD tea production. Regulatory developments, including mandatory caffeine disclosure, high-salt warnings, and physical activity icons effective July 2025, are raising compliance costs but also creating opportunities for health-focused, reformulated SKUs. Local innovations, such as Milaf Cola, a date-based soft drink launched by Thurath Al-Madina in December 2024 and distributed through the Lulu Group, illustrate the growing appeal of culturally resonant products, especially following a 7% sales decline of Western beverage brands in H1 2024.
The UAE, while smaller in market share, serves as the region’s hub for re-exports and innovation. Dubai’s DMCC Tea Centre handled over 24,400 metric tonnes of tea in 2024, and the country accounts for more than half of global tea re-exports, enabling just-in-time inventory strategies. The Nutri-Mark front-of-pack labeling system, launched in June 2025, grades products on sugar, sodium, and saturated fat, potentially affecting sweetened RTD tea appeal. A vibrant herbal tea ecosystem has emerged, with startups like Seha Wellness, Nai Arabia, MyPekoe, SAC Herbal, Al Malaky Royal, BRW Society, Sy’a Teas, and Balqees leveraging e-commerce and social media to bypass traditional retail. Innovative offerings such as Tania’s Teahouse’s Cordyceps Latte and Reishi-infused chocolates reflect growing consumer interest in adaptogens and functional ingredients, which could influence RTD tea development.
Other GCC markets show varied growth dynamics. Qatar is projected to record the fastest geographic CAGR at 11.55% through 2031, driven by hospitality expansion and tourism investments. Oman’s 31.7% excise tax on sugar-sweetened beverages incentivizes lower-sugar RTD tea formulations, while Bahrain imposes stringent regulatory requirements that favor established brands. Exports to Jordan, Egypt, and Iraq offer opportunities, though political instability and import complexities pose challenges. Saudi Arabia’s robust manufacturing base and the UAE’s re-export infrastructure position them as regional engines, while Qatar’s hospitality-driven growth and Omani tax-driven reformulation create targeted opportunities for premium and functional RTD tea SKUs.
Competitive Landscape
The Middle East RTD tea market is moderately consolidated, with global multinationals such as PepsiCo, Coca-Cola, Nestlé, and Keurig Dr Pepper competing alongside established regional players. Localized flavor innovation, halal-certified supply chains, and strong distribution networks largely drive competition. Recent consumer boycotts of Western brands across parts of the region have disrupted category dynamics, accelerating demand for culturally aligned, locally positioned alternatives and creating opportunities for regional and emerging brands to enter the market.
Leading players are aligning their strategies around three core pillars. Localization remains critical, supported by investments in regional R&D centers and manufacturing facilities to tailor products to local taste preferences. Premiumization is gaining traction through natural, wellness-oriented, and heritage-inspired RTD teas positioned at higher price points. In parallel, digital-first route-to-market strategies, including B2B ordering platforms and direct-to-consumer e-commerce, are improving market access, reducing distribution friction, and strengthening brand-consumer engagement.
Looking ahead, growth white spaces are evident in functional RTD teas with health, mood, or digestive benefits, as well as cost-efficient bulk-dispensing formats for the HoReCa channel. Technology adoption in aseptic and sustainable packaging, high-speed bottling, and digital traceability is enhancing efficiency and transparency. At the same time, evolving Saudi and UAE labeling regulations are raising compliance thresholds, favoring players with strong regulatory capabilities while also leveling the field by forcing reformulation and packaging upgrades. Smaller regional brands are increasingly capitalizing on these shifts by emphasizing local botanicals, halal credentials, and supply-chain transparency to differentiate from incumbents.
Middle East Ready-to-Drink Tea Industry Leaders
Keurig Dr Pepper, Inc.
PepsiCo, Inc.
The Coca-Cola Company
Nestlé S.A.
Rauch Fruchtsäfte GmbH & Co OG
- *Disclaimer: Major Players sorted in no particular order

Recent Industry Developments
- April 2025: PepsiCo opened an expanded Middle East headquarters in Riyadh and announced a SAR 30 million (USD 8 million) R&D center in Saudi Arabia, deepening localization capacity for beverage innovation tailored to GCC consumer preferences and regulatory requirements.
- February 2025: Coca-Cola's iPRO partnered with Saudi Arabia's Al Rabie to launch hydration beverages in the Kingdom, leveraging Al Rabie's established distribution network to compete in the functional beverage segment adjacent to RTD tea.
- November 2024: Almarai selected SIG as its strategic partner for a five-year aseptic packaging expansion aligned with the company's SAR 18 billion (USD 4.8 billion) investment plan through 2028, focusing on dairy, juices, and potential RTD tea SKUs.


Middle East Ready-to-Drink Tea Market Report Scope
Green Tea, Herbal Tea, Iced Tea are covered as segments by Soft Drink Type. Aseptic packages, Glass Bottles, Metal Can, PET Bottles are covered as segments by Packaging Type. Off-trade, On-trade are covered as segments by Distribution Channel. Qatar, Saudi Arabia, United Arab Emirates are covered as segments by Country.| Green Tea |
| Herbal Tea |
| Iced Tea |
| Other RTD Tea |
| Aseptic Packages |
| Glass Bottles |
| Metal Cans |
| PET Bottles |
| Mass |
| Premium |
| On-trade (HoReCa) | |
| Off-trade | Supermarkets/Hypermarkets |
| Convenience Stores | |
| Online Retail Stores | |
| Other Distribution Channel |
| Saudi Arabia |
| United Arab Emirates |
| Qatar |
| Kuwait |
| Oman |
| Bahrain |
| Rest of Middle East |
| By Product Type | Green Tea | |
| Herbal Tea | ||
| Iced Tea | ||
| Other RTD Tea | ||
| By Packaging Type | Aseptic Packages | |
| Glass Bottles | ||
| Metal Cans | ||
| PET Bottles | ||
| Price Category | Mass | |
| Premium | ||
| By Distribution Channel | On-trade (HoReCa) | |
| Off-trade | Supermarkets/Hypermarkets | |
| Convenience Stores | ||
| Online Retail Stores | ||
| Other Distribution Channel | ||
| By Country | Saudi Arabia | |
| United Arab Emirates | ||
| Qatar | ||
| Kuwait | ||
| Oman | ||
| Bahrain | ||
| Rest of Middle East | ||


Market Definition
- Carbonated Soft Drinks (CSDs) - Carbonated soft drinks (CSDs) refer to non-alcoholic beverages that are carbonated and typically flavored, containing dissolved carbon dioxide to create effervescence. These beverages commonly include cola, lemon-lime, orange, and various fruit-flavored sodas. Marketed in cans, bottles, or fountain dispense.
- Juices - We have considered packaged juices which encompass non-alcoholic beverages derived from fruits, vegetables, or a combination thereof, processed and sealed in various packaging formats such as bottles, cartons, or pouches. Excluding fresh juices, this market segment involves commercially prepared and preserved juices, often with added preservatives and flavors.
- Ready-to-Drink (RTD) Tea and RTD Coffee - Ready-to-Drink (RTD) tea and RTD coffee are pre-packaged, non-alcoholic beverages that are brewed and prepared for consumption without further dilution. RTD tea typically includes various tea varieties, infused with flavors and sweeteners, and comes in bottles, cans, or cartons. Similarly, RTD coffee involves pre-brewed coffee formulations, often mixed with milk, sugar, or flavorings, and is conveniently packaged for on-the-go consumption.
- Energy Drinks - Energy drinks are non-alcoholic beverages formulated to provide a quick boost of energy and alertness. Whereas, sports drinks are beverages designed to hydrate and replenish electrolytes, particularly after physical exertion, exercise, or intense activity
| Keyword | Definition |
|---|---|
| Carbonated Soft Drinks | Carbonated soft drinks (CSDs) are a combination of carbonated water and flavouring, sweetened by sugar or a non-sugar sweeteners. |
| Standard Cola | Standard Cola is defined as the original flavor of cola soda. |
| Diet Cola | A cola-based soft drink containing no or low amounts of sugar |
| Fruit Flavored Carbonates | A carbonated beverage prepared from fruit juice/fruit flavor with carbonated water and containing sugar, dextrose, invert sugar or liquid glucose either singly or in combination. It may contain peel oil and fruit essences. |
| Juice | Juice is a drink made from the extraction or pressing of the natural liquid contained in fruit and vegetables. |
| 100% Juice | Fruit/vegetable juice made from fruit in the form of its juice with no water added to make up the volume. It is not permitted to add sugars, sweeteners, preservatives, flavourings or colourings to fruit juice. |
| Juice Drinks (up to 24% Juice) | Fruit/vegetable juice drinks with up to 24% fruits/vegetable extract. |
| Nectars (25-99% Juice) | Juices that can have between 25 and 99% of fruit, with the minimum legal limits defined depending on the type of fruit |
| Juice concentrates | Juice Concentrates are those form of juices when most of this liquid is removed resulting in a thick, syrupy product known as juice concentrate. |
| RTD Coffee | Packaged coffee beverages that are sold in a prepared form and are ready for consumption at the time of purchase. |
| Iced Coffee | An iced coffee is a cold version of coffee, usually a combination of hot espresso and milk with ice added to it. |
| Cold Brew Coffee | Cold brew also called cold water extraction or cold pressing is made by steeping ground coffee in room-temperature water for several hours. |
| RTD Tea | Ready-to-drink (RTD) tea is a packaged tea product ready for immediate consumption without brewing or preparation |
| Iced Tea | Ice tea or iced tea is a drink made from tea without milk but with sugar and sometimes fruit flavourings, drunk cold. |
| Green Tea | Green tea is a tea beverage which promotes mental alertness, relieving digestive symptoms and promoting weight loss. |
| Herbal Tea | Herbal tea beverages are made from the infusion or decoction of herbs, spices, or other plant material in hot water. |
| Energy Drink | A type of drink containing stimulant compounds, usually caffeine, which is marketed as providing mental and physical stimulation. They may or may not be carbonated and may also contain sugar, other sweeteners, or herbal extracts, among numerous possible ingredients. |
| Sugar-free or Low-calories Energy Drinks | Sugar-free or Low-calories Energy Drinks are sugar-free, artificially sweetened energy drinks with few or no calories. |
| Traditional Energy Drink | Traditional Energy Drinks are functional soft drinks containing ingredients designed to boost the consumer's energy. |
| Natural/Oraganic Energy Drinks | Natural/Organic energy drinks are energy drinks free of artificial sweeteners and synthetic colorings. Instead, they contain naturally derived ingredients such as green tea, yerba mate, and botanical extracts. |
| Energy Shots | A small but highly concentrated energy drink that contains large amounts of caffeine and/or other stimulants. The quantity is comparatively smaller compared to energy drinks. |
| Sports Drink | Sports drinks are beverages designed specifically for the rapid supply of fluid, carbohydrates, and electrolytes before, during or after exercise. |
| Isotonic | Isotonic drinks contain similar concentrations of salt and sugar as in the human body, and are designed to quickly replace fluids lost during exercise but with an increase of carbohydrate. |
| Hypertonic | Hypertonic drinks have a higher concentration of salt and sugar than the human body. They are best drunk after exercise as it is important to replace glycogen levels quickly after exercise. |
| Hypotonic | Hypotonic drinks are designed to quickly replace fluids lost during exercise. They have very low carbohydrate content and a lower concentration of salt and sugar than the human body. |
| Electrolyte-Enhanced Water | Electrolyte water is water infused with electrically-charged minerals, such as sodium, potassium, calcium, and magnesium. |
| Protein-based Sport Drinks | Protein-based sports drinks are those sports drinks which has added protein in it that will improve performance and reduce muscle protein breakdown. |
| On-Trade | The on-trade refers to places that sell beverages for immediate consumption on the premises like bars, restaurants, and pubs |
| Off-Trade | Off-trade usually means places like liquor stores, supermarkets and other places where you don't consume the beverage right away. |
| Convenience Store | A retail business that provides the public with a convenient location to quickly purchase a wide variety of consumable products and services, generally food and gasoline. |
| Specialty store | A specialty store is a shop/store that carries a deep assortment of brands, styles, or models within a relatively narrow category of goods |
| Online Retail | Online retail is a type of eCommerce whereby a business sells goods or services directly to consumers from a website. |
| Aseptic Packaging | Aseptic packaging refers to the filling of a cold, commercially sterile product under sterile conditions into a presterilized container and closure under sterile conditions to form a seal that effectively excludes microorganisms. These includes tetra packs, cartons, pouches etc. |
| PET Bottle | PET bottle means a bottle made of polyethylene terephthalate. |
| Metal Cans | Metal containers made of aluminum or tin- plated or zinc-plated steel, which are commonly used for packaging food, beverages or other products. |
| Disposable Cups | Disposable Cup means a cup or other container designed for single use to serve beverages, such as water, cold drinks, hot drinks and alcoholic beverages. |
| Gen Z | A way of referring to the group of people who were born in the late 1990s and early 2000s. |
| Millenial | Anyone born between 1981 and 1996 (ages 23 to 38 in 2019) is considered a Millennial |
| Taurine | Taurine is an amino acid that supports immune health and nervous system function. |
| Bars & Pubs | It is a drinking establishment licensed to serve alcoholic drinks for consumption on the premises. |
| Café | It is a foodservice establishment serving refreshments (mainly coffee) and light meals. |
| On the go | It means doing / dealing with while busily engaged with something and not diverting plans in order to accommodate. |
| Internet Penetration | The Internet Penetration Rate corresponds to the percentage of the total population of a given country or region that uses the Internet. |
| Vending Machine | A machine that dispenses small articles such as food, drinks, or cigarettes when a coin or token is inserted |
| Discount store | A discount store or discounter offers a retail format in which products are sold at prices that are in principle lower than an actual or supposed "full retail price". Discounters rely on bulk purchasing and efficient distribution to keep down costs. |
| Clean Label | Clean label on the beverage market are drinks that are made from few ingredients of natural origin and are not or only slightly processed. |
| Caffeine | An alkaloid compound which is a stimulant of the central nervous system. It is mainly used recreationally, as a mild cognitive enhancer to increase alertness and attentional performance. |
| Extreme sport | Action sports, adventure sports or extreme sports are activities perceived as involving a high degree of risk. |
| High-intensity interval training | It incorporates several rounds that alternate between several minutes of high intensity movements to significantly increase the heart rate to at least 80% of one's maximum heart rate, followed by short periods of lower intensity movements. |
| Shelf life | The length of time for which an item remains usable, fit for consumption, or saleable. |
| Cream Soda | Cream soda is a sweet soft drink. Generally flavored with vanilla and based on the taste of an ice cream float |
| Root Beer | Root beer is a sweet North American soft drink traditionally made using the root bark of the sassafras tree Sassafras albidum or the vine of Smilax ornata as the primary flavor. Root beer is typically, but not exclusively, non-alcoholic, caffeine-free, sweet, and carbonated. |
| Vanilla Soda | A carbonated soft drink flavoured with vanilla. |
| Dairy-Free | A product that does not contain any milk or milk products from cows, sheep or goats. |
| Caffeine-Free Energy Drinks | Caffeine-free energy drinks rely on other ingredients to boost the energy. Popular choices include amino acids, B vitamins, and electrolytes. |


Research Methodology
Mordor Intelligence follows a four-step methodology in all our reports.
- Step-1: IDENTIFY KEY VARIABLES: In order to build a robust forecasting methodology, the variables and factors identified in Step 1 are tested against available historical market numbers. Through an iterative process, the variables required for market forecast are set, and the model is built on the basis of these variables.
- Step-2: Build a Market Model: Market-size estimations for the forecast years are in nominal terms. Inflation is not a part of the pricing, and the average selling price (ASP) is kept constant throughout the forecast period for each country.
- Step-3: Validate and Finalize: In this important step, all market numbers, variables, and analyst calls are validated through an extensive network of primary research experts from the market studied. The respondents are selected across levels and functions to generate a holistic picture of the market studied.
- Step-4: Research Outputs: Syndicated reports, custom consulting assignments, databases & subscription platforms


