Market Overview
| Study Period | 2021 - 2031 |
|---|---|
| Forecast Data Period | 2026 - 2031 |
| Historical Data Period | 2021 - 2024 |
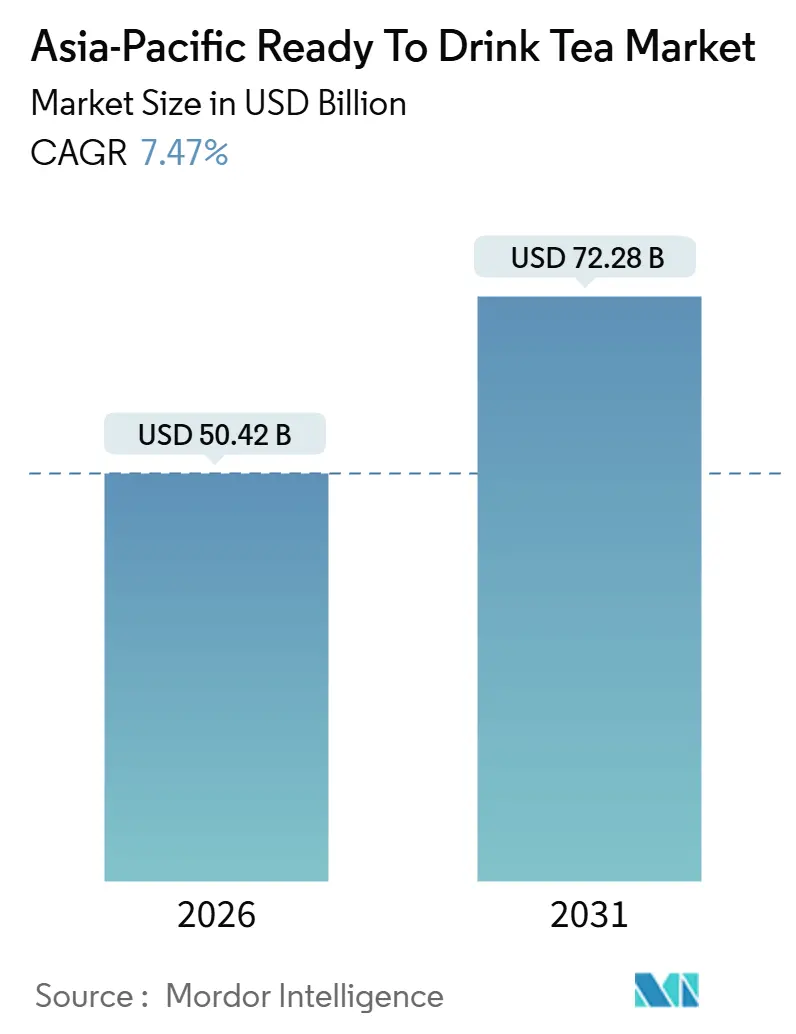
| Market Size (2026) | USD 50.42 Billion |
| Market Size (2031) | USD 72.28 Billion |
| Growth Rate (2026 - 2031) | 7.47% CAGR |
| Market Concentration | Medium |
Major Players *Disclaimer: Major Players sorted in no particular order Image © Mordor Intelligence. Reuse requires attribution under CC BY 4.0. | |
Asia-Pacific Ready To Drink Tea Market Analysis by Mordor Intelligence
The Asia-Pacific ready-to-drink tea market was valued at USD 50.42 billion in 2026 and is projected to reach USD 72.28 billion by 2031, growing at a CAGR of 7.47%. This growth reflects a significant shift toward healthier, low-sugar beverage options, as younger consumers increasingly prefer functional, herbal, and sugar-free teas over carbonated drinks and traditional juices. While iced tea continues to account for the largest volumes, premium herbal formulations, glass packaging, and sugar-free recipes are gaining market share in modern retail and e-commerce channels. Companies with vertically integrated estates or proprietary water sources are maintaining margins, while government-mandated nutrition labels and tiered sugar taxes are driving reformulation efforts across the industry. Additionally, technology-driven vending solutions, returnable glass packaging initiatives, and blockchain-based traceability are becoming integral to competitive strategies, indicating a trend toward further premiumization in the Asia-Pacific ready-to-drink tea market.
Key Report Takeaways
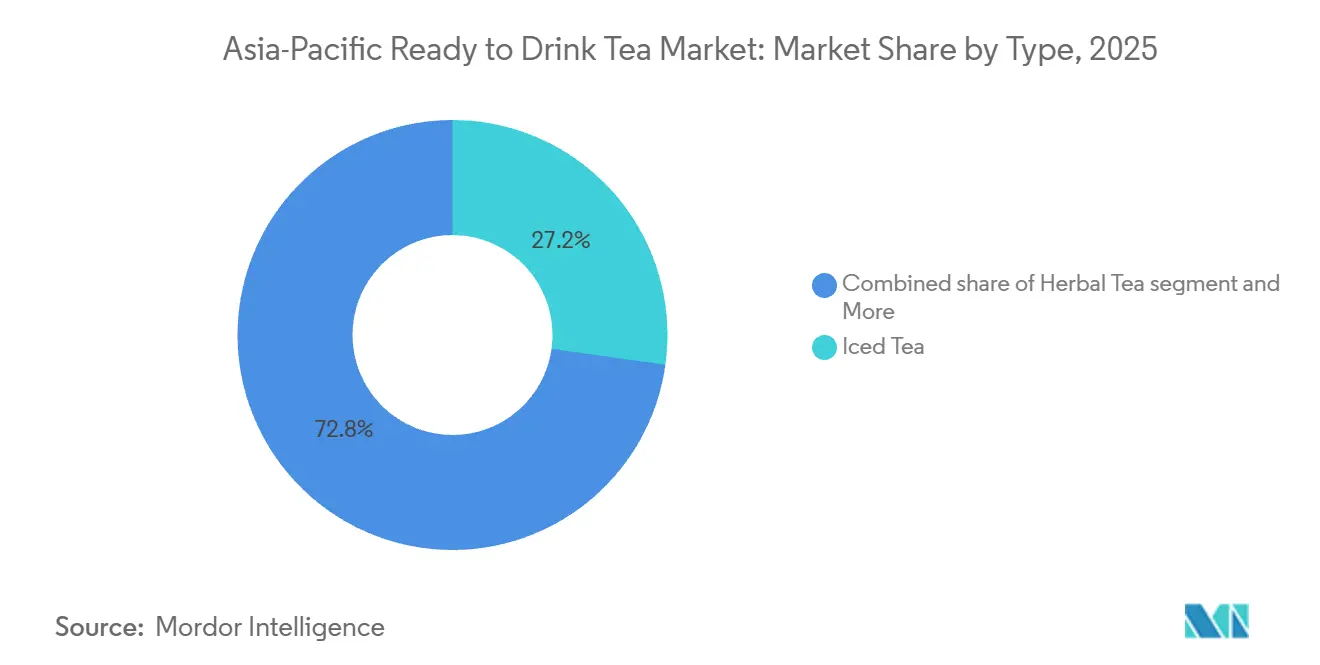
- By product type, iced tea led with a 27.21% share of the Asia-Pacific ready to drink tea market in 2025, whereas herbal tea is forecast to expand at an 8.63% CAGR through 2031.
- By packaging, PET bottles held 72.32% of the Asia-Pacific ready to drink tea market share in 2025, while glass bottles are set to grow at an 8.21% CAGR to 2031.
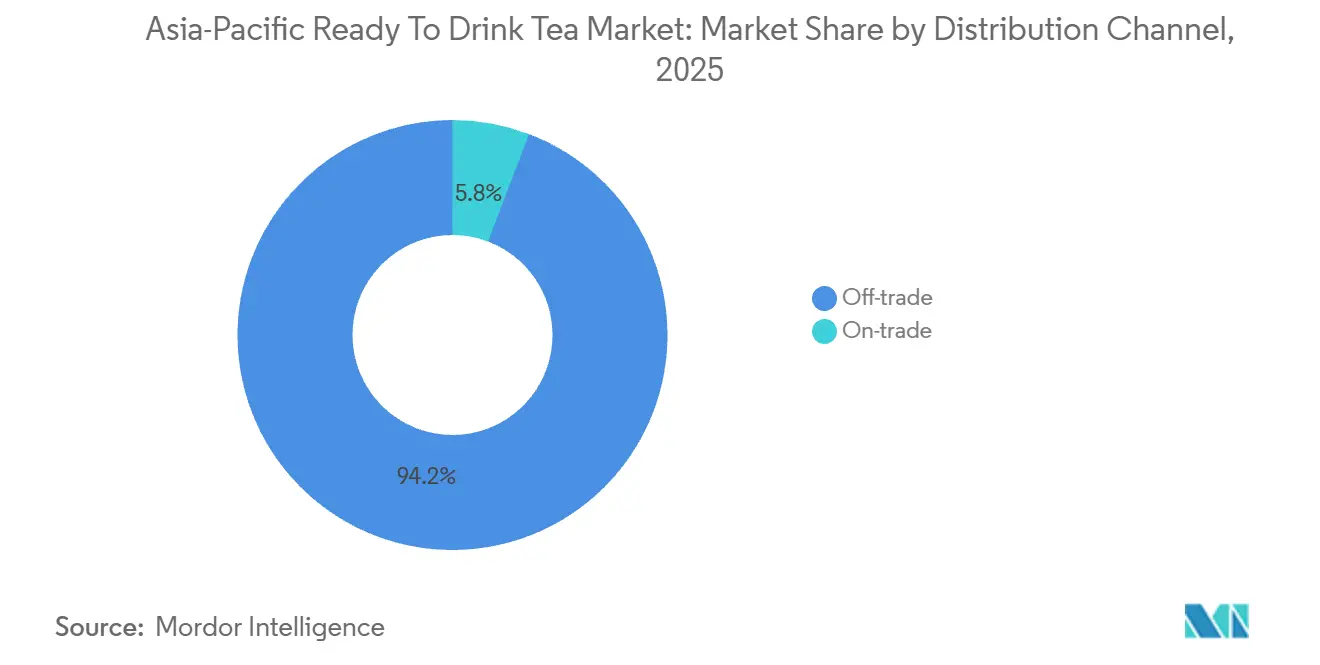
- By distribution channel, off-trade accounted for 94.21% of 2025 sales; on-trade outlets are projected to log the fastest 9.32% CAGR over 2026-2031.
- By geography, China commanded 41.32% of 2025 revenue, whereas India is expected to post a 10.04% CAGR to 2031.
Note: Market size and forecast figures in this report are generated using Mordor Intelligence’s proprietary estimation framework, updated with the latest available data and insights as of January 2026.
Asia-Pacific Ready To Drink Tea Market Trends and Insights
Drivers Impact Analysis*
| Driver | (~) % Impact on CAGR Forecast | Geographic Relevance | Impact Timeline |
|---|---|---|---|
| Growth in herbal tea variants offering calming and digestive benefits | +1.2% | Global, with concentration in China, Japan, South Korea | Medium term (2-4 years) |
| Convenience store and vending machine proliferation enhances accessibility | +1.5% | Japan, South Korea, Thailand, Singapore | Short term (≤ 2 years) |
| Demand for low-sugar and sugar-free options amid wellness trends | +1.8% | China, India, Singapore, Australia | Short term (≤ 2 years) |
| Functional additions like vitamins and probiotics for added health appeal | +0.9% | Urban centers across China, India, Japan, South Korea | Medium term (2-4 years) |
| Premiumization with organic and natural ingredients targeting discerning buyers | +1.1% | China, Japan, Australia, Singapore | Long term (≥ 4 years) |
| Rising fitness participation favoring low-calorie, natural refreshments | +0.7% | India, China, Thailand, Indonesia | Medium term (2-4 years) |
| Source: Mordor Intelligence | |||


Growth in herbal tea variants offering calming and digestive benefits
Herbal tea consumption is growing rapidly, surpassing traditional black and green tea categories as consumers increasingly seek functional benefits beyond hydration. Blends infused with chamomile, ginger, peppermint, and turmeric are gaining prominence in supermarkets and specialty retailers, supported by clinical evidence linking polyphenols and bioactive compounds to benefits such as stress reduction, improved gut health, and immune system support. In 2025, Nongfu Spring expanded its "Oriental Leaf" line to include herbal variants featuring tangerine peel and white tea formulations, appealing to health-conscious millennials and Generation Z consumers. Similarly, Japan's Ito En established research partnerships with universities to validate the antioxidant properties of its matcha-based ready-to-drink products, positioning the brand as a science-supported wellness solution rather than a standard beverage. The shift toward herbal formulations also highlights supply chain diversification, as manufacturers aim to reduce dependence on Camellia sinensis cultivation, which is concentrated in India, China, and Sri Lanka and faces challenges such as climate volatility and geopolitical trade barriers [1]Source: International Institute for Sustainable Development, “Tea Prices And Sustainability,” iisd.org.
Convenience store and vending machine proliferation enhances accessibility
Japan's vending machine density, with approximately one unit per 23 residents, offers significant point-of-sale opportunities for ready-to-drink tea. Companies such as Suntory and Asahi are leveraging Internet of Things (IoT)-enabled vending machines to provide personalized recommendations based on purchase history and weather conditions. In South Korea, convenience store chains like GS25 and CU expanded their private-label tea offerings in 2025, improving profit margins while targeting impulse purchases by commuters and students. In Thailand, the 7-Eleven network, operated by Charoen Pokphand Group, introduced ambient and chilled tea sections in 2024, increasing category facings by 30% and driving additional sales through promotional collaborations with local tea brands such as Oishi. In Singapore, the implementation of Nutri-Grade labeling in December 2023 mandated front-of-pack health ratings for beverages. This regulation unexpectedly increased the visibility of low-sugar tea variants, which received favorable grades and gained prominent shelf placement in convenience stores. Furthermore, vending machine operators are adopting cashless payment systems and mobile application-based loyalty programs, reducing transaction barriers while collecting detailed consumer data. This data is being used to optimize product assortments and implement dynamic pricing strategies. According to the National Association of Convenience Stores, sales in Japan reached a record high of 11,795.3 billion yen on an all-store basis in 2024 [2]Source: National Association of Convenience Stores, “Japanese C-Stores Continue to See Growth” convenience.org.
Demand for low-sugar and sugar-free options amid wellness trends
Sugar-free and low-sugar tea formulations represented a growing share of new product launches in 2025, driven by stricter sugar taxation and labeling regulations across Asia-Pacific. Singapore's Nutri-Grade framework, which assigns beverages a letter grade from A to D based on sugar and saturated fat content, encouraged reformulation by imposing advertising restrictions and higher excise duties on high-sugar products. Nongfu Spring's sugar-free "Oriental Leaf" line generated RMB 10.1 billion in revenue during the first half of 2025, highlighting that taste innovation using natural sweeteners like stevia and monk fruit can maintain consumer acceptance without compromising profit margins. In Thailand, the implementation of a tiered sugar tax in 2024, which increased levies on beverages containing more than 6 grams of sugar per 100 milliliters, led companies such as Oishi Group and Thai Beverages to introduce zero-sugar green tea and jasmine tea variants aimed at health-conscious urban consumers. Meanwhile, India's Food Safety and Standards Authority issued draft guidelines in 2025 proposing front-of-pack warning labels for high-sugar beverages, indicating a regulatory trend similar to Southeast Asia that is expected to accelerate reformulation efforts among both multinational and domestic brands.
Functional additions like vitamins and probiotics for added health appeal
Probiotic-enriched and vitamin-fortified ready-to-drink tea products are gaining popularity as manufacturers strive to stand out in a competitive market. In 2025, Kirin Holdings launched a lactobacillus-infused green tea in Japan under its health science division. The product, supported by clinical trials demonstrating benefits to the gut microbiome, commanded a 20% price premium over conventional alternatives. Additionally, PepsiCo announced in March 2024 an investment of USD 400 million in two new manufacturing plants in Vietnam, which included dedicated production lines for functional beverages. This move positions the company to meet Southeast Asian demand for immunity-boosting and energy-enhancing tea formulations. Regulatory frameworks for functional ingredient claims remain inconsistent across regions. Japan's Consumer Affairs Agency requires substantiation through peer-reviewed studies, while India's Food Safety and Standards Authority mandates third-party certification for probiotic viability and shelf-life stability. These compliance requirements favor established players with in-house research and development capabilities and strong relationships with certification bodies, creating significant barriers to entry for smaller regional competitors.
Restraints Impact Analysis*
| Restraint | (~)% Impact on CAGR Forecast | Geographic Relevance | Impact Timeline |
|---|---|---|---|
| Strict sugar content regulations require costly reformulations | -0.8% | Singapore, Thailand, Malaysia, Philippines | Short term (≤ 2 years) |
| Geopolitical tensions delay ingredient imports like specialty teas | -0.6% | China-India trade corridor, Taiwan Strait region | Medium term (2-4 years) |
| Taste preservation challenges in low-sugar variants | -0.4% | Global, with acute impact in price-sensitive markets | Short term (≤ 2 years) |
| Regulatory hurdles for functional ingredient claims | -0.3% | Japan, India, Australia, South Korea | Medium term (2-4 years) |
| Source: Mordor Intelligence | |||
Strict sugar content regulations require costly reformulations
Singapore's Nutri-Grade labeling system, introduced in December 2023, requires front-of-pack health ratings and restricts advertising for beverages rated below grade B. This regulation compels manufacturers to either reformulate their product portfolios or face reduced market access. The costs of reformulation include ingredient substitution, taste testing, production line modifications, and regulatory filing fees, which can exceed USD 500,000 per stock-keeping unit for multinational brands operating across multiple markets. Thailand's tiered sugar tax, implemented in 2024, imposes a levy of 1 baht per liter on beverages containing 6% to 8% sugar per 100 milliliters, escalating to 5 baht per liter for those with more than 14% sugar. This tax has reduced gross margins for volume-driven brands that traditionally relied on high sweetness levels to mask lower tea quality. Meanwhile, Malaysia and the Philippines are considering similar regulatory frameworks, creating uncertainty that delays capital allocation decisions and forces companies to maintain dual inventories for compliant and non-compliant markets. Smaller regional players, lacking the research and development budgets and technical expertise to adapt to these changes, face the risk of losing market share to larger, well-capitalized competitors.
Geopolitical tensions delay ingredient imports like specialty teas
China-India trade tensions, intensified by border disputes and reciprocal tariff increases, disrupted the cross-border flow of specialty tea leaves and botanical extracts during 2024 and 2025. India's implementation of anti-dumping duties on Chinese tea imports, along with China's retaliatory tariffs on Indian agricultural products, compelled multinational brands to diversify their sourcing to countries such as Sri Lanka, Vietnam, and Kenya. This shift resulted in higher procurement costs and increased logistical complexities. Additionally, tensions in the Taiwan Strait introduced supply chain risks for companies dependent on Taiwanese tea cultivars and processing technologies, leading to contingency planning and the creation of inventory buffers, which tied up working capital. In April 2025, the United States adjusted tariffs, imposing an additional 125% duty on Chinese tea imports and a 10% duty on shipments from India, Sri Lanka, and Japan. These changes disrupted Asia-Pacific supply chains as exporters redirected volumes to regional markets. This temporary redirection depressed prices but also introduced quality assurance challenges, as lower-grade lots entered premium channels. Furthermore, climate volatility in Sri Lanka and India, including droughts and unseasonal rainfall, reduced yields by 5% to 14% in 2024. This tightening of global supply elevated auction prices, squeezing margins for ready-to-drink tea manufacturers operating with narrow cost structures.
*Our forecasts treat driver/restraint impacts as directional, not additive. The impact forecasts reflect baseline growth, mix effects, and variable interactions.
Segment Analysis
By Type: Herbal Tea Outpaces Traditional Categories
Iced tea accounted for 27.21% of the market share in 2025, supported by established brands such as Lipton, Nestea, and regional options like Oishi's green tea variants. These brands benefit from long-standing consumer familiarity and extensive distribution networks, including supermarkets, convenience stores, and vending machines. In contrast, herbal tea is projected to grow at a compound annual growth rate (CAGR) of 8.63% through 2031. This growth is driven by its functional positioning, emphasizing benefits such as stress relief, digestive health, and immunity support, which appeal to wellness-focused consumers. Nongfu Spring's launch of tangerine peel white tea in 2025 highlighted the premiumization trend by combining traditional Chinese medicine ingredients with modern packaging, gaining rapid traction among urban millennials.
Green tea continues to experience steady demand in Japan and South Korea, where cultural preferences and perceived health benefits contribute to per-capita consumption rates that surpass regional averages. Meanwhile, the "Others" category, which includes oolong, white, and specialty blends, caters to niche consumer segments willing to pay premium prices for artisanal quality and single-origin products.


By Packaging Type: Glass Bottles Signal Premium Positioning
Polyethylene terephthalate (PET) bottles accounted for 72.32% of the volume in 2025, primarily due to their lightweight nature, shatter resistance, and cost efficiency, making them suitable for high-volume distribution channels such as supermarkets and convenience stores. Glass bottles, however, are projected to grow at a compound annual growth rate (CAGR) of 8.21% through 2031. This growth is driven by premiumization strategies that capitalize on glass's recyclability, inert properties, and perceived product purity, enabling price premiums of 15% to 25% over PET equivalents.
Aseptic packaging, which extends shelf life without refrigeration, is particularly relevant in rural and semi-urban markets in countries like India, Indonesia, and Thailand, where cold-chain infrastructure is limited. Meanwhile, metal cans are favored for on-the-go consumption and outdoor activities due to their durability and rapid chilling capabilities. Additionally, sustainability mandates in countries such as Japan, South Korea, and Australia are promoting the adoption of returnable glass bottle systems and deposit-refund schemes. These initiatives aim to reduce single-use plastic waste and align with corporate environmental, social, and governance (ESG) commitments.
By Distribution Channel: On-Trade Recovery Accelerates
Off-trade channels accounted for 94.21% of sales in 2025, encompassing supermarkets, hypermarkets, convenience stores, online retail, and specialist retailers. These channels offer broad geographic reach, promotional flexibility, and opportunities for impulse purchases, contributing to substantial volume throughput. Convenience stores, particularly in countries like Japan, South Korea, and Thailand, play a significant role in daily consumption. Private-label tea products in these stores generate higher margins and promote retailer loyalty. Online retail saw considerable growth during the pandemic and sustained this momentum in 2024 and 2025. E-commerce platforms such as Alibaba's Tmall, JD.com, and Amazon India provided subscription models, bulk discounts, and personalized recommendations, enhancing customer lifetime value. Specialist retailers, including organic food stores and tea boutiques, cater to affluent consumers seeking curated selections and expert advice. However, their market share remains limited due to a smaller geographic footprint. According to the International Trade Administration, China’s e-commerce market is projected to grow at a compound annual growth rate (CAGR) of over 9% from 2024 to 2028 [3]Source: International Trade Administration, “eCommerce,” trade.gov.
On-trade outlets, including cafes, restaurants, hotels, and bars, are recovering at a compound annual growth rate of 9.32% through 2031. This growth is driven by the normalization of mobility post-pandemic and the revival of experiential consumption in urban areas. In 2025, Starbucks and local cafe chains in China, Japan, and South Korea expanded their ready-to-drink tea offerings. These companies leveraged their brand equity and premium pricing to attract health-conscious consumers seeking alternatives to coffee, thereby capturing additional revenue opportunities.
Geography Analysis
China held 41.32% of the regional market share in 2025, supported by Nongfu Spring's leadership in the sugar-free segment. Its "Oriental Leaf" brand generated RMB 10.1 billion (USD 1.4 billion) in revenue during the first half of 2025, surpassing bottled water and making tea the company's largest revenue contributor. Domestic competitors such as Tingyi, Uni-President Enterprises, and Wahaha benefit from extensive distribution networks and competitive pricing. However, they face margin pressures as consumers increasingly opt for premium offerings that focus on organic sourcing, functional ingredients, and transparent supply chains. China's organic tea retail segment grew at a compound annual growth rate (CAGR) of 13% from 2016 to 2021, driven by rising disposable incomes and growing awareness of pesticide residues. This has created opportunities for brands investing in certification and traceability.
India is expected to grow at a CAGR of 10.04% through 2031, making it the fastest-growing market in the region. This growth is attributed to rising middle-class incomes, urbanization, and government initiatives promoting food safety under the Food Safety and Standards Authority of India (FSSAI). Tata Consumer Products leads the market with vertically integrated tea estates that help mitigate commodity price fluctuations, while Hindustan Unilever's Lipton brand captures significant mass-market volumes through supermarket and kirana store distribution. The acquisition of a 40% stake in Coca-Cola India Bottling by Jubilant Bhartia Group in December 2024 highlights consolidation in bottling operations, which could enhance manufacturing efficiency and distribution reach for ready-to-drink tea portfolios.
Japan, South Korea, Thailand, Singapore, Indonesia, Australia, and the rest of Asia-Pacific collectively account for the remaining 48.64% of the market share, with each country exhibiting distinct consumption patterns and regulatory frameworks. In Japan, the high density of vending machines and the widespread presence of convenience stores provide extensive point-of-sale access. Companies such as Suntory, Ito En, Asahi, and Kirin dominate the market through vertically integrated supply chains and Internet of Things (IoT)-enabled vending technology, which offers personalized product recommendations.
Competitive Landscape
Top Companies in Asia-Pacific Ready to Drink Tea Market
The Asia-Pacific ready-to-drink tea market shows moderate concentration, with multinational beverage companies operating alongside agile regional players and vertically integrated domestic firms. Market participants use dual strategies: defending volume through mass-market iced tea offerings and expanding margins through premium herbal and functional tea variants. These strategies are supported by digital marketing initiatives, influencer collaborations, and subscription models aimed at engaging younger consumers. Nongfu Spring's rise to become the world's third-most valuable non-alcoholic beverage brand in August 2025, with a brand value of USD 11.1 billion, highlights the competitive challenge posed by domestic companies. These players combine cost efficiency with premiumization, utilizing proprietary water sources and sugar-free formulations to challenge established multinational brands.
Growth opportunities include innovation in functional ingredients, such as adaptogens and nootropics, which remain underutilized in the Asia-Pacific region despite strong demand in North American and European markets. Additionally, geographic expansion into tier-three and tier-four cities in China and India presents potential, as these areas experience rapid disposable income growth despite lower modern retail penetration compared to coastal regions.
Emerging disruptors in the market include digital-native brands that bypass traditional distribution channels through direct-to-consumer e-commerce. These brands leverage granular consumer data to guide product development and implement dynamic pricing strategies. Specialty tea cafes are also gaining traction by offering artisanal, single-origin teas and educating consumers on terroir and processing techniques, thereby enhancing the perception of tea beyond a basic hydration product. Technological advancements are playing a significant role in the market, with the adoption of Internet of Things (IoT)-enabled vending machines, blockchain-based traceability systems, and artificial intelligence (AI)-driven demand forecasting. These technologies help optimize inventory management and minimize waste, contributing to operational efficiency.
Asia-Pacific Ready To Drink Tea Industry Leaders
Suntory Holdings Ltd
Ito En Ltd
Uni-President Enterprises Corp
Tingyi (Cayman Islands) Holding Corp
Nongfu Spring Co Ltd.
- *Disclaimer: Major Players sorted in no particular order

Recent Industry Developments
- April 2025: Lipton Iced Tea launched Fusions Lemonade Iced Tea in Strawberry Lemonade and Pineapple Mango flavors, featuring 50% less sugar than sodas. A sweepstakes offers getaways to summer-themed towns
- September 2024: Twinings launched a ready-to-drink sparkling tea line in three flavors—Refresh, Defence, and Boost—fortified with vitamins, no added sugars, under 50 calories per can, targeting health-focused consumers.
- March 2024: PepsiCo announced an additional USD 400 million investment to build two new manufacturing plants in Vietnam, which expanded production and distribution capacity in Southeast Asia. The investment formed part of PepsiCo's regional growth strategy and positioned the company to serve the rising demand for ready-to-drink beverages, including functional tea variants.


Asia-Pacific Ready To Drink Tea Market Report Scope
The Asia-Pacific Ready-to-Drink Tea Market includes non-alcoholic, pre-packaged tea beverages designed for immediate consumption without additional preparation. These products encompass iced teas, flavored teas, and both sweetened and unsweetened variants. The market is segmented by type into Green Tea, Herbal Tea, Iced Tea, and Others. By packaging type, the market is categorized into Aseptic Packages, Glass Bottles, Metal Cans, and PET Bottles. Based on distribution channels, the market is divided into On-trade and Off-trade, with Off-trade further segmented into Convenience Stores, Specialist Retailers, Supermarkets and Hypermarkets, Online Retail, and Others. The market sizing has been done in value terms in USD, and volume in Units for all the abovementioned segments.
By Type
| Green Tea |
| Herbal Tea |
| Iced Tea |
| Others |
By Packaging Type
| Aseptic packages |
| Glass Bottles |
| Metal Can |
| PET Bottles |
By Distribution Channel
| On-trade | |
| Off-trade | Convenience Stores |
| Specialist Retailers | |
| Supermarkets and Hypermarkets | |
| Online Retail | |
| Others |
By Geography
| China |
| India |
| Japan |
| Australia |
| Indonesia |
| South Korea |
| Thailand |
| Singapore |
| Rest of Asia-Pacific |
| By Type | Green Tea | |
| Herbal Tea | ||
| Iced Tea | ||
| Others | ||
| By Packaging Type | Aseptic packages | |
| Glass Bottles | ||
| Metal Can | ||
| PET Bottles | ||
| By Distribution Channel | On-trade | |
| Off-trade | Convenience Stores | |
| Specialist Retailers | ||
| Supermarkets and Hypermarkets | ||
| Online Retail | ||
| Others | ||
| By Geography | China | |
| India | ||
| Japan | ||
| Australia | ||
| Indonesia | ||
| South Korea | ||
| Thailand | ||
| Singapore | ||
| Rest of Asia-Pacific | ||


Market Definition
- Carbonated Soft Drinks (CSDs) - Carbonated soft drinks (CSDs) refer to non-alcoholic beverages that are carbonated and typically flavored, containing dissolved carbon dioxide to create effervescence. These beverages commonly include cola, lemon-lime, orange, and various fruit-flavored sodas. Marketed in cans, bottles, or fountain dispense.
- Juices - We have considered packaged juices which encompass non-alcoholic beverages derived from fruits, vegetables, or a combination thereof, processed and sealed in various packaging formats such as bottles, cartons, or pouches. Excluding fresh juices, this market segment involves commercially prepared and preserved juices, often with added preservatives and flavors.
- Ready-to-Drink (RTD) Tea and RTD Coffee - Ready-to-Drink (RTD) tea and RTD coffee are pre-packaged, non-alcoholic beverages that are brewed and prepared for consumption without further dilution. RTD tea typically includes various tea varieties, infused with flavors and sweeteners, and comes in bottles, cans, or cartons. Similarly, RTD coffee involves pre-brewed coffee formulations, often mixed with milk, sugar, or flavorings, and is conveniently packaged for on-the-go consumption.
- Energy Drinks - Energy drinks are non-alcoholic beverages formulated to provide a quick boost of energy and alertness. Whereas, sports drinks are beverages designed to hydrate and replenish electrolytes, particularly after physical exertion, exercise, or intense activity
| Keyword | Definition |
|---|---|
| Carbonated Soft Drinks | Carbonated soft drinks (CSDs) are a combination of carbonated water and flavouring, sweetened by sugar or a non-sugar sweeteners. |
| Standard Cola | Standard Cola is defined as the original flavor of cola soda. |
| Diet Cola | A cola-based soft drink containing no or low amounts of sugar |
| Fruit Flavored Carbonates | A carbonated beverage prepared from fruit juice/fruit flavor with carbonated water and containing sugar, dextrose, invert sugar or liquid glucose either singly or in combination. It may contain peel oil and fruit essences. |
| Juice | Juice is a drink made from the extraction or pressing of the natural liquid contained in fruit and vegetables. |
| 100% Juice | Fruit/vegetable juice made from fruit in the form of its juice with no water added to make up the volume. It is not permitted to add sugars, sweeteners, preservatives, flavourings or colourings to fruit juice. |
| Juice Drinks (up to 24% Juice) | Fruit/vegetable juice drinks with up to 24% fruits/vegetable extract. |
| Nectars (25-99% Juice) | Juices that can have between 25 and 99% of fruit, with the minimum legal limits defined depending on the type of fruit |
| Juice concentrates | Juice Concentrates are those form of juices when most of this liquid is removed resulting in a thick, syrupy product known as juice concentrate. |
| RTD Coffee | Packaged coffee beverages that are sold in a prepared form and are ready for consumption at the time of purchase. |
| Iced Coffee | An iced coffee is a cold version of coffee, usually a combination of hot espresso and milk with ice added to it. |
| Cold Brew Coffee | Cold brew also called cold water extraction or cold pressing is made by steeping ground coffee in room-temperature water for several hours. |
| RTD Tea | Ready-to-drink (RTD) tea is a packaged tea product ready for immediate consumption without brewing or preparation |
| Iced Tea | Ice tea or iced tea is a drink made from tea without milk but with sugar and sometimes fruit flavourings, drunk cold. |
| Green Tea | Green tea is a tea beverage which promotes mental alertness, relieving digestive symptoms and promoting weight loss. |
| Herbal Tea | Herbal tea beverages are made from the infusion or decoction of herbs, spices, or other plant material in hot water. |
| Energy Drink | A type of drink containing stimulant compounds, usually caffeine, which is marketed as providing mental and physical stimulation. They may or may not be carbonated and may also contain sugar, other sweeteners, or herbal extracts, among numerous possible ingredients. |
| Sugar-free or Low-calories Energy Drinks | Sugar-free or Low-calories Energy Drinks are sugar-free, artificially sweetened energy drinks with few or no calories. |
| Traditional Energy Drink | Traditional Energy Drinks are functional soft drinks containing ingredients designed to boost the consumer's energy. |
| Natural/Oraganic Energy Drinks | Natural/Organic energy drinks are energy drinks free of artificial sweeteners and synthetic colorings. Instead, they contain naturally derived ingredients such as green tea, yerba mate, and botanical extracts. |
| Energy Shots | A small but highly concentrated energy drink that contains large amounts of caffeine and/or other stimulants. The quantity is comparatively smaller compared to energy drinks. |
| Sports Drink | Sports drinks are beverages designed specifically for the rapid supply of fluid, carbohydrates, and electrolytes before, during or after exercise. |
| Isotonic | Isotonic drinks contain similar concentrations of salt and sugar as in the human body, and are designed to quickly replace fluids lost during exercise but with an increase of carbohydrate. |
| Hypertonic | Hypertonic drinks have a higher concentration of salt and sugar than the human body. They are best drunk after exercise as it is important to replace glycogen levels quickly after exercise. |
| Hypotonic | Hypotonic drinks are designed to quickly replace fluids lost during exercise. They have very low carbohydrate content and a lower concentration of salt and sugar than the human body. |
| Electrolyte-Enhanced Water | Electrolyte water is water infused with electrically-charged minerals, such as sodium, potassium, calcium, and magnesium. |
| Protein-based Sport Drinks | Protein-based sports drinks are those sports drinks which has added protein in it that will improve performance and reduce muscle protein breakdown. |
| On-Trade | The on-trade refers to places that sell beverages for immediate consumption on the premises like bars, restaurants, and pubs |
| Off-Trade | Off-trade usually means places like liquor stores, supermarkets and other places where you don't consume the beverage right away. |
| Convenience Store | A retail business that provides the public with a convenient location to quickly purchase a wide variety of consumable products and services, generally food and gasoline. |
| Specialty store | A specialty store is a shop/store that carries a deep assortment of brands, styles, or models within a relatively narrow category of goods |
| Online Retail | Online retail is a type of eCommerce whereby a business sells goods or services directly to consumers from a website. |
| Aseptic Packaging | Aseptic packaging refers to the filling of a cold, commercially sterile product under sterile conditions into a presterilized container and closure under sterile conditions to form a seal that effectively excludes microorganisms. These includes tetra packs, cartons, pouches etc. |
| PET Bottle | PET bottle means a bottle made of polyethylene terephthalate. |
| Metal Cans | Metal containers made of aluminum or tin- plated or zinc-plated steel, which are commonly used for packaging food, beverages or other products. |
| Disposable Cups | Disposable Cup means a cup or other container designed for single use to serve beverages, such as water, cold drinks, hot drinks and alcoholic beverages. |
| Gen Z | A way of referring to the group of people who were born in the late 1990s and early 2000s. |
| Millenial | Anyone born between 1981 and 1996 (ages 23 to 38 in 2019) is considered a Millennial |
| Taurine | Taurine is an amino acid that supports immune health and nervous system function. |
| Bars & Pubs | It is a drinking establishment licensed to serve alcoholic drinks for consumption on the premises. |
| Café | It is a foodservice establishment serving refreshments (mainly coffee) and light meals. |
| On the go | It means doing / dealing with while busily engaged with something and not diverting plans in order to accommodate. |
| Internet Penetration | The Internet Penetration Rate corresponds to the percentage of the total population of a given country or region that uses the Internet. |
| Vending Machine | A machine that dispenses small articles such as food, drinks, or cigarettes when a coin or token is inserted |
| Discount store | A discount store or discounter offers a retail format in which products are sold at prices that are in principle lower than an actual or supposed "full retail price". Discounters rely on bulk purchasing and efficient distribution to keep down costs. |
| Clean Label | Clean label on the beverage market are drinks that are made from few ingredients of natural origin and are not or only slightly processed. |
| Caffeine | An alkaloid compound which is a stimulant of the central nervous system. It is mainly used recreationally, as a mild cognitive enhancer to increase alertness and attentional performance. |
| Extreme sport | Action sports, adventure sports or extreme sports are activities perceived as involving a high degree of risk. |
| High-intensity interval training | It incorporates several rounds that alternate between several minutes of high intensity movements to significantly increase the heart rate to at least 80% of one's maximum heart rate, followed by short periods of lower intensity movements. |
| Shelf life | The length of time for which an item remains usable, fit for consumption, or saleable. |
| Cream Soda | Cream soda is a sweet soft drink. Generally flavored with vanilla and based on the taste of an ice cream float |
| Root Beer | Root beer is a sweet North American soft drink traditionally made using the root bark of the sassafras tree Sassafras albidum or the vine of Smilax ornata as the primary flavor. Root beer is typically, but not exclusively, non-alcoholic, caffeine-free, sweet, and carbonated. |
| Vanilla Soda | A carbonated soft drink flavoured with vanilla. |
| Dairy-Free | A product that does not contain any milk or milk products from cows, sheep or goats. |
| Caffeine-Free Energy Drinks | Caffeine-free energy drinks rely on other ingredients to boost the energy. Popular choices include amino acids, B vitamins, and electrolytes. |


Research Methodology
Mordor Intelligence follows a four-step methodology in all our reports.
- Step-1: IDENTIFY KEY VARIABLES: In order to build a robust forecasting methodology, the variables and factors identified in Step 1 are tested against available historical market numbers. Through an iterative process, the variables required for market forecast are set, and the model is built on the basis of these variables.
- Step-2: Build a Market Model: Market-size estimations for the forecast years are in nominal terms. Inflation is not a part of the pricing, and the average selling price (ASP) is kept constant throughout the forecast period for each country.
- Step-3: Validate and Finalize: In this important step, all market numbers, variables, and analyst calls are validated through an extensive network of primary research experts from the market studied. The respondents are selected across levels and functions to generate a holistic picture of the market studied.
- Step-4: Research Outputs: Syndicated reports, custom consulting assignments, databases & subscription platforms


