US Ready To Drink Tea Market Size and Share
Market Overview
| Study Period | 2021 - 2031 |
|---|---|
| Forecast Data Period | 2026 - 2031 |
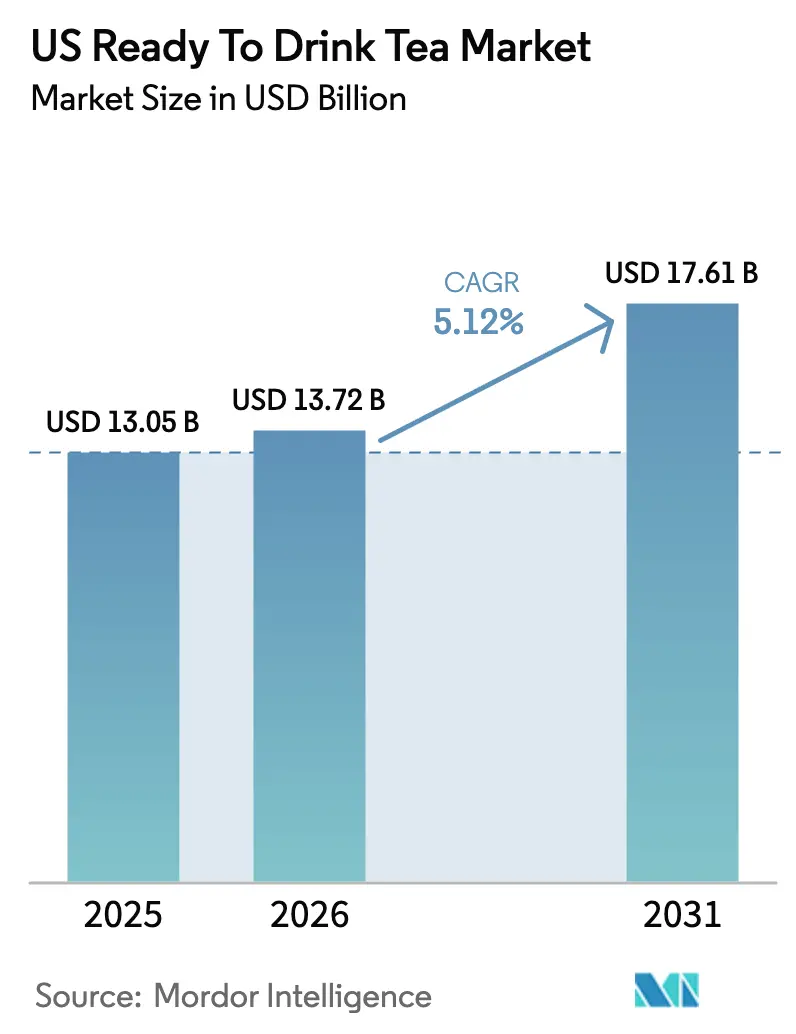
| Base Year Market Size (2025) | USD 13.05 Billion |
| Market Size (2026) | USD 13.72 Billion |
| Market Size (2031) | USD 17.61 Billion |
| Growth Rate (2026 - 2031) | 5.12% CAGR |
| Market Concentration | High |
Major Players
*Disclaimer: Major Players sorted in no particular order Image © Mordor Intelligence. Reuse requires attribution under CC BY 4.0. |
|
US Ready To Drink Tea Market Analysis by Mordor Intelligence
The United States Ready-to-Drink Tea market size is projected to be USD 13.05 billion in 2025, USD 13.72 billion in 2026, and reach USD 17.61 billion by 2031, growing at a CAGR of 5.12% from 2026 to 2031. This expansion is fueled by a significant shift away from carbonated soft drinks toward healthier beverage options. This trend is especially evident among Gen Z and millennial consumers, who prefer shorter ingredient lists and clearly defined functional benefits. Warmer seasons drive consumption increases, with sweetened tea purchases peaking during summer and early fall. Brands that include botanicals, adaptogens, or prebiotic fibers appeal to younger consumers focused on wellness. Additionally, premium glass packaging is increasingly perceived as a symbol of quality and sustainability. As kombucha, prebiotic sodas, and sparkling waters compete for the attention of health-conscious consumers, RTD tea brands are refining their emphasis on natural caffeine, antioxidants, and cultural authenticity to differentiate themselves in a competitive retail environment.
Key Report Takeaways
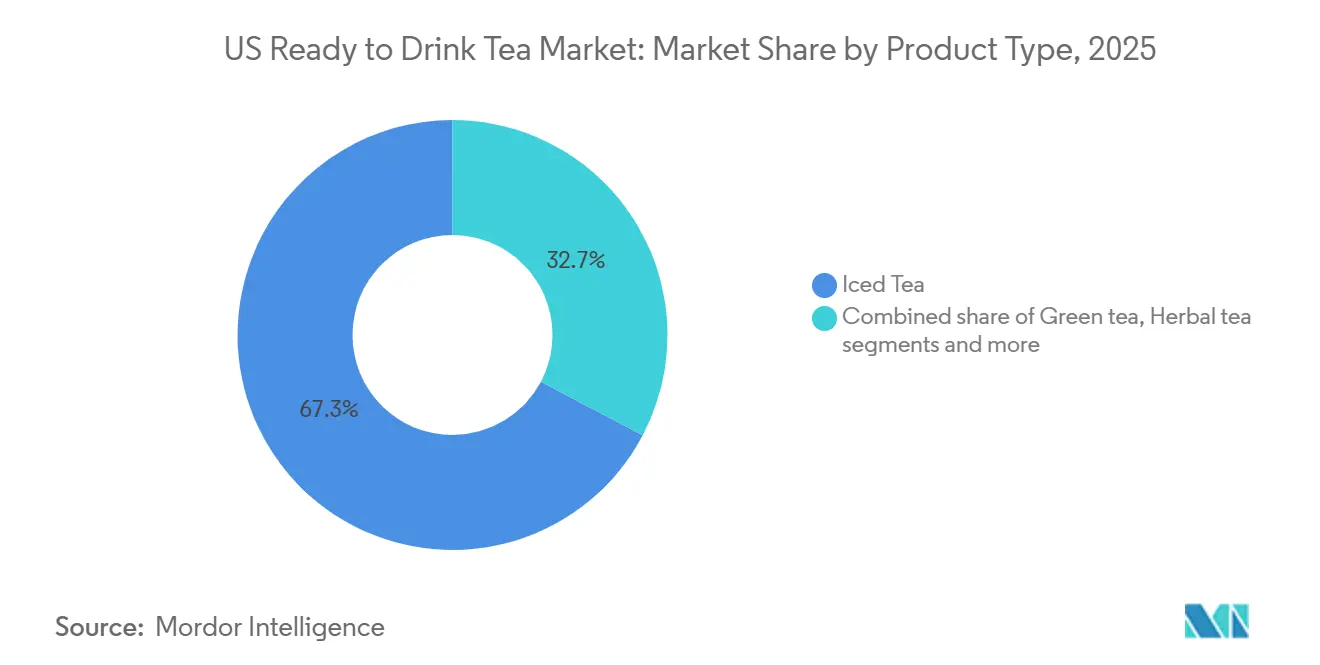
- By product type, iced tea led with 67.28 % of the United States Ready-to-Drink Tea market share in 2025, whereas herbal tea is set to grow at a 6.28 % CAGR through 2031.
- By packaging type, PET bottles captured 76.84 % of volume in 2025; glass bottles are forecast to expand at a 6.37 % CAGR to 2031.
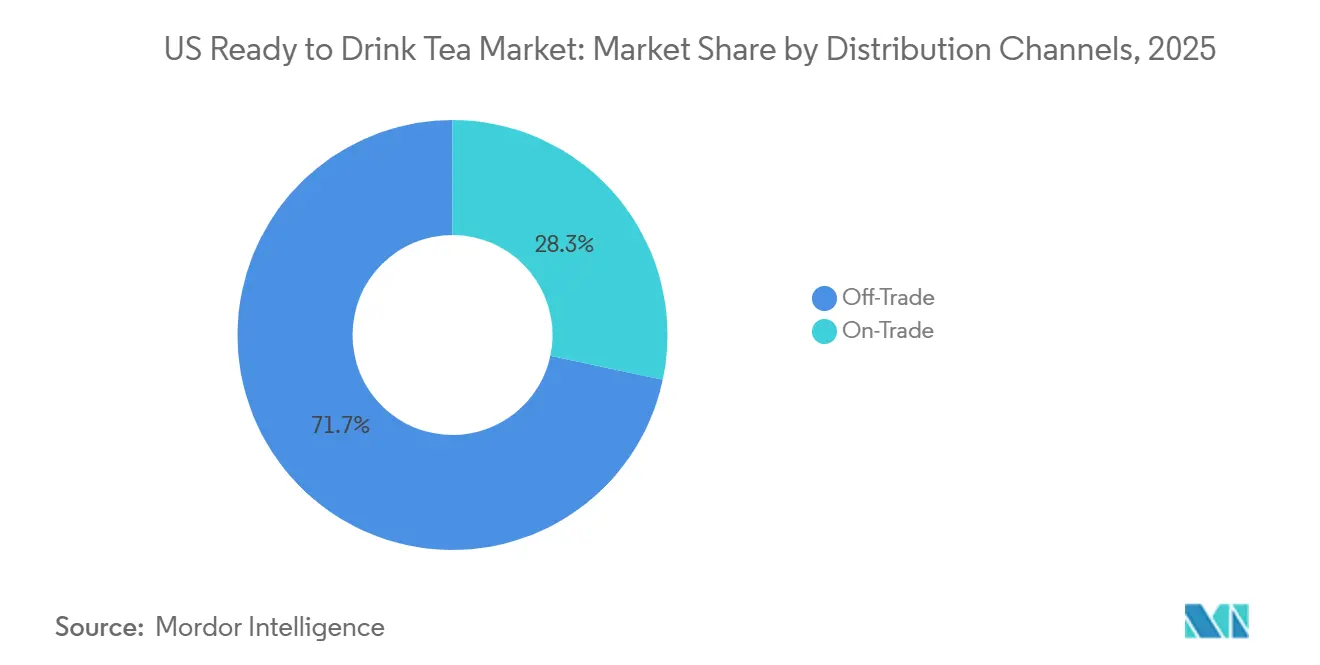
- By distribution channel, off-trade outlets held 71.67 % share in 2025, while on-trade sales are projected to advance at a 6.87 % CAGR.
- By functionality, antioxidant-rich products commanded 59.32 % share in 2025, yet detox-positioned teas are expected to post a 6.52 % CAGR.
Note: Market size and forecast figures in this report are generated using Mordor Intelligence’s proprietary estimation framework, updated with the latest available data and insights as of January 2026.
US Ready To Drink Tea Market Trends and Insights
Drivers Impact Analysis*
| Driver | (~) % Impact on CAGR Forecast | Geographic Relevance | Impact Timeline |
|---|---|---|---|
| Health and wellness shift away from CSDs | +1.2% | United States urban centers | Medium term (2-4 years) |
| Demand for low/no-sugar and sugar-free variants | +0.9% | United States | Short term (≤ 2 years) |
| Premiumization and trading up | +0.7% | United States metro areas | Medium term (2-4 years) |
| Rising preference for natural, organic, and clean-label products | +0.8% | United States | Medium term (2-4 years) |
| Flavor and format innovation | +0.6% | United States | Short term (≤ 2 years) |
| Convenience and on-the-go lifestyles | +0.5% | United States | Long term (≥ 4 years) |
| Source: Mordor Intelligence | |||


Health and wellness shift away from CSDs
Following the pandemic, as concerns over immunity and metabolic health grew, consumers began reallocating their beverage budgets away from carbonated soft drinks toward products perceived as functional or naturally derived. Recent retail sales indicate that non-alcoholic beverages have outperformed alcoholic categories. Caffeinated functional drinks, including ready-to-drink (RTD) tea, have particularly benefited from expanded distribution in locations where alcohol sales are restricted. Spending on sports and energy drinks has risen sharply, outpacing the overall growth of non-alcoholic beverages. This trend highlights the growing appeal of caffeine-containing RTD formats, which are capturing market share from traditional carbonated soft drinks (CSDs). Outdoor workers and lower-income households are key drivers of this shift, as they are more responsive to temperature changes and heat exposure during work. For RTD tea, this shift presents two opportunities: iced tea variants can attract consumers moving away from CSDs with their familiar sweetness and perceived health benefits, while unsweetened and lightly sweetened teas appeal to those prioritizing calorie reduction. ITO EN's Oi Ocha green tea, with 75% of its portfolio being sugar-free, exemplifies this positioning. In 2025, the brand partnered with baseball star Shohei Ohtani, signaling the mainstream acceptance of unsweetened formats.
Demand for low/no-sugar and sugar-free variants
Regulatory and consumer pressures are reshaping formulation strategies in the RTD tea category, pushing for reduced added-sugar intake. The FDA's updated nutrition labeling now mandates clear added-sugar disclosures, enhancing transparency and facilitating direct comparisons at the point of purchase. In 2024, PepsiCo and Unilever introduced Pure Leaf Zero Sugar, harnessing natural sweeteners to preserve taste without the calories. This launch is in line with their broader commitment to sugar reduction across their portfolios. The functional beverage sector is increasingly turning to natural sweeteners, such as stevia and monk fruit, to offer low-calorie options that don't sacrifice taste. As temperatures rise, disadvantaged groups see a disproportionate uptick in added-sugar consumption. This climate-driven demand presents a conundrum: while warmer weather boosts RTD tea sales, advocates and policymakers are likely to intensify their scrutiny on sugar content, hastening reformulation efforts. In 2024, the International Diabetes Federation reported that 15.7% of United States[1]Source: International Diabetes Federation, "IDF Diabetes Atlas - Eleventh Edition (2025)", idf.org. adults were diabetic. The rising diabetes prevalence has fueled a significant demand for low, no-sugar, and sugar-free products, seen as vital for glycemic control, weight management, and obesity prevention.
Premiumization and trading up
Premium-tier Ready-to-Drink (RTD) tea products, distinguished by their glass packaging, organic certifications, and artisanal branding, are increasingly appealing to consumers willing to pay a premium for perceived quality and sustainability. Pure Leaf, the leading premium iced tea brand in the United States, leverages glass-bottle formats and limited-edition flavor releases to command higher prices, creating a sense of scarcity and collectability. With disposable personal income in the U.S. rising by 0.5% in February 2025, there's a noticeable shift towards premium, healthier, and convenient RTD tea and coffee. As incomes grow, consumers are placing a premium on wellness and quality. This shift is driving demand for premium, functional, and organic RTD tea options that prioritize health without sacrificing convenience. According to the U.S. Bureau of Economic Analysis (BEA), disposable personal income per capita in the U.S. reached USD 64,423 billion in 2024[2]Source: United States Bureau of Economic Analysis (BEA), "Personal Income", bea.gov. RTD tea brands are capitalizing on this trend, incorporating elements like prebiotic fibers, probiotics, and botanical extracts to justify their premium pricing and stand out from standard iced tea offerings. Meanwhile, contract manufacturers are making strides in specialized processing—utilizing high-pressure processing cells, multi-ingredient dosing systems, and aseptic fill lines. This investment allows smaller brands to tap into premium production capabilities without the burden of establishing costly in-house facilities.
Rising preference for natural, organic, and clean-label products
Health-conscious consumers, especially Generation Z and millennials, now expect transparency in ingredient sourcing and minimalist formulations. These consumers meticulously scrutinize labels and research brands before making a purchase. For instance, organic food sales in the United States reached USD 65.4 billion in 2024, as reported by the Organic Trade Association[3]Source: Organic Trade Association, "U.S. Organic Industry Survey 2025", ota.com. While USDA Organic certification adds both cost and complexity, it offers a credible third-party validation. This resonates deeply with consumers who are often skeptical of vague "natural" claims. Beverages now frequently feature botanicals and adaptogens, like chamomile, turmeric, ginseng, hibiscus, ashwagandha, and Lion's Mane mushroom. These additions not only position the drinks as functional but also meet clean-label criteria, as long as extraction and processing methods maintain bioactive compounds and steer clear of synthetic additives. Ingredient suppliers are focusing on extraction technologies that not only prevent off-notes and degradation but also ensure solubility, stability, and a neutral taste profile, all without compromising palatability. Regulatory frameworks mandate pre-market safety assessments for novel botanicals. These assessments cover botanical identity, manufacturing process details, chemical composition, contaminant limits, and toxicology data. This sets a precedent that brands in the United States should heed, especially as domestic scrutiny intensifies. The market for functional foods and beverages, especially those containing botanicals, faces safety challenges. Risks from natural toxins, pesticides, heavy metals, and food-drug interactions highlight the need for stringent quality control and transparent labeling of consumption limits. For RTD tea formulators using botanicals, there's a crucial balance to strike. They must ensure efficacy while prioritizing safety, clearly specifying marker compounds and maximum daily intake to sidestep adverse events and regulatory penalties.
Restraints Impact Analysis*
| Restraint | (~) % Impact on CAGR Forecast | Geographic Relevance | Impact Timeline |
|---|---|---|---|
| Competition from adjacent beverages | -0.6% | United States | Short term (≤ 2 years) |
| Sugar content concerns and category reformulation pressure | -0.4% | United States | Medium term (2-4 years) |
| Regulatory and labeling compliance costs | -0.3% | United States | Medium term (2-4 years) |
| Seasonality and weather sensitivity | -0.5% | United States | Long term (≥ 4 years) |
| Source: Mordor Intelligence | |||
Competition from adjacent beverages
Prebiotic sodas gained significant traction, particularly those promoting digestive health. This growth was primarily driven by increasing consumer interest in gut health and a preference for low-sugar beverages. Highlighting the growing importance of prebiotic drinks, PepsiCo made a notable move with its USD 1.9 billion acquisition of Poppi in May 2025. Shortly after, in July 2025, the company introduced a prebiotic product line under its Pepsi brand. This strategic shift indicates that major players may be redirecting their innovation and marketing efforts away from traditional ready-to-drink (RTD) teas. Kombucha, known for its probiotic benefits, has established a niche appeal among consumers seeking live cultures and authenticity. However, issues such as shelf-life and distribution constraints have limited its broader market penetration. At the same time, sparkling water brands have successfully redefined hydration as a premium, flavor-focused category. This evolution has eroded RTD tea's market share, particularly among consumers favoring zero-calorie options. To address this competition, RTD tea brands must emphasize distinct value propositions, such as natural caffeine, antioxidant properties, or cultural heritage.
Sugar content concerns and category reformulation pressure
Advocates for public health and regulatory bodies are driving changes in sugar-sweetened beverages, resulting in expensive reformulations that may alienate loyal consumers. The UK government has established a precedent by restricting promotions on products high in fat, sugar, and salt. These measures prohibit multibuy offers and limit prominent in-store placements for specific beverages. U.S. policymakers at both federal and state levels could adopt similar strategies. For example, sweetened ready-to-drink (RTD) teas containing more than 5 grams of added sugar per 100 milliliters might face such promotional limitations, reducing their visibility for impulse purchases. Reformulating with natural sweeteners like stevia and monk fruit can address sugar-related concerns but presents challenges such as aftertaste, stability, and consumer acceptance, requiring extensive testing and recipe adjustments. In Washington State, sugar-sweetened beverage consumption among low-income children was linked to untreated tooth decay. Additionally, frequent shopping at convenience stores was associated with a higher number of decayed tooth surfaces. This connection between RTD tea sales and oral health disparities supports the case for taxation or retail restrictions. To anticipate potential regulations and align with changing consumer preferences, brands should proactively lower sugar content and clearly communicate their reformulation efforts.
*Our forecasts treat driver/restraint impacts as directional, not additive. The impact forecasts reflect baseline growth, mix effects, and variable interactions.
Segment Analysis
By Product Type: Herbal Variants Capture Wellness Momentum
Iced tea accounted for a dominant 67.28% share of the U.S. Ready-to-Drink Tea market in 2025, driven by Arizona's strong convenience-store presence and the broad appeal of brands like Gold Peak and Pure Leaf. Arizona's value pricing appeals to cost-conscious consumers, but its high sugar content faces regulatory scrutiny and competition from low-calorie alternatives. Meanwhile, refrigerated RTD teas, such as Milo's business, which grew by 19% in 2024, demonstrate premium potential through cold-chain freshness. However, their geographic expansion remains constrained by logistical costs.
Herbal tea is anticipated to grow at a 6.28% CAGR through 2031, surpassing the overall growth of the U.S. Ready-to-Drink Tea market. This growth is fueled by increasing consumer interest in detox, adaptogenic, and digestive-support benefits. Ingredients such as chamomile, ginger, hibiscus, and ashwagandha offer targeted functionalities and command premium prices. Mood-support beverages experienced an 87% year-over-year growth, reflecting rising demand for herbal blends aimed at promoting calmness and focus. Green tea maintains a loyal consumer base due to its antioxidant catechins and clean caffeine. ITO EN’s Oi Ocha, which earned Guinness certification, plans to expand its sugar-free brand presence to 60 countries by 2028, further solidifying its market authority.


By Packaging Type: Glass Signals Premium, Sustainability Convergence
In 2025, PET bottles accounted for a significant 76.84% of the market value, thanks to their cost efficiency and lightweight nature. However, growing concerns over plastic waste are prompting brands to either incorporate recycled content or explore alternative materials, leading to a rise in input costs. Meanwhile, glass, often viewed as a premium and eco-friendly choice, is projected to witness a 6.37% CAGR growth. Brands like Pure Leaf are capitalizing on this trend, using glass bottles and limited runs to stand out on shelves. Yet, challenges like weight and breakage issues are hindering broader distribution.
Aseptic cartons and pouches not only facilitate ambient storage and reduce refrigeration costs but also resonate with carbon-reduction initiatives. This is especially true for Tetra Pak, which boasts a design made from 90% renewable materials. While foodservice operators appreciate the operational efficiency of aseptics, some consumers might not view cartons as premium. On the other hand, metal cans offer durability and recyclability. DrinkPAK is ramping up its operations with a new plant in Philadelphia, set to produce 3,000 cans per minute in various sizes by 2027. This move ensures a steady supply for burgeoning segments like hard teas and sparkling blends.
By Distribution Channel: On-Trade Rebound Unlocks Menu Innovation
In 2025, off-trade outlets accounted for a significant 71.67% market share. Supermarkets, hypermarkets, and convenience stores (c-stores) drove this dominance due to their merchandising flexibility and frequent consumer purchases. Convenience stores, visited weekly by two-thirds of U.S. consumers, remain essential for the single-serve tea market. However, in 2024, these stores experienced a decline in in-store purchases, likely influenced by a shift toward healthier preferences. Although online sales channels are still relatively small, they hold strategic value. For instance, United States growth in mobile commerce highlights digital readiness, offering tea brands opportunities for app-based subscriptions and targeted promotions.
On-trade sales are anticipated to grow at a 6.87% CAGR. Restaurants, cafés, and quick-service venues are increasingly incorporating functional teas, which deliver higher profit margins compared to traditional fountain sodas. As free-refill programs impose stricter limits on high-sugar beverages, operators are adapting by offering unsweetened or lightly sweetened teas that align with policy requirements while meeting consumer taste expectations. Additionally, the expansion of contract manufacturing is reshaping the market. For example, Pittston Co-Packers' 403,000-square-foot facility provides fresh-brewed iced teas for the foodservice sector, enabling brands to avoid significant investments in proprietary plants.
By Functionality: Detox Positioning Rides Gut-Health Wave
In 2025, antioxidant-rich teas commanded a 59.32% market share, reflecting decades of research that associate polyphenol intake with reduced oxidative stress. The U.S. market for ready-to-drink antioxidant teas is anticipated to grow steadily, fueled by increasing consumer awareness of the health benefits offered by catechins and vitamin C. As product differentiation becomes less pronounced, brands are enhancing their offerings by incorporating L-theanine to promote calm focus and zinc to support immune health, enabling them to sustain their pricing power.
Detox teas, benefiting from growing consumer interest in gut health and metabolic resets, are projected to achieve a 6.52% CAGR. Ingredients such as prebiotic fibers, probiotics, and botanicals like dandelion and milk thistle strengthen product positioning. However, brands must exercise caution with their claims due to FDA scrutiny regarding disease-related implications. The U.S. market for ready-to-drink detox teas is expected to expand in line with the broader adoption of functional beverages, provided brands can validate the safety and efficacy of their products.
Geography Analysis
The United States boasts a sophisticated retail landscape, characterized by high per-capita consumption and a strong brand loyalty that spans both mass-market and premium segments. Convenience stores, ubiquitous across the nation, ensure easy access to single-serve products. In contrast, supermarkets and hypermarkets, with their ample shelf space, cater to the demand for multi-pack and family-size options, addressing a broad spectrum of consumer preferences. Regions with a penchant for iced beverages, notably North Carolina, Florida, Georgia, Mississippi, Tennessee, and Virginia, are witnessing a surge in the demand for RTD tea.
The Southwest region is poised to lead this growth trend in the U.S. The functional beverage market is booming, spurred by a heightened consumer emphasis on mood, stress management, and mental well-being. This shift is amplifying the demand for RTD teas, especially those infused with adaptogens, L-theanine, and botanical extracts, all tailored to bolster cognitive and emotional health. Additionally, consumption patterns influenced by temperature play a pivotal role in seasonal demand. For example, as temperatures climb from 12-30°C, there's a corresponding uptick in sweetened beverage purchases, with an increase of roughly 0.73 grams of added sugar for each degree rise. This correlation results in pronounced volume surges during warmer months, tapering off in winter, as noted by Nature Climate Change.
Regulatory oversight on sugar content, coupled with the looming threat of taxation and promotional limitations, echoes policies already in play in the UK. Such measures, including the prohibition of multibuy offers and limitations on the prominent display of high-sugar drinks, pose formidable challenges. These hurdles could stifle volume growth and hasten the reformulation process for producers. In response to these challenges and to bolster production capabilities, there's a marked uptick in contract manufacturing investments. A prime illustration is Swire Coca-Cola USA's substantial USD 475 million outlay on a sprawling 620,000-square-foot facility in Colorado Springs. Set to kick off operations in 2026, this facility aims to churn out over 230 beverage varieties spanning more than 60 brands, catering to both industry stalwarts and newcomers alike.
Competitive Landscape
In the United States, the RTD tea market sees a moderate concentration, dominated by PepsiCo Inc., The Coca-Cola Company, and Keurig Dr Pepper. These giants leverage multi-brand portfolios that cater to mass-market, premium, and functional segments. PepsiCo's Pure Leaf, the leading premium iced tea brand, showcases a two-pronged strategy: defending its premium market share and appealing to health-conscious consumers, as seen in its 2024 launch of the sugar-free Pure Leaf Zero Sugar. Meanwhile, smaller players like ITO EN are making waves. Their Oi Ocha green tea, recognized as the world's top RTD green tea, boasts a Guinness certification. In 2025, they partnered with MLB star Shohei Ohtani, emphasizing their authenticity and Japanese heritage. Their products, 75% sugar-free, target the premium unsweetened segment.
In the U.S., the ready-to-drink tea market is buzzing with product innovations and strategic expansions. Major players are pivoting towards healthier variants, emphasizing natural ingredients, reduced sugar, and added functional benefits. This agility is evident as manufacturers swiftly adapt to market shifts, investing in cutting-edge production technologies and eco-friendly packaging. Beverage companies are increasingly forging partnerships with retail chains, bolstering their distribution and market reach. Additionally, firms are diversifying their portfolios, rolling out premium offerings, seasonal flavors, and limited-edition variants, all while amplifying their digital footprint and direct-to-consumer sales channels.
Beyond just antioxidants, there's a growing interest in functional benefits like gut health, cognitive support, and stress relief. Ingredients such as prebiotic fibers, adaptogens, and nootropics not only justify premium pricing but also set products apart from standard iced teas. This trend is underscored by PepsiCo's USD 1.9 billion acquisition of Poppi in May 2025. Following this, they launched a prebiotic range under the Pepsi brand in July 2025. Such moves indicate that major players are keen to invest in burgeoning functional segments. While this poses a consolidation risk for independent RTD tea brands, it also opens doors for partnerships, especially for those with credible functional formulations. Brands are leveraging technology, from AI-driven flavor enhancements to advanced aseptic filling lines. These innovations help mask off-notes of functional ingredients, boost shelf stability, and speed up product development, offering a competitive edge. As regulatory scrutiny tightens, especially around botanical safety and labeling transparency, brands that prioritize rigorous quality control and evidence-backed messaging will stand out, earning trust from both regulators and consumers.
US Ready To Drink Tea Industry Leaders
-
Arizona Beverages USA LLC
-
Keurig Dr Pepper, Inc.
-
Milo’s Tea Company, Inc.
-
PepsiCo, Inc.
-
The Coca-Cola Company
- *Disclaimer: Major Players sorted in no particular order

Recent Industry Developments
- May 2025: PepsiCo acquired Poppi,reflecting the beverage giant's strategic bet on gut-health functional beverages and willingness to pay significant multiples to capture high-growth segments that overlap with RTD tea's health-conscious consumer base.
- February 2025: HTeaO and poppi have teamed up to offer a tantalizing treat: a limited-time blend of poppi's prebiotic sodas and HTeaO's freshly brewed iced teas. Hailing from Texas, this collaboration promises a delightful experience for taste.
- January 2023: Milo's Tea Company has invested over USD 130 million to construct a new plant and distribution centre in Spartanburg County, South Carolina. This new investment is a direct response to the growth of Milo's brand.


US Ready To Drink Tea Market Report Scope
Ready-to-Drink (RTD) tea is a pre-packaged, bottled, or canned liquid tea beverage designed for immediate consumption without needing preparation. The United States ready-to-drink tea market is segmented by product type, packaging type, distribution channel, and functionality. By product type, the market is segmented into iced tea, green tea, herbal tea, and other RTD tea. By packaging type, the market is segmented into PET bottles, glass bottles, metal cans, aseptic packages, and disposable cups. By distribution channel, the market is segmented into on-trade and off-trade. By functionality, the market is segmented into antioxidant-rich, detox, and other. Market forecasts are provided in terms of value (USD) and volume (liters).
| Iced tea |
| Green tea |
| Herbal tea |
| Other RTD Tea |
| PET Bottles |
| Glass Bottles |
| Metal Can |
| Aseptic packages (tetra pak, cartons, pouches) |
| Disposable Cups |
| On-Trade | |
| Off-Trade | Supermarket/Hypermarket |
| Convenience Stores | |
| Specialty Stores | |
| Online Retail | |
| Other Distribution Channels |
| Antioxidant-Rich |
| Detox |
| Other |
| By Product Type | Iced tea | |
| Green tea | ||
| Herbal tea | ||
| Other RTD Tea | ||
| By Packaging Type | PET Bottles | |
| Glass Bottles | ||
| Metal Can | ||
| Aseptic packages (tetra pak, cartons, pouches) | ||
| Disposable Cups | ||
| By Distribution Channel | On-Trade | |
| Off-Trade | Supermarket/Hypermarket | |
| Convenience Stores | ||
| Specialty Stores | ||
| Online Retail | ||
| Other Distribution Channels | ||
| By Functionality | Antioxidant-Rich | |
| Detox | ||
| Other | ||


Market Definition
- Carbonated Soft Drinks (CSDs) - Carbonated soft drinks (CSDs) refer to non-alcoholic beverages that are carbonated and typically flavored, containing dissolved carbon dioxide to create effervescence. These beverages commonly include cola, lemon-lime, orange, and various fruit-flavored sodas. Marketed in cans, bottles, or fountain dispense.
- Juices - We have considered packaged juices which encompass non-alcoholic beverages derived from fruits, vegetables, or a combination thereof, processed and sealed in various packaging formats such as bottles, cartons, or pouches. Excluding fresh juices, this market segment involves commercially prepared and preserved juices, often with added preservatives and flavors.
- Ready-to-Drink (RTD) Tea and RTD Coffee - Ready-to-Drink (RTD) tea and RTD coffee are pre-packaged, non-alcoholic beverages that are brewed and prepared for consumption without further dilution. RTD tea typically includes various tea varieties, infused with flavors and sweeteners, and comes in bottles, cans, or cartons. Similarly, RTD coffee involves pre-brewed coffee formulations, often mixed with milk, sugar, or flavorings, and is conveniently packaged for on-the-go consumption.
- Energy Drinks - Energy drinks are non-alcoholic beverages formulated to provide a quick boost of energy and alertness. Whereas, sports drinks are beverages designed to hydrate and replenish electrolytes, particularly after physical exertion, exercise, or intense activity
| Keyword | Definition |
|---|---|
| Carbonated Soft Drinks | Carbonated soft drinks (CSDs) are a combination of carbonated water and flavouring, sweetened by sugar or a non-sugar sweeteners. |
| Standard Cola | Standard Cola is defined as the original flavor of cola soda. |
| Diet Cola | A cola-based soft drink containing no or low amounts of sugar |
| Fruit Flavored Carbonates | A carbonated beverage prepared from fruit juice/fruit flavor with carbonated water and containing sugar, dextrose, invert sugar or liquid glucose either singly or in combination. It may contain peel oil and fruit essences. |
| Juice | Juice is a drink made from the extraction or pressing of the natural liquid contained in fruit and vegetables. |
| 100% Juice | Fruit/vegetable juice made from fruit in the form of its juice with no water added to make up the volume. It is not permitted to add sugars, sweeteners, preservatives, flavourings or colourings to fruit juice. |
| Juice Drinks (up to 24% Juice) | Fruit/vegetable juice drinks with up to 24% fruits/vegetable extract. |
| Nectars (25-99% Juice) | Juices that can have between 25 and 99% of fruit, with the minimum legal limits defined depending on the type of fruit |
| Juice concentrates | Juice Concentrates are those form of juices when most of this liquid is removed resulting in a thick, syrupy product known as juice concentrate. |
| RTD Coffee | Packaged coffee beverages that are sold in a prepared form and are ready for consumption at the time of purchase. |
| Iced Coffee | An iced coffee is a cold version of coffee, usually a combination of hot espresso and milk with ice added to it. |
| Cold Brew Coffee | Cold brew also called cold water extraction or cold pressing is made by steeping ground coffee in room-temperature water for several hours. |
| RTD Tea | Ready-to-drink (RTD) tea is a packaged tea product ready for immediate consumption without brewing or preparation |
| Iced Tea | Ice tea or iced tea is a drink made from tea without milk but with sugar and sometimes fruit flavourings, drunk cold. |
| Green Tea | Green tea is a tea beverage which promotes mental alertness, relieving digestive symptoms and promoting weight loss. |
| Herbal Tea | Herbal tea beverages are made from the infusion or decoction of herbs, spices, or other plant material in hot water. |
| Energy Drink | A type of drink containing stimulant compounds, usually caffeine, which is marketed as providing mental and physical stimulation. They may or may not be carbonated and may also contain sugar, other sweeteners, or herbal extracts, among numerous possible ingredients. |
| Sugar-free or Low-calories Energy Drinks | Sugar-free or Low-calories Energy Drinks are sugar-free, artificially sweetened energy drinks with few or no calories. |
| Traditional Energy Drink | Traditional Energy Drinks are functional soft drinks containing ingredients designed to boost the consumer's energy. |
| Natural/Oraganic Energy Drinks | Natural/Organic energy drinks are energy drinks free of artificial sweeteners and synthetic colorings. Instead, they contain naturally derived ingredients such as green tea, yerba mate, and botanical extracts. |
| Energy Shots | A small but highly concentrated energy drink that contains large amounts of caffeine and/or other stimulants. The quantity is comparatively smaller compared to energy drinks. |
| Sports Drink | Sports drinks are beverages designed specifically for the rapid supply of fluid, carbohydrates, and electrolytes before, during or after exercise. |
| Isotonic | Isotonic drinks contain similar concentrations of salt and sugar as in the human body, and are designed to quickly replace fluids lost during exercise but with an increase of carbohydrate. |
| Hypertonic | Hypertonic drinks have a higher concentration of salt and sugar than the human body. They are best drunk after exercise as it is important to replace glycogen levels quickly after exercise. |
| Hypotonic | Hypotonic drinks are designed to quickly replace fluids lost during exercise. They have very low carbohydrate content and a lower concentration of salt and sugar than the human body. |
| Electrolyte-Enhanced Water | Electrolyte water is water infused with electrically-charged minerals, such as sodium, potassium, calcium, and magnesium. |
| Protein-based Sport Drinks | Protein-based sports drinks are those sports drinks which has added protein in it that will improve performance and reduce muscle protein breakdown. |
| On-Trade | The on-trade refers to places that sell beverages for immediate consumption on the premises like bars, restaurants, and pubs |
| Off-Trade | Off-trade usually means places like liquor stores, supermarkets and other places where you don't consume the beverage right away. |
| Convenience Store | A retail business that provides the public with a convenient location to quickly purchase a wide variety of consumable products and services, generally food and gasoline. |
| Specialty store | A specialty store is a shop/store that carries a deep assortment of brands, styles, or models within a relatively narrow category of goods |
| Online Retail | Online retail is a type of eCommerce whereby a business sells goods or services directly to consumers from a website. |
| Aseptic Packaging | Aseptic packaging refers to the filling of a cold, commercially sterile product under sterile conditions into a presterilized container and closure under sterile conditions to form a seal that effectively excludes microorganisms. These includes tetra packs, cartons, pouches etc. |
| PET Bottle | PET bottle means a bottle made of polyethylene terephthalate. |
| Metal Cans | Metal containers made of aluminum or tin- plated or zinc-plated steel, which are commonly used for packaging food, beverages or other products. |
| Disposable Cups | Disposable Cup means a cup or other container designed for single use to serve beverages, such as water, cold drinks, hot drinks and alcoholic beverages. |
| Gen Z | A way of referring to the group of people who were born in the late 1990s and early 2000s. |
| Millenial | Anyone born between 1981 and 1996 (ages 23 to 38 in 2019) is considered a Millennial |
| Taurine | Taurine is an amino acid that supports immune health and nervous system function. |
| Bars & Pubs | It is a drinking establishment licensed to serve alcoholic drinks for consumption on the premises. |
| Café | It is a foodservice establishment serving refreshments (mainly coffee) and light meals. |
| On the go | It means doing / dealing with while busily engaged with something and not diverting plans in order to accommodate. |
| Internet Penetration | The Internet Penetration Rate corresponds to the percentage of the total population of a given country or region that uses the Internet. |
| Vending Machine | A machine that dispenses small articles such as food, drinks, or cigarettes when a coin or token is inserted |
| Discount store | A discount store or discounter offers a retail format in which products are sold at prices that are in principle lower than an actual or supposed "full retail price". Discounters rely on bulk purchasing and efficient distribution to keep down costs. |
| Clean Label | Clean label on the beverage market are drinks that are made from few ingredients of natural origin and are not or only slightly processed. |
| Caffeine | An alkaloid compound which is a stimulant of the central nervous system. It is mainly used recreationally, as a mild cognitive enhancer to increase alertness and attentional performance. |
| Extreme sport | Action sports, adventure sports or extreme sports are activities perceived as involving a high degree of risk. |
| High-intensity interval training | It incorporates several rounds that alternate between several minutes of high intensity movements to significantly increase the heart rate to at least 80% of one's maximum heart rate, followed by short periods of lower intensity movements. |
| Shelf life | The length of time for which an item remains usable, fit for consumption, or saleable. |
| Cream Soda | Cream soda is a sweet soft drink. Generally flavored with vanilla and based on the taste of an ice cream float |
| Root Beer | Root beer is a sweet North American soft drink traditionally made using the root bark of the sassafras tree Sassafras albidum or the vine of Smilax ornata as the primary flavor. Root beer is typically, but not exclusively, non-alcoholic, caffeine-free, sweet, and carbonated. |
| Vanilla Soda | A carbonated soft drink flavoured with vanilla. |
| Dairy-Free | A product that does not contain any milk or milk products from cows, sheep or goats. |
| Caffeine-Free Energy Drinks | Caffeine-free energy drinks rely on other ingredients to boost the energy. Popular choices include amino acids, B vitamins, and electrolytes. |


Research Methodology
Mordor Intelligence follows a four-step methodology in all our reports.
- Step-1: IDENTIFY KEY VARIABLES: In order to build a robust forecasting methodology, the variables and factors identified in Step 1 are tested against available historical market numbers. Through an iterative process, the variables required for market forecast are set, and the model is built on the basis of these variables.
- Step-2: Build a Market Model: Market-size estimations for the forecast years are in nominal terms. Inflation is not a part of the pricing, and the average selling price (ASP) is kept constant throughout the forecast period for each country.
- Step-3: Validate and Finalize: In this important step, all market numbers, variables, and analyst calls are validated through an extensive network of primary research experts from the market studied. The respondents are selected across levels and functions to generate a holistic picture of the market studied.
- Step-4: Research Outputs: Syndicated reports, custom consulting assignments, databases & subscription platforms


