Market Overview
| Study Period | 2020 - 2030 |
|---|---|
| Forecast Data Period | 2025 - 2030 |
| Historical Data Period | 2020 - 2023 |
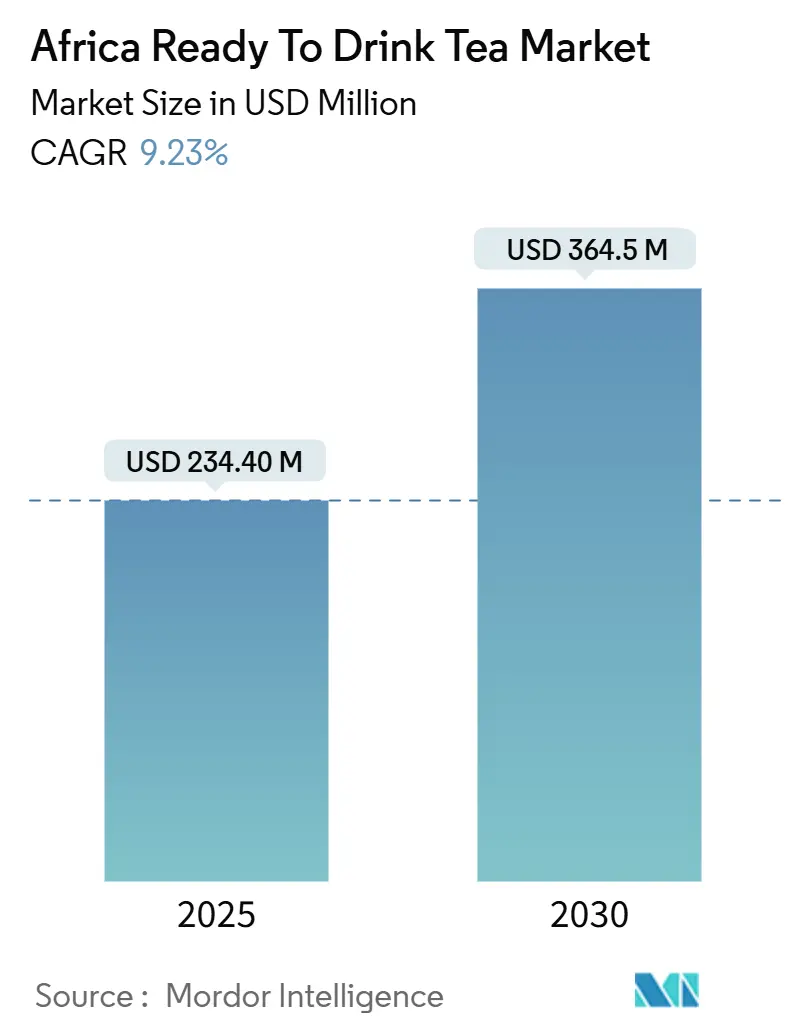
| Market Size (2025) | USD 234.40 Million |
| Market Size (2030) | USD 364.5 Million |
| Growth Rate (2025 - 2030) | 9.23% CAGR |
| Market Concentration | Medium |
Major Players *Disclaimer: Major Players sorted in no particular order Image © Mordor Intelligence. Reuse requires attribution under CC BY 4.0. | |
Africa Ready To Drink Tea Market Analysis by Mordor Intelligence
The Africa ready-to-drink tea market stands at USD 234.40 million in 2025 and is forecast to reach USD 364.50 million by 2030, advancing at a 9.23% compound annual growth rate (CAGR). This trajectory reflects the interplay of accelerating urbanization, a health-conscious middle class pivoting away from carbonated soft drinks, and infrastructure constraints that simultaneously throttle and reshape distribution models. Sub-Saharan Africa's GDP growth is projected to rise from 3.6% in 2024 to 4.2% in 2025, yet two-thirds of economies are undertaking fiscal tightening and borrowing costs remain elevated, creating a price-sensitive consumer base that demands functional benefits at accessible price points [1]Source: International Monetary Fund, “IMF's Sub-Saharan Africa Regional Economic Outlook: Reform Amid Great Expectations,” imf.org.
Key Report Takeaways
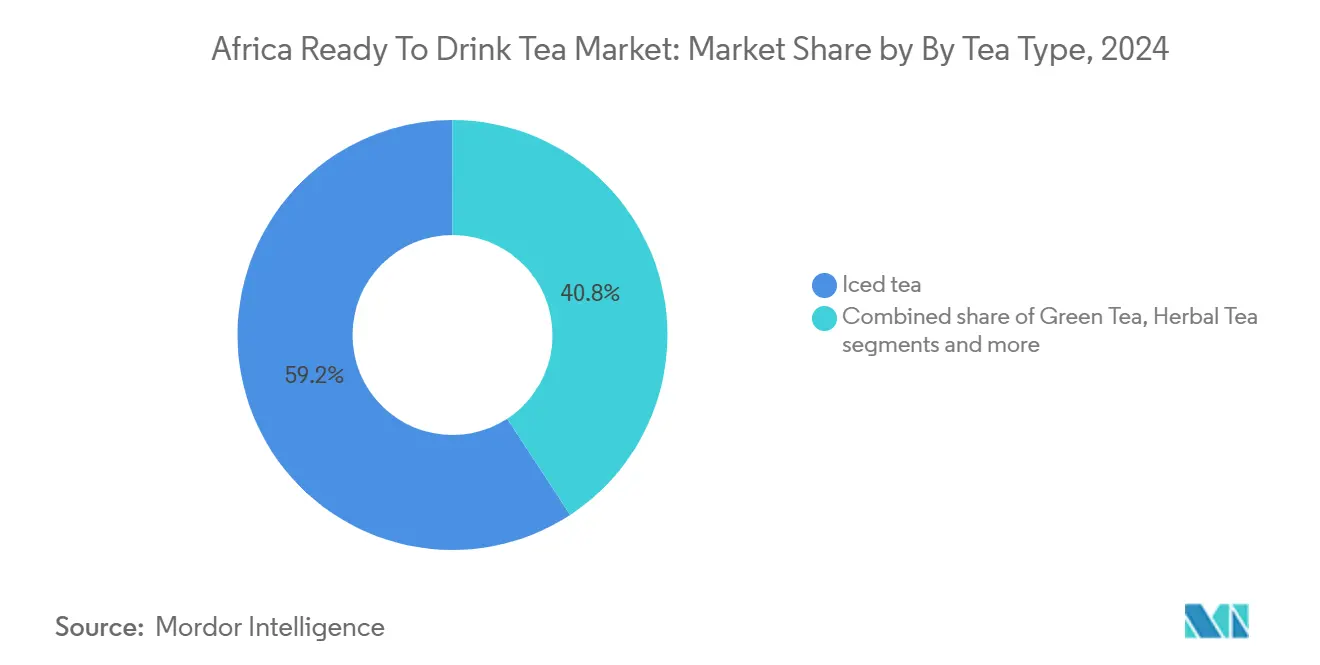
- By tea type, iced tea held 59.22% of 2024 revenue, while herbal tea is forecast to expand at a 10.61% CAGR between 2025 and 2030.
- By functionality, antioxidant-rich formulations captured 62.14% share in 2024; detox variants are projected to post a 10.45% CAGR through 2030.
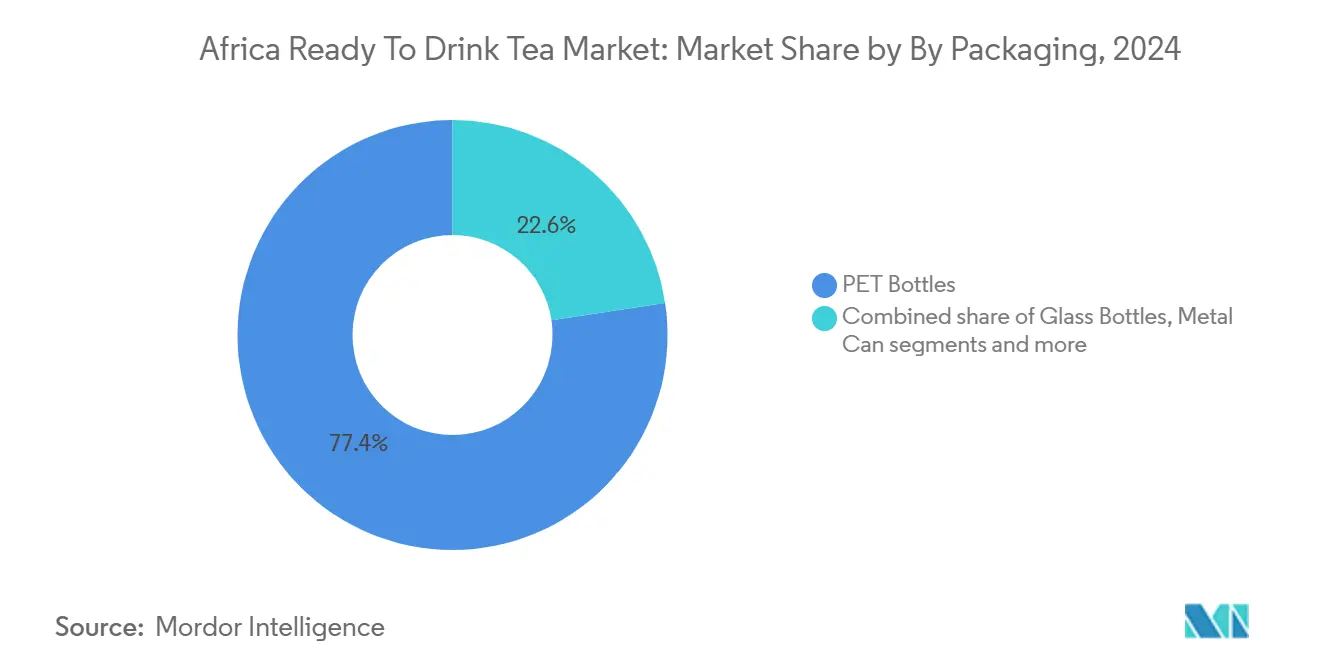
- By packaging, PET bottles commanded 77.37% of 2024 sales, and glass bottles show the fastest trajectory with a 10.33% CAGR for 2025-203.
- By distribution, off-trade outlets generated 95.03% of 2024 value, yet on-trade channels are expected to rise at a 12.28% CAGR as tourism and foodservice recover.
- By geography, South Africa led with 40.46% of 2024 market value, whereas Nigeria is projected to record the highest growth at a 9.78% CAGR to 2030.
Africa Ready To Drink Tea Market Trends and Insights
Drivers Impact Analysis*
| Driver | (~) % Impact on CAGR Forecast | Geographic Relevance | Impact Timeline |
|---|---|---|---|
| Urban on-the-go lifestyles among Africa's middle class | +2.1% | South Africa, Nigeria, Egypt, Kenya | Medium term (2-4 years) |
| Demand for healthier, low-sugar beverage alternatives | +1.8% | South Africa, Egypt, urban centers across Africa | Short term (≤ 2 years) |
| Rising wellness trends favoring antioxidant-rich teas | +1.5% | South Africa, Egypt, Nigeria, urban middle class | Medium term (2-4 years) |
| Convenience for urban consumers seeking non-carbonated options | +1.2% | Nigeria, Egypt, Kenya, urban hubs | Short term (≤ 2 years) |
| Growth in iced tea as a refreshing daily drink | +1.4% | South Africa, Egypt, Nigeria, Rest of Africa | Medium term (2-4 years) |
| Health-conscious positioning against sugary sodas | +1.3% | South Africa, Egypt, Nigeria | Short term (≤ 2 years) |
| Source: Mordor Intelligence | |||


Urban on-the-go lifestyles among Africa’s middle class
Africa's urban population is growing at twice the rate of rural areas, leading to an increase in time-constrained consumers who value portability and single-serve formats. In the Middle East and North Africa retail market, the food-to-go segment has witnessed significant growth, with Egypt standing out as a key market. This development indicates that grab-and-go beverages are no longer confined to a niche category. In Nigeria, 39% of the population are internet users, while in Egypt, consumers are expected to increase grocery spending, reflecting digital-native purchasing behaviors that favor ready-to-drink (RTD) formats over traditional loose-leaf preparation [2]Source: The World Bank Group, “Individuals using the Internet (% of population) - Nigeria,” data.worldbank.org. This shift is particularly evident in urban centers such as Greater Accra and Lagos. While convenience is a priority for consumers, 58% remain price-sensitive, compelling brands to balance premium positioning with affordable pricing. This dynamic explains the dominance of PET bottles in the market.
Demand for healthier, low-sugar beverage alternatives
South Africa's Health Promotion Levy, implemented in 2018 and indexed annually, has catalyzed reformulation across the beverage sector. The levy imposes ZAR 0.021 per gram of sugar exceeding 4 grams per 100 milliliters, effectively adding ZAR 0.63 to a 330-milliliter can with 35 grams of sugar [3]Source: The World Bank Group, “SSB tax designs,” worldbank.org. Consumers prioritizing health in purchasing decisions and showing willingness to pay more for sustainable products indicate that health claims can command price premiums. Nigeria's National Agency for Food and Drug Administration and Control (NAFDAC) enforces labeling standards that require clear sugar-content disclosure, pushing brands toward natural sweeteners and herbal infusions. The convergence of fiscal policy, consumer preference, and regulatory transparency is compressing the margin for high-sugar formulations.
Rising wellness trends favoring antioxidant-rich teas
Rooibos tea, native to South Africa's Western Cape, contains aspalathin, a dihydrochalcone known for its antioxidant and anti-inflammatory properties. Peer-reviewed research published in 2024 highlighted that rooibos consumption enhances cardiovascular biomarkers and lipid profiles, making it a suitable functional ingredient for ready-to-drink (RTD) formulations aimed at supporting metabolic health. The growing consumer demand for health-focused beverages has positioned rooibos tea as a key driver in the RTD tea market. Its natural health benefits, combined with its unique flavor profile, appeal to health-conscious consumers seeking alternatives to traditional sugary drinks. Additionally, the increasing awareness of functional ingredients in beverages has further boosted the adoption of rooibos tea in RTD formulations, contributing to market growth.
Convenience for urban consumers seeking non-carbonated option
Carbonated soft drinks face challenges due to sugar taxes and shifting health perceptions; however, they continue to benefit from widespread distribution and strong brand equity. Ready-to-drink (RTD) tea holds a competitive advantage as a naturally derived, lower-calorie option that requires no preparation. This positioning aligns with growing consumer preferences for healthier beverage choices, particularly among health-conscious individuals and younger demographics. The convenience of RTD tea, combined with its perceived health benefits, makes it an appealing alternative to traditional sugary beverages. Additionally, the increasing awareness of natural and organic ingredients further supports the demand for RTD tea, as consumers seek products that align with their lifestyle and dietary goals. According to Nigeria's USDA FAS Retail Foods report, 72% of food and beverage sales occur through traditional markets, 25% through convenience stores, and only 3% via supermarkets [4]Source: USDA Foreign Agricultural Service, “Report Name: Retail Foods Annual - Nigeria,” fas.usda.gov. This highlights the significance of ambient-stable packaging capable of withstanding the conditions of informal retail environments. PET bottles, with a 77.37% market share, are favored for their durability, lightweight nature, and ability to endure high-temperature storage, which is essential in regions with inconsistent refrigeration.
Restraints Impact Analysis*
| Restraint | (~) % Impact on CAGR Forecast | Geographic Relevance | Impact Timeline |
|---|---|---|---|
| Competition from carbonated soft drinks and juices | -0.8% | South Africa, Nigeria, Egypt, Rest of Africa | Short term (≤ 2 years) |
| Sugar taxes and labeling regulations | -0.5% | South Africa, Botswana, Mauritius, Nigeria (proposed) | Medium term (2-4 years) |
| Inflation-driven cost increases for tea leaves | -0.6% | Kenya (supplier), Egypt, Nigeria, South Africa | Short term (≤ 2 years) |
| Limited cold storage in distribution networks | -0.7% | Nigeria, Rest of Africa, rural South Africa | Long term (≥ 4 years) |
| Source: Mordor Intelligence | |||
Competition from carbonated soft drinks and juices
Coca-Cola and PepsiCo's entrenched distribution networks, brand recognition, and price competitiveness create formidable barriers for RTD tea entrants. Coca-Cola's USD 1 billion Nigeria investment announced in 2024 includes capacity expansion for carbonated and non-carbonated beverages, signaling that incumbents are defending share by diversifying portfolios rather than ceding shelf space. Varun Beverages' acquisition of BevCo South Africa for ZAR 3 billion in 2024 integrates PepsiCo's carbonated portfolio with BevCo's township distribution, leveraging 150,000 spaza shops to cross-sell RTD tea alongside CSDs. Moreover, Juice concentrates and nectars command lower price points than RTD tea due to economies of scale and ingredient costs. RTD tea brands must therefore emphasize functional differentiation, such as antioxidant content, caffeine modulation, or probiotic infusion, to justify premium pricing and resist commoditization
Limited cold storage in distribution networks
The Global Cold Chain Alliance's 2024 Africa assessment identified energy unreliability, skills shortages, and trade barriers as primary constraints on refrigerated logistics. South Africa's load-shedding reduced cold-chain reliability, forcing distributors to invest in backup generators and solar installations. Nigeria's 72% traditional-market share and 25% convenience-store penetration reflect the dominance of ambient-temperature retail, where RTD tea must compete with shelf-stable juices and carbonated drinks that tolerate heat exposure. Maersk's 2024 Southern Africa cold-chain report notes that IoT-enabled temperature monitoring and blockchain traceability can reduce spoilage, yet adoption remains limited to large-scale operators, leaving small and medium distributors reliant on manual processes. This infrastructure gap constrains RTD tea's rural penetration and necessitates aseptic packaging or preservative formulations that extend ambient shelf life without refrigeration.
*Our forecasts treat driver/restraint impacts as directional, not additive. The impact forecasts reflect baseline growth, mix effects, and variable interactions.
Segment Analysis
By Tea Type: Herbal Variants Outpace Traditional Iced Tea
Iced tea accounted for a 59.22% market share in 2024, while herbal tea is projected to grow at a CAGR of 10.61% from 2025 to 2030. This divergence reflects consumer migration toward functional botanicals such as rooibos, honeybush, and baobab, which offer caffeine-free positioning and clinically supported health benefits. Peer-reviewed research published in 2024 demonstrated that rooibos aspalathin improves cardiovascular biomarkers and lipid profiles, providing a scientific foundation for wellness claims that resonate with health-conscious urban consumers. Iced tea retains dominance due to established taste preferences, ambient-stable PET packaging.
Green tea represents a niche premium segment, primarily attracting urban millennials who are influenced by Asian wellness trends. This demographic's growing interest in health and wellness has driven demand for green tea, as it is perceived as a healthier alternative to traditional sugary beverages. These local teas, known for their caffeine-free and naturally sweet profiles, cater to broader consumer preferences, limiting green tea's penetration. Other ready-to-drink (RTD) tea variants, including specialty blends, are still in the early stages of development, facing challenges such as cold-chain logistics and low consumer awareness outside major metropolitan areas. Despite these challenges, the increasing urbanization and exposure to global wellness trends are expected to gradually drive the growth of RTD tea products, including green tea and specialty blends, in the region.


By Functionality: Detox Formulations Gain Traction
The antioxidant-rich segment is expected to hold a 62.14% market share in 2024. Meanwhile, the detox functionality segment is projected to grow at a CAGR of 10.45% from 2025 to 2030. This trend highlights increasing consumer demand for targeted health benefits beyond general wellness, with detox products leveraging ingredients such as senna, ginger, chicory root fiber, and probiotics. The rising preference for functional beverages, including ready-to-drink (RTD) teas, is a key driver for this growth. Consumers are increasingly seeking convenient options that align with their health and wellness goals, making RTD teas with antioxidant and detox properties highly appealing. Antioxidant-rich formulations maintain their majority share, driven by rooibos's established reputation and peer-reviewed evidence supporting its cardiovascular benefits. However, brands must consistently update ingredient combinations to prevent commoditization and sustain consumer interest.
Other functional variants, such as energy-boosting teas containing guarana or yerba mate, remain limited due to regulatory scrutiny of stimulant-related claims and consumer preference for caffeine-free relaxation options. However, the growing demand for functional beverages that offer additional health benefits is driving innovation in the ready-to-drink (RTD) tea market. Consumers are increasingly seeking products that align with their health and wellness goals, such as teas that provide energy boosts or stress relief. This trend is encouraging manufacturers to explore new formulations and ingredients, despite regulatory challenges, to cater to the evolving preferences of health-conscious consumers. Health considerations continue to influence consumer purchasing decisions, further supporting the growth of the RTD tea market.
By Packaging Type: Glass Bottles Signal Premiumization
PET bottles accounted for 77.37% of the market share in 2024, while glass bottles are expected to grow at a compound annual growth rate (CAGR) of 10.33% from 2025 to 2030. This trend highlights two distinct developments: the widespread use of lightweight, shatter-resistant PET bottles for ambient distribution in mass markets, and the increasing adoption of returnable glass systems driven by premiumization and sustainability-focused consumers. An example of this is Kenya Breweries' Project Rudisha, which successfully collected 5.76 million returnable glass spirits bottles within three months from 2023 to 2024. This initiative underscores the potential of closed-loop systems in African markets, although successful implementation depends on the establishment of deposit-refund infrastructure and consumer education.
Metal cans and aseptic packages occupy niche roles, with cans favored for carbonated RTD tea variants and aseptic cartons used for shelf-stable formats targeting rural distribution. Disposable cups serve on-premise consumption in cafes and hotels, yet their environmental footprint and single-use nature conflict with sustainability mandates. The 10.33% glass CAGR suggests that brands can leverage returnable systems and premium positioning to differentiate, yet mass-market penetration will remain PET-dominated until collection and recycling infrastructure scales.
By Distribution Channel: On-Trade Recovery Accelerates
Off-trade channels retain a 95.03% market share in 2024. On-trade channels are projected to grow at a CAGR of 12.28% from 2025 to 2030, driven by recovery from pandemic-related closures and the expansion of tourism. Egypt's target of 30 million tourists by 2028, up from 15.7 million in 2024, will drive hotel, restaurant, and institutional demand for RTD tea, with USDA FAS analysis ranking tea among the top three growth consumer-oriented products. Ghana's hotel sector generated approximately USD 2 billion in revenue in 2023, signaling robust foodservice demand. Egypt's 18,300 quick-service restaurants and expanding cafe sector, where Egyptians consume 20 million cups of coffee daily, present cross-selling opportunities for RTD tea positioned as a cold, refreshing alternative.
Off-trade dominance highlights Africa's retail structure, characterized by traditional markets and spaza shops. Convenience stores and specialty outlets cater to on-the-go consumption. This retail structure serves as a significant driver for the ready-to-drink (RTD) tea market, as it enables widespread availability and accessibility of RTD tea products through off-trade channels. The 12.28% on-trade CAGR indicates the need for brands to adopt dual distribution strategies: mass-market PET formats to ensure off-trade availability and premium glass or can formats to achieve on-premise differentiation. The combination of these strategies allows RTD tea brands to effectively target diverse consumer preferences and consumption occasions, further driving market growth.
Geography Analysis
South Africa holds 40.46% of 2024 market share, anchored by established cold-chain infrastructure, regulatory frameworks such as the Health Promotion Levy, and a concentrated retail landscape where Shoprite, Pick n Pay, and Woolworths command significant shelf space. The Health Promotion Levy, which imposes ZAR 0.021 per gram of sugar above 4 grams per 100 milliliters, generated ZAR 6.5 billion in revenue by 2024 and drove a 28% reduction in sugar content across taxed beverages, creating a regulatory tailwind for low-sugar RTD teas.
Nigeria is forecast to grow at 9.78% CAGR from 2025 to 2030, driven by Coca-Cola's USD 1 billion investment announced in 2024, a population exceeding 200 million, and rising smartphone penetration enabling e-commerce channels. NAFDAC enforces labeling standards that require clear sugar-content disclosure and ingredient substantiation, pushing brands toward natural sweeteners and herbal infusions. The 9.78% CAGR reflects Nigeria's demographic dividend and urbanization trajectory, yet success demands ambient-stable PET packaging, township distribution partnerships, and value-for-money positioning to navigate price sensitivity.
Egypt, with 117 million residents and 15.7 million tourists in 2024, presents a dual opportunity in retail and hotel-restaurant-institutional channels. USDA FAS analysis ranks tea among the top three growth consumer-oriented products, with tourism expansion targeting 30 million visitors by 2028 driving hotel and foodservice demand. Egyptian consumers anticipating higher grocery spending, with strong health priorities and willingness to pay more for sustainable products, indicate receptivity to premium RTD tea positioning. However, small local grocers dominate retail sales, and importers face high tariffs, complex regulations, and foreign-currency access constraints, necessitating partnerships with Egyptian distributors and digital procurement platforms such as Horeca Star and OneOrder.
Competitive Landscape
The Africa ready-to-drink tea market exhibits moderate fragmentation where global incumbents Coca-Cola, PepsiCo, and Nestlé leverage scale and cold-chain partnerships, while regional specialists BOS Brands, CWAY Group, and Clover exploit local botanical knowledge and township distribution networks. Varun Beverages' ZAR 3 billion acquisition of BevCo South Africa in 2024 exemplifies consolidation momentum, targeting 150,000 spaza shops and the R900 billion township economy to cross-sell PepsiCo's carbonated portfolio alongside RTD tea.
Strategy patterns emphasize dual-brand portfolios (carbonated and non-carbonated), functional ingredient differentiation (rooibos, baobab, probiotics), and sustainability positioning via returnable glass and rPET content. White-space opportunities include rural penetration through ambient-stable aseptic packaging, on-trade premiumization via glass bottles and specialty blends, and e-commerce direct-to-consumer models.
Emerging disruptors such as Carmién, Lady Boba, and GoodGut leverage niche positioning, CBD-infused rooibos, bubble tea formats, and gut-health probiotics, to capture urban millennials willing to pay premiums for targeted wellness benefits. Competitive intensity will escalate as sugar taxes expand beyond South Africa to Nigeria and other jurisdictions, compressing margins for high-sugar formulations and rewarding brands that invest in low-sugar, functional, and sustainably packaged RTD teas aligned with regulatory and consumer preferences.
Africa Ready To Drink Tea Industry Leaders
BOS Brands (Pty) Ltd
PepsiCo, Inc.
Tata Consumer Products Ltd
The Coca-Cola Company
CWAY Group
- *Disclaimer: Major Players sorted in no particular order

Recent Industry Developments
- September 2024: Coca-Cola announced a USD 1 billion investment in Nigeria over five years, covering capacity expansion for carbonated and non-carbonated beverages, distribution infrastructure upgrades, and market penetration initiatives
- March 2024: Varun Beverages (PepsiCo franchisee) acquired BevCo South Africa for ZAR 3 billion, gaining access to 150,000 spaza shops, the R900 billion township economy, and BevCo's distribution network to cross-sell PepsiCo's carbonated and non-carbonated portfolio, including potential RTD tea expansion
- February 2021: BOS Brands ramped up its direct-to-consumer offerings through a new subscription service. This service makes BOS products available to consumers directly from the brand, and at a discounted rate for monthly orders.


Africa Ready To Drink Tea Market Report Scope
Green Tea, Herbal Tea, Iced Tea are covered as segments by Soft Drink Type. Aseptic packages, Glass Bottles, Metal Can, PET Bottles are covered as segments by Packaging Type. Off-trade, On-trade are covered as segments by Distribution Channel. Egypt, Nigeria, South Africa are covered as segments by Country.By Tea Type
| Iced tea |
| Green tea |
| Herbal tea |
| Other RTD Tea |
By Functionality
| Antioxidant-Rich |
| Detox |
| Other |
By Packaging Type
| PET Bottles |
| Glass Bottles |
| Metal Can |
| Aseptic Packages |
| Disposable Cups |
By Distribution Channel
| On-Trade | |
| Off-Trade | Supermarket/Hypermarket |
| Convenience Stores | |
| Specialty Stores | |
| Online Retail | |
| Other Distribution Channels |
By Country
| South Africa |
| Egypt |
| Nigeria |
| Rest of Africa |
| By Tea Type | Iced tea | |
| Green tea | ||
| Herbal tea | ||
| Other RTD Tea | ||
| By Functionality | Antioxidant-Rich | |
| Detox | ||
| Other | ||
| By Packaging Type | PET Bottles | |
| Glass Bottles | ||
| Metal Can | ||
| Aseptic Packages | ||
| Disposable Cups | ||
| By Distribution Channel | On-Trade | |
| Off-Trade | Supermarket/Hypermarket | |
| Convenience Stores | ||
| Specialty Stores | ||
| Online Retail | ||
| Other Distribution Channels | ||
| By Country | South Africa | |
| Egypt | ||
| Nigeria | ||
| Rest of Africa | ||


Market Definition
- Carbonated Soft Drinks (CSDs) - Carbonated soft drinks (CSDs) refer to non-alcoholic beverages that are carbonated and typically flavored, containing dissolved carbon dioxide to create effervescence. These beverages commonly include cola, lemon-lime, orange, and various fruit-flavored sodas. Marketed in cans, bottles, or fountain dispense.
- Juices - We have considered packaged juices which encompass non-alcoholic beverages derived from fruits, vegetables, or a combination thereof, processed and sealed in various packaging formats such as bottles, cartons, or pouches. Excluding fresh juices, this market segment involves commercially prepared and preserved juices, often with added preservatives and flavors.
- Ready-to-Drink (RTD) Tea and RTD Coffee - Ready-to-Drink (RTD) tea and RTD coffee are pre-packaged, non-alcoholic beverages that are brewed and prepared for consumption without further dilution. RTD tea typically includes various tea varieties, infused with flavors and sweeteners, and comes in bottles, cans, or cartons. Similarly, RTD coffee involves pre-brewed coffee formulations, often mixed with milk, sugar, or flavorings, and is conveniently packaged for on-the-go consumption.
- Energy Drinks - Energy drinks are non-alcoholic beverages formulated to provide a quick boost of energy and alertness. Whereas, sports drinks are beverages designed to hydrate and replenish electrolytes, particularly after physical exertion, exercise, or intense activity
| Keyword | Definition |
|---|---|
| Carbonated Soft Drinks | Carbonated soft drinks (CSDs) are a combination of carbonated water and flavouring, sweetened by sugar or a non-sugar sweeteners. |
| Standard Cola | Standard Cola is defined as the original flavor of cola soda. |
| Diet Cola | A cola-based soft drink containing no or low amounts of sugar |
| Fruit Flavored Carbonates | A carbonated beverage prepared from fruit juice/fruit flavor with carbonated water and containing sugar, dextrose, invert sugar or liquid glucose either singly or in combination. It may contain peel oil and fruit essences. |
| Juice | Juice is a drink made from the extraction or pressing of the natural liquid contained in fruit and vegetables. |
| 100% Juice | Fruit/vegetable juice made from fruit in the form of its juice with no water added to make up the volume. It is not permitted to add sugars, sweeteners, preservatives, flavourings or colourings to fruit juice. |
| Juice Drinks (up to 24% Juice) | Fruit/vegetable juice drinks with up to 24% fruits/vegetable extract. |
| Nectars (25-99% Juice) | Juices that can have between 25 and 99% of fruit, with the minimum legal limits defined depending on the type of fruit |
| Juice concentrates | Juice Concentrates are those form of juices when most of this liquid is removed resulting in a thick, syrupy product known as juice concentrate. |
| RTD Coffee | Packaged coffee beverages that are sold in a prepared form and are ready for consumption at the time of purchase. |
| Iced Coffee | An iced coffee is a cold version of coffee, usually a combination of hot espresso and milk with ice added to it. |
| Cold Brew Coffee | Cold brew also called cold water extraction or cold pressing is made by steeping ground coffee in room-temperature water for several hours. |
| RTD Tea | Ready-to-drink (RTD) tea is a packaged tea product ready for immediate consumption without brewing or preparation |
| Iced Tea | Ice tea or iced tea is a drink made from tea without milk but with sugar and sometimes fruit flavourings, drunk cold. |
| Green Tea | Green tea is a tea beverage which promotes mental alertness, relieving digestive symptoms and promoting weight loss. |
| Herbal Tea | Herbal tea beverages are made from the infusion or decoction of herbs, spices, or other plant material in hot water. |
| Energy Drink | A type of drink containing stimulant compounds, usually caffeine, which is marketed as providing mental and physical stimulation. They may or may not be carbonated and may also contain sugar, other sweeteners, or herbal extracts, among numerous possible ingredients. |
| Sugar-free or Low-calories Energy Drinks | Sugar-free or Low-calories Energy Drinks are sugar-free, artificially sweetened energy drinks with few or no calories. |
| Traditional Energy Drink | Traditional Energy Drinks are functional soft drinks containing ingredients designed to boost the consumer's energy. |
| Natural/Oraganic Energy Drinks | Natural/Organic energy drinks are energy drinks free of artificial sweeteners and synthetic colorings. Instead, they contain naturally derived ingredients such as green tea, yerba mate, and botanical extracts. |
| Energy Shots | A small but highly concentrated energy drink that contains large amounts of caffeine and/or other stimulants. The quantity is comparatively smaller compared to energy drinks. |
| Sports Drink | Sports drinks are beverages designed specifically for the rapid supply of fluid, carbohydrates, and electrolytes before, during or after exercise. |
| Isotonic | Isotonic drinks contain similar concentrations of salt and sugar as in the human body, and are designed to quickly replace fluids lost during exercise but with an increase of carbohydrate. |
| Hypertonic | Hypertonic drinks have a higher concentration of salt and sugar than the human body. They are best drunk after exercise as it is important to replace glycogen levels quickly after exercise. |
| Hypotonic | Hypotonic drinks are designed to quickly replace fluids lost during exercise. They have very low carbohydrate content and a lower concentration of salt and sugar than the human body. |
| Electrolyte-Enhanced Water | Electrolyte water is water infused with electrically-charged minerals, such as sodium, potassium, calcium, and magnesium. |
| Protein-based Sport Drinks | Protein-based sports drinks are those sports drinks which has added protein in it that will improve performance and reduce muscle protein breakdown. |
| On-Trade | The on-trade refers to places that sell beverages for immediate consumption on the premises like bars, restaurants, and pubs |
| Off-Trade | Off-trade usually means places like liquor stores, supermarkets and other places where you don't consume the beverage right away. |
| Convenience Store | A retail business that provides the public with a convenient location to quickly purchase a wide variety of consumable products and services, generally food and gasoline. |
| Specialty store | A specialty store is a shop/store that carries a deep assortment of brands, styles, or models within a relatively narrow category of goods |
| Online Retail | Online retail is a type of eCommerce whereby a business sells goods or services directly to consumers from a website. |
| Aseptic Packaging | Aseptic packaging refers to the filling of a cold, commercially sterile product under sterile conditions into a presterilized container and closure under sterile conditions to form a seal that effectively excludes microorganisms. These includes tetra packs, cartons, pouches etc. |
| PET Bottle | PET bottle means a bottle made of polyethylene terephthalate. |
| Metal Cans | Metal containers made of aluminum or tin- plated or zinc-plated steel, which are commonly used for packaging food, beverages or other products. |
| Disposable Cups | Disposable Cup means a cup or other container designed for single use to serve beverages, such as water, cold drinks, hot drinks and alcoholic beverages. |
| Gen Z | A way of referring to the group of people who were born in the late 1990s and early 2000s. |
| Millenial | Anyone born between 1981 and 1996 (ages 23 to 38 in 2019) is considered a Millennial |
| Taurine | Taurine is an amino acid that supports immune health and nervous system function. |
| Bars & Pubs | It is a drinking establishment licensed to serve alcoholic drinks for consumption on the premises. |
| Café | It is a foodservice establishment serving refreshments (mainly coffee) and light meals. |
| On the go | It means doing / dealing with while busily engaged with something and not diverting plans in order to accommodate. |
| Internet Penetration | The Internet Penetration Rate corresponds to the percentage of the total population of a given country or region that uses the Internet. |
| Vending Machine | A machine that dispenses small articles such as food, drinks, or cigarettes when a coin or token is inserted |
| Discount store | A discount store or discounter offers a retail format in which products are sold at prices that are in principle lower than an actual or supposed "full retail price". Discounters rely on bulk purchasing and efficient distribution to keep down costs. |
| Clean Label | Clean label on the beverage market are drinks that are made from few ingredients of natural origin and are not or only slightly processed. |
| Caffeine | An alkaloid compound which is a stimulant of the central nervous system. It is mainly used recreationally, as a mild cognitive enhancer to increase alertness and attentional performance. |
| Extreme sport | Action sports, adventure sports or extreme sports are activities perceived as involving a high degree of risk. |
| High-intensity interval training | It incorporates several rounds that alternate between several minutes of high intensity movements to significantly increase the heart rate to at least 80% of one's maximum heart rate, followed by short periods of lower intensity movements. |
| Shelf life | The length of time for which an item remains usable, fit for consumption, or saleable. |
| Cream Soda | Cream soda is a sweet soft drink. Generally flavored with vanilla and based on the taste of an ice cream float |
| Root Beer | Root beer is a sweet North American soft drink traditionally made using the root bark of the sassafras tree Sassafras albidum or the vine of Smilax ornata as the primary flavor. Root beer is typically, but not exclusively, non-alcoholic, caffeine-free, sweet, and carbonated. |
| Vanilla Soda | A carbonated soft drink flavoured with vanilla. |
| Dairy-Free | A product that does not contain any milk or milk products from cows, sheep or goats. |
| Caffeine-Free Energy Drinks | Caffeine-free energy drinks rely on other ingredients to boost the energy. Popular choices include amino acids, B vitamins, and electrolytes. |


Research Methodology
Mordor Intelligence follows a four-step methodology in all our reports.
- Step-1: IDENTIFY KEY VARIABLES: In order to build a robust forecasting methodology, the variables and factors identified in Step 1 are tested against available historical market numbers. Through an iterative process, the variables required for market forecast are set, and the model is built on the basis of these variables.
- Step-2: Build a Market Model: Market-size estimations for the forecast years are in nominal terms. Inflation is not a part of the pricing, and the average selling price (ASP) is kept constant throughout the forecast period for each country.
- Step-3: Validate and Finalize: In this important step, all market numbers, variables, and analyst calls are validated through an extensive network of primary research experts from the market studied. The respondents are selected across levels and functions to generate a holistic picture of the market studied.
- Step-4: Research Outputs: Syndicated reports, custom consulting assignments, databases & subscription platforms


