Market Overview
| Study Period | 2018 - 2031 |
|---|---|
| Forecast Data Period | 2026 - 2031 |
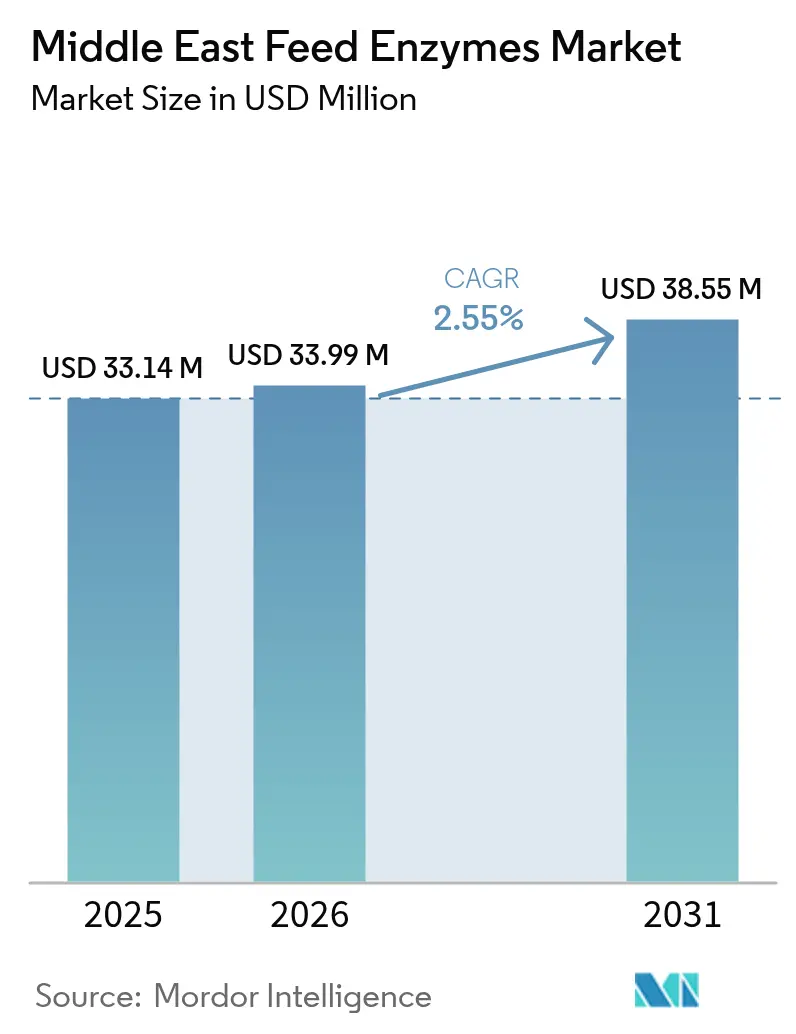
| Base Year Market Size (2025) | USD 33.14 Million |
| Market Size (2026) | USD 33.99 Million |
| Market Size (2031) | USD 38.55 Million |
| Growth Rate (2026 - 2031) | 2.55% CAGR |
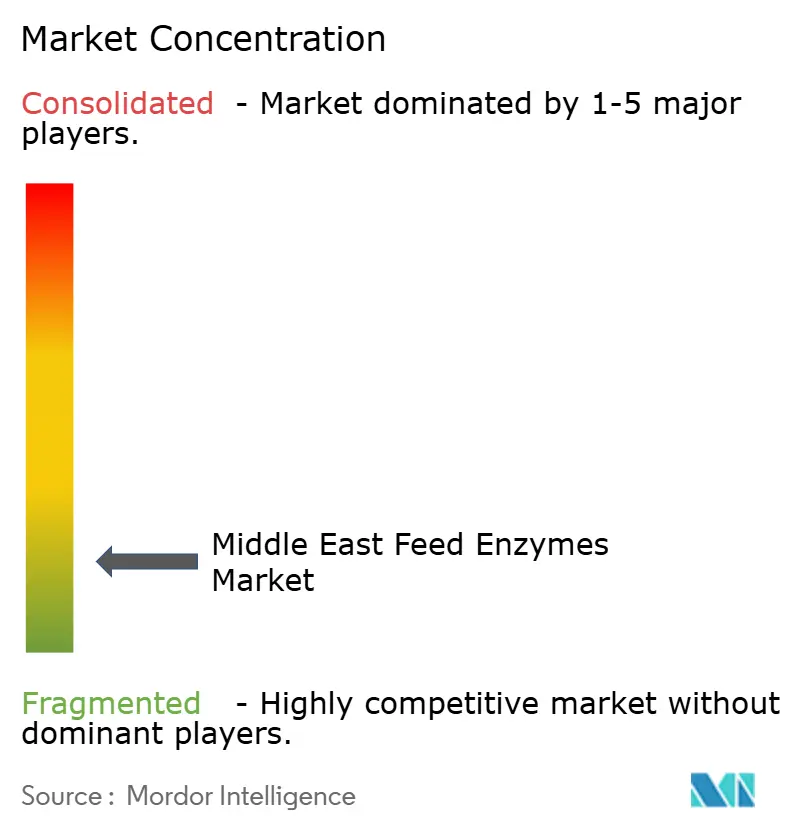
| Market Concentration | Low |
Major Players *Disclaimer: Major Players sorted in no particular order Image © Mordor Intelligence. Reuse requires attribution under CC BY 4.0. | |
Middle East Feed Enzymes Market Analysis by Mordor Intelligence
Middle East feed enzymes market size in 2026 is estimated at USD 33.99 million, growing from 2025 value of USD 33.14 million with 2031 projections showing USD 38.55 million, growing at 2.55% CAGR over 2026-2031. Growth stems from Vision 2030-linked agricultural modernization, rising regional protein demand, and the expanding industrial poultry base that now dominates regional feed consumption patterns. Strategic investments in biotechnology infrastructure, greater adoption of heat-stable multi-enzyme blends underpin the current growth trajectory. Cost pressures from imported corn-soy diets, volatile additive tariffs, and thermal denaturation challenges temper the pace but also spur innovation in enzyme stabilization and localized manufacturing. Increasing aquaculture capacity along the Red Sea and a shift toward insect-meal-based feed further widen application breadth for enzyme suppliers as sustainability imperatives intensify.
Key Report Takeaways
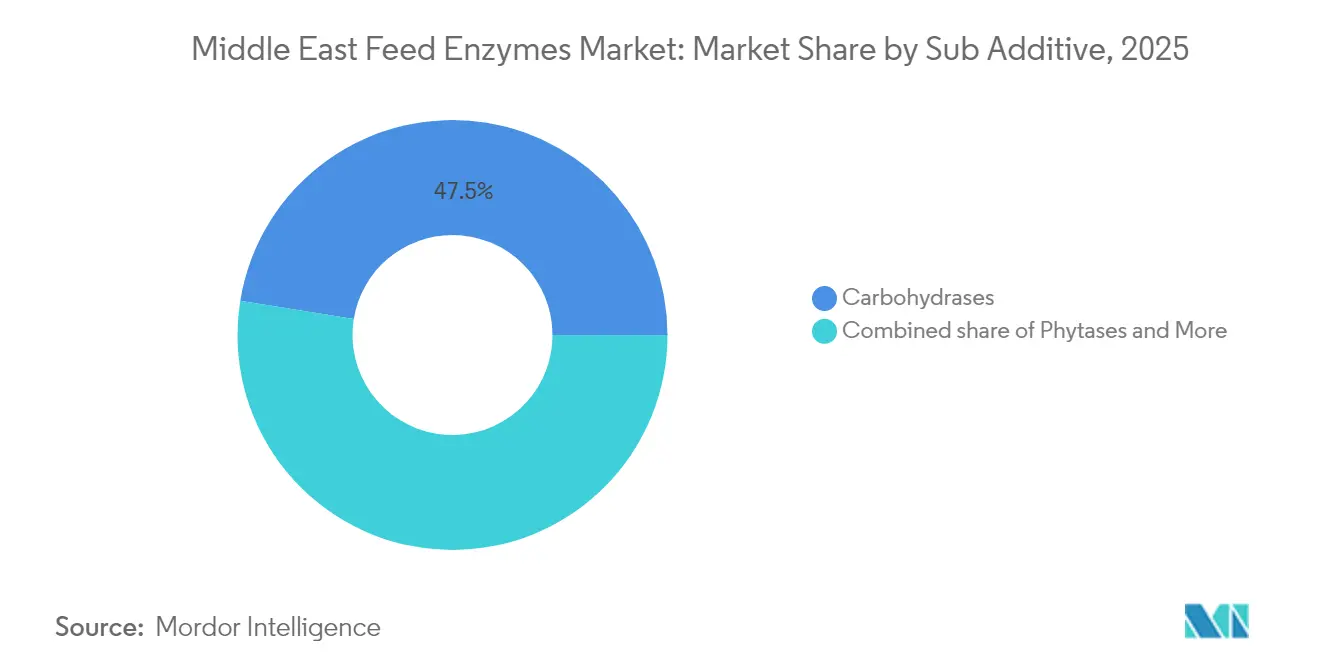
- By sub-additive, carbohydrases captured 47.45% of Middle East feed enzymes market share in 2025, while other enzymes recorded the highest projected CAGR at 2.64% to 2031
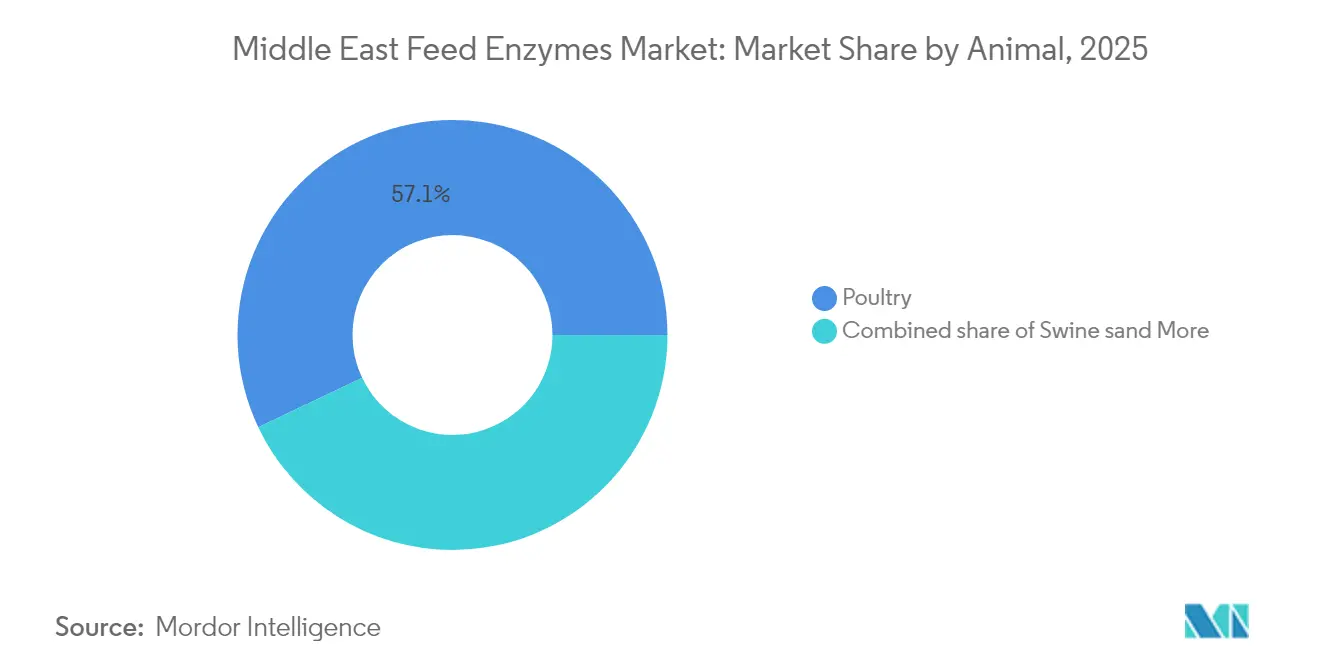
- By animal, the poultry segment commanded 57.05% share of the Middle East feed enzymes market size in 2025 and is advancing at a 2.66% CAGR through 2031.
- By geography, Saudi Arabia held 39.65% of the market share in 2025, while Iran recorded the highest projected CAGR at 2.85% to 2031.
Note: Market size and forecast figures in this report are generated using Mordor Intelligence’s proprietary estimation framework, updated with the latest available data and insights as of 2026.
Middle East Feed Enzymes Market Trends and Insights
Drivers Impact Analysis*
| Driver | (~)% Impact on CAGR Forecast | Geographic Relevance | Impact Timeline |
|---|---|---|---|
| Growth of regional industrial poultry farming | +0.8% | Saudi Arabia, UAE, primary; spillover to Kuwait, Qatar | Medium term (2-4 years) |
| Rising demand for protein-rich diets in Gulf countries | +0.6% | GCC countries, with the highest impact in Saudi Arabia and UAE | Long term (≥ 4 years) |
| The government pushes for feed self-sufficiency (Saudi Vision 2030) | +0.5% | Saudi Arabia's primary regional demonstration effects | Long term (≥ 4 years) |
| Cost savings from phytase-driven phosphorus reduction | +0.4% | Global, with a higher impact in the import-dependent Middle East | Short term (≤ 2 years) |
| Surge in aquaculture investments along the Red Sea coast | +0.3% | Saudi Arabia, Egypt, and the Red Sea regions | Medium term (2-4 years) |
| Expansion of enzyme-treated insect meal as a sustainable input | +0.2% | Regional pilot programs, early adoption in the UAE and Saudi Arabia | Long term (≥ 4 years) |
| Source: Mordor Intelligence | |||
Growth of Regional Industrial Poultry Farming
Saudi Arabia’s Balady Foods invested SAR 1.14 billion (USD 304 million) in new broiler infrastructure in 2024, while Tanmiah added 100 broiler houses the same year[1]Source: Novonesis, “Novonesis – The Time for Biosolutions Is Now,” novonesis.com. Large-scale, climate-controlled operations standardize feed conversion protocols, embedding enzyme supplementation as a cost-efficient lever that improves feed efficiency by up to 12%. Consistent grain quality challenges increase the value of tailor-made xylanase- and glucanase-rich carbohydrase blends designed for imported corn-soy diets. Supplier collaboration with integrators accelerates formulation refinement, cementing long-term enzyme adoption as poultry remains the region’s dominant meat source.
Rising Demand for Protein-Rich Diets in Gulf Countries
Per-capita consumption studies conducted in 2024 show that 58% of Saudi adults now eat three to four protein-anchored meals daily, with meat-filled snacks accounting for 20.1% of snacking occasions[2]Source: Hassan M. Bukhari, “Dietary Habits for Adults in Saudi Arabia,” Universal Journal of Public Health, ujph.edu.sa. Urbanization and rising disposable income expand retail poultry sales, prompting feed mills to maximize feed conversion through reliable multi-enzyme packages. Nutrition-driven purchasing trends sustain a demand curve that surpasses historic agricultural productivity rates, reinforcing enzymes as a core component of modern feed regimes that safeguard production economics.
Government Push for Feed Self-Sufficiency (Saudi Vision 2030)
Vision 2030 allocates a modest amount to agri-industrial capacity building, including a prospective precision-fermentation facility backed by NEOM Investment Fund and Liberation Labs, announced in April 2025. Domestic enzyme production aligns with food-security goals, shortens supply chains, and mitigates volatility associated with maritime-based additive imports. Subsidies and preferential procurement rules encourage local mills to trial Saudi-made enzymes, shifting bargaining power in favor of national producers and fostering an innovation ecosystem that supports thermostable formulations.
Cost Savings from Phytase-Driven Phosphorus Reduction
Phytase inclusion lowers inorganic phosphate needs, delivering USD 5.4-11.9 per metric ton in feed cost savings[3]Source: Novonesis, “Results and Events,” novonesis.com. In a region where phosphate freight premiums inflate ingredient costs, phytase adoption offers immediate margin relief. Environmental regulations that cap phosphorus discharge in aquaculture intensify demand for high-activity phytase variants, providing dual economic and ecological value. The quantifiable payback accelerates phytase penetration even among price-sensitive mills, which often adopt phytase ahead of other enzymes.
Restraints Impact Analysis*
| Restraint | (~)% Impact on CAGR Forecast | Geographic Relevance | Impact Timeline |
|---|---|---|---|
| Volatile import tariffs on feed additives | -0.4% | Regional, with the highest impact on the smaller Gulf states | Short term (≤ 2 years) |
| High temperature-induced enzyme denaturation in the supply chain | -0.3% | Arabian Peninsula core, moderate impact in coastal areas | Medium term (2-4 years) |
| Limited cold-chain logistics in interior Arabian Peninsula | -0.2% | Saudi Arabia interior, UAE inland regions | Medium term (2-4 years) |
| Regulatory ambiguity on GM-derived enzyme strains | -0.2% | Iran primary, secondary effects in conservative Gulf states | Long term (≥ 4 years) |
| Source: Mordor Intelligence | |||
Volatile Import Tariffs on Feed Additives
Tariff oscillations of up to 25% on specialty additives strain budgeting for smaller Gulf mills, which respond by maintaining larger safety stocks that tie up working capital. Suppliers face hedging costs and narrower contract windows, complicating long-range demand planning. The unpredictability slows onboarding of newer, higher-cost enzymes despite proven feed-efficiency gains, particularly in Bahrain and Oman where tariff swings are most pronounced.
High Temperature-Induced Enzyme Denaturation in Supply Chain
Pelleting lines operating at 90-95 °C cut enzyme activity by 65-68% without protective coatings. Summer ambient temperatures in Riyadh exceed 45 °C, exposing warehoused enzymes to oxidative stress that shortens shelf life. Premium heat-stable variants command 12-15% price premiums and require capital upgrades for post-pelleting liquid application systems. Larger integrators absorb these costs; smaller mills rely on older formulations, slowing universal enzyme penetration.
*Our forecasts treat driver/restraint impacts as directional, not additive. The impact forecasts reflect baseline growth, mix effects, and variable interactions.
Segment Analysis
By Sub Additive: Carbohydrases Lead Corn-Soy Optimization
Carbohydrases held 47.45% of Middle East feed enzymes market share in 2025, reflecting their central role in unlocking energy from non-starch polysaccharides prevalent in imported corn-soy rations. Phytases contributed meaningful volume thanks to phosphorus-release economics, while other enzymes register the fastest growth at a 2.64% CAGR through 2031. Suppliers highlight energy matrix credits of 77.2% digestibility gains in corn-soy-canola diets when sfericase protease complements core carbohydrases. Heat-stable coating technologies differentiate premium offerings, especially in Saudi Arabian mills that run high-temperature pelleting lines. Regulatory halal certification remains a gating factor, giving established multinationals an advantage through comprehensive compliance portfolios.
Escalating grain price volatility promotes dual-enzyme inclusion strategies that mix carbohydrase and protease to buffer nutrient-density swings. Feed formulators test tailored enzyme cocktails to exploit specific grain lots, deepening supplier-integrator collaboration and embedding data-driven formulation tools. The approach sustains revenue growth beyond simple volume increases, expanding value-capture for technology-rich enzyme producers.


By Animal: Poultry Sector Drives Enzyme Consumption
The poultry segment accounted for 57.05% of Middle East feed enzymes market size in 2025 and is on course for a 2.66% CAGR through 2031, mirroring the rapid scale-up of integrated broiler complexes in Saudi Arabia and the UAE. Short production cycles amplify the economic impact of marginal feed-conversion gains, cementing enzymes as standard inputs in broiler feed. Layer operations adopt similar strategies to maintain egg-mass output amid grain-cost pressures, while specialty poultry species such as quail gain popularity in niche hospitality channels.
Aquaculture emerges as a high-growth niche as coastal states invest in fish production. Protease-carbohydrase blends enable higher soy inclusion, lowering fishmeal dependency and adhering to water-quality norms. Ruminant uptake centers on intensive dairy farms requesting fiber-degrading enzymes, whereas swine uptake remains negligible due to prevailing religious dietary laws. Segment diversification cushions suppliers against poultry market cyclicality and expands the technical challenge set for R&D pipelines.
Geography Analysis
Saudi Arabia maintained 39.65% Middle East feed enzymes market share in 2025 on the back of Vision 2030 investment incentives that reward feed-conversion improvements through enzyme adoption. Integrated players capitalize on economies of scale to absorb higher-grade enzyme costs and push adoption down to contract growers. NEOM-linked biotechnology investments could establish domestic fermentation capacity, tilting the competitive landscape toward Saudi-headquartered producers.
Iran, while constrained by sanctions, posts the fastest 2.85% CAGR to 2031 due to policies favoring domestic protein production. Feed mills leverage locally grown cereals, creating enzyme demand for varied grain substrates. Conservative GM policies necessitate non-GM enzyme sourcing, prompting multinationals to maintain dual portfolios. Smaller Gulf states adopt premium multi-enzyme packages yet remain sensitive to tariff swings, driving episodic buying patterns that complicate inventory planning for distributors.
The Rest of Middle East cluster, encompassing the UAE, Kuwait, Bahrain, and more, collectively accounts for the remaining market share. UAE’s Dubai-based logistics hubs offer reliable cold-chain capacity, attracting regional distribution centers for Novonesis, BASF, and IFF. Egypt’s Red Sea corridor sees surging aquaculture investments, with seafood processors mandating enzyme-enhanced feed to satisfy export-market water-quality certifications. Currency volatility and tariff shifts keep procurement dynamic, challenging supplier forecasting yet expanding the addressable customer base through diverse livestock species.
Competitive Landscape
The Middle East feed enzymes market is fragmented. Alltech, Inc., Brenntag SE, Novonesis (DSM-Firmenich), IFF(Danisco Animal Nutrition), and Kerry Group Plc counter by emphasizing heat-stable coating innovations and region-specific technical service teams that optimize dosing for local corn-protein variability. Novonesis’ acquisition of DSM-Firmenich’s Feed Enzyme Alliance stake creates the region’s largest single-source portfolio across phytase, carbohydrase, and protease lines. The transaction integrates R&D pipelines and distribution resources, enabling bundled sales agreements that can lock out smaller rivals.
Strategic moves center on securing local manufacturing footprints. Liberation Labs and NEOM’s feasibility study targets 600,000-liter fermentation capacity, positioning Saudi Arabia as a future export platform for enzymes and microbial proteins. Lallemand’s July 2024 investment in Turkish enzyme firm Livzym broadens regional production redundancy and shortens transit routes into Levant markets.
Supplier differentiation now hinges on complete halal certification, real-time feed-formulation software, and demonstrated heat stability in 95 °C pelleting. Multinationals bundle these features with financing options and on-site staff training to strengthen switching costs. Emerging opportunities lie in enzyme cocktails for alternative proteins, notably insect meal, which align with sustainability branding and may unlock new margin pools.
Middle East Feed Enzymes Industry Leaders
Alltech, Inc.
Brenntag SE
IFF(Danisco Animal Nutrition)
Kerry Group Plc
Novonesis (DSM-Firmenich)
- *Disclaimer: Major Players sorted in no particular order

Recent Industry Developments
- June 2025: Novonesis completes acquisition of DSM-Firmenich’s Feed Enzyme Alliance share for EUR 1.5 billion (USD 1.6 billion), consolidating enzyme portfolios and regional distribution networks.
- April 2025: Liberation Labs and NEOM Investment Fund initiated a feasibility study for a 600,000-liter precision-fermentation plant in Saudi Arabia targeting domestic enzyme and microbial protein production.


Middle East Feed Enzymes Market Report Scope
Carbohydrases, Phytases are covered as segments by Sub Additive. Aquaculture, Poultry, Ruminants, Swine are covered as segments by Animal. Iran, Saudi Arabia are covered as segments by Country.Sub Additive
| Carbohydrases |
| Phytases |
| Other Enzymes |
Animal
| Aquaculture | Fish |
| Shrimp | |
| Other Aquaculture Species | |
| Poultry | Broiler |
| Layer | |
| Other Poultry Birds | |
| Ruminants | Beef Cattle |
| Dairy Cattle | |
| Other Ruminants | |
| Swine | |
| Other Animals |
Country
| Iran |
| Saudi Arabia |
| Rest of Middle East |
| Sub Additive | Carbohydrases | |
| Phytases | ||
| Other Enzymes | ||
| Animal | Aquaculture | Fish |
| Shrimp | ||
| Other Aquaculture Species | ||
| Poultry | Broiler | |
| Layer | ||
| Other Poultry Birds | ||
| Ruminants | Beef Cattle | |
| Dairy Cattle | ||
| Other Ruminants | ||
| Swine | ||
| Other Animals | ||
| Country | Iran | |
| Saudi Arabia | ||
| Rest of Middle East | ||


Market Definition
- FUNCTIONS - For the study, feed additives are considered to be commercially manufactured products that are used to enhance characteristics such as weight gain, feed conversion ratio, and feed intake when fed in appropriate proportions.
- RESELLERS - Companies engaged in reselling feed additives without value addition have been excluded from the market scope, to avoid double counting.
- END CONSUMERS - Compound feed manufacturers are considered to be end-consumers in the market studied. The scope excludes farmers buying feed additives to be used directly as supplements or premixes.
- INTERNAL COMPANY CONSUMPTION - Companies engaged in the production of compound feed as well as the manufacturing of feed additives are part of the study. However, while estimating the market sizes, the internal consumption of feed additives by such companies has been excluded.
| Keyword | Definition |
|---|---|
| Feed additives | Feed additives are products used in animal nutrition for purposes of improving the quality of feed and the quality of food from animal origin, or to improve the animals’ performance and health. |
| Probiotics | Probiotics are microorganisms introduced into the body for their beneficial qualities. (It maintains or restores beneficial bacteria to the gut). |
| Antibiotics | Antibiotic is a drug that is specifically used to inhibit the growth of bacteria. |
| Prebiotics | A non-digestible food ingredient that promotes the growth of beneficial microorganisms in the intestines. |
| Antioxidants | Antioxidants are compounds that inhibit oxidation, a chemical reaction that produces free radicals. |
| Phytogenics | Phytogenics are a group of natural and non-antibiotic growth promoters derived from herbs, spices, essential oils, and oleoresins. |
| Vitamins | Vitamins are organic compounds, which are required for normal growth and maintenance of the body. |
| Metabolism | A chemical process that occurs within a living organism in order to maintain life. |
| Amino acids | Amino acids are the building blocks of proteins and play an important role in metabolic pathways. |
| Enzymes | Enzyme is a substance that acts as a catalyst to bring about a specific biochemical reaction. |
| Anti-microbial resistance | The ability of a microorganism to resist the effects of an antimicrobial agent. |
| Anti-microbial | Destroying or inhibiting the growth of microorganisms. |
| Osmotic balance | It is a process of maintaining salt and water balance across membranes within the body's fluids. |
| Bacteriocin | Bacteriocins are the toxins produced by bacteria to inhibit the growth of similar or closely related bacterial strains. |
| Biohydrogenation | It is a process that occurs in the rumen of an animal in which bacteria convert unsaturated fatty acids (USFA) to saturated fatty acids (SFA). |
| Oxidative rancidity | It is a reaction of fatty acids with oxygen, which generally causes unpleasant odors in animals. To prevent these, antioxidants were added. |
| Mycotoxicosis | Any condition or disease caused by fungal toxins, mainly due to contamination of animal feed with mycotoxins. |
| Mycotoxins | Mycotoxins are toxin compounds that are naturally produced by certain types of molds (fungi). |
| Feed Probiotics | Microbial feed supplements positively affect gastrointestinal microbial balance. |
| Probiotic yeast | Feed yeast (single-cell fungi) and other fungi used as probiotics. |
| Feed enzymes | They are used to supplement digestive enzymes in an animal’s stomach to break down food. Enzymes also ensure that meat and egg production is improved. |
| Mycotoxin detoxifiers | They are used to prevent fungal growth and to stop any harmful mold from being absorbed in the gut and blood. |
| Feed antibiotics | They are used both for the prevention and treatment of diseases but also for rapid growth and development. |
| Feed antioxidants | They are used to protect the deterioration of other feed nutrients in the feed such as fats, vitamins, pigments, and flavoring agents, thus providing nutrient security to the animals. |
| Feed phytogenics | Phytogenics are natural substances, added to livestock feed to promote growth, aid in digestion, and act as anti-microbial agents. |
| Feed vitamins | They are used to maintain the normal physiological function and normal growth and development of animals. |
| Feed flavors and sweetners | These flavors and sweeteners help to mask tastes and odors during changes in additives or medications and make them ideal for animal diets undergoing transition. |
| Feed acidifiers | Animal feed acidifiers are organic acids incorporated into the feed for nutritional or preservative purposes. Acidifiers enhance congestion and microbiological balance in the alimentary and digestive tracts of livestock. |
| Feed minerals | Feed minerals play an important role in the regular dietary requirements of animal feed. |
| Feed binders | Feed binders are the binding agents used in the manufacture of safe animal feed products. It enhances the taste of food and prolongs the storage period of the feed. |
| Key Terms | Abbreviation |
| LSDV | Lumpy Skin Disease Virus |
| ASF | African Swine Fever |
| GPA | Growth Promoter Antibiotics |
| NSP | Non-Starch Polysaccharides |
| PUFA | Polyunsaturated Fatty Acid |
| Afs | Aflatoxins |
| AGP | Antibiotic Growth Promoters |
| FAO | The Food And Agriculture Organization of the United Nations |
| USDA | The United States Department of Agriculture |


Research Methodology
Mordor Intelligence follows a four-step methodology in all our reports.
- Step-1: IDENTIFY KEY VARIABLES: In order to build a robust forecasting methodology, the variables and factors identified in Step-1 are tested against available historical market numbers. Through an iterative process, the variables required for market forecast are set and the model is built on the basis of these variables.
- Step-2: Build a Market Model: Market-size estimations for the forecast years are in nominal terms. Inflation is not a part of the pricing, and the average selling price (ASP) is kept constant throughout the forecast period.
- Step-3: Validate and Finalize: In this important step, all market numbers, variables and analyst calls are validated through an extensive network of primary research experts from the market studied. The respondents are selected across levels and functions to generate a holistic picture of the market studied.
- Step-4: Research Outputs: Syndicated Reports, Custom Consulting Assignments, Databases & Subscription Platforms


