Middle East Energy Drinks Market Size and Share
Market Overview
| Study Period | 2021 - 2031 |
|---|---|
| Forecast Data Period | 2026 - 2031 |
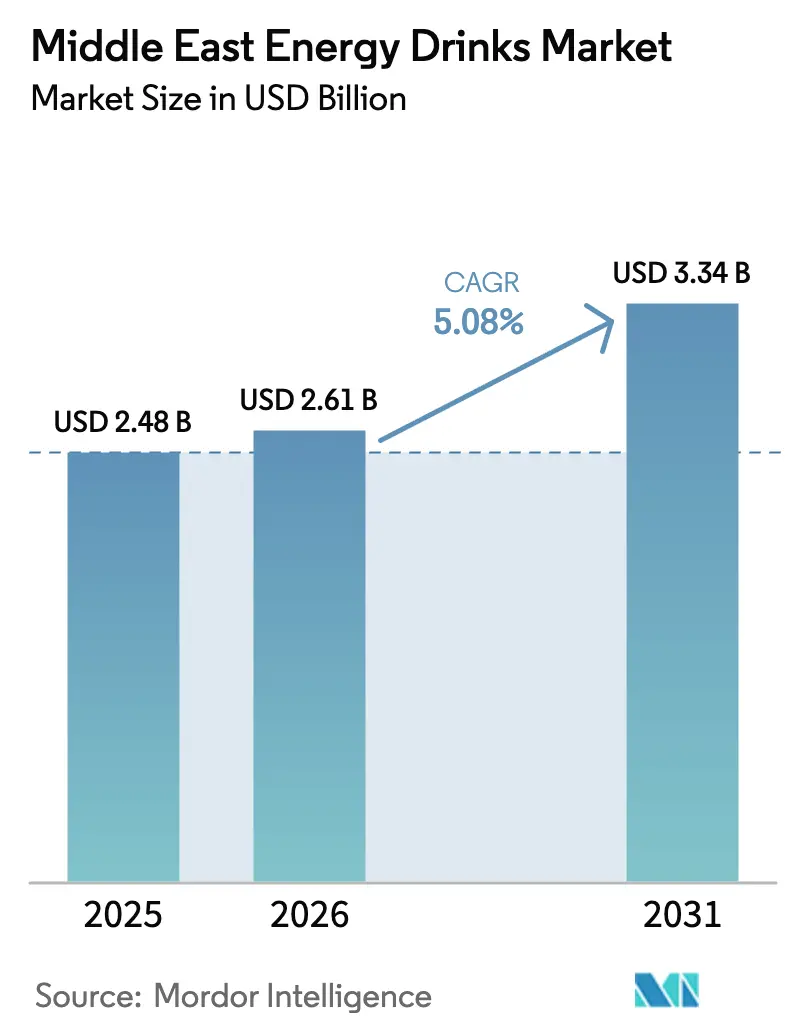
| Base Year Market Size (2025) | USD 2.48 Billion |
| Market Size (2026) | USD 2.61 Billion |
| Market Size (2031) | USD 3.34 Billion |
| Growth Rate (2026 - 2031) | 5.08% CAGR |
| Market Concentration | High |
Major Players *Disclaimer: Major Players sorted in no particular order Image © Mordor Intelligence. Reuse requires attribution under CC BY 4.0. | |
Middle East Energy Drinks Market Analysis by Mordor Intelligence
The Middle East energy drinks market size was valued at USD 2.48 billion in 2025 and estimated to grow from USD 2.61 billion in 2026 to reach USD 3.34 billion by 2031, at a CAGR of 5.08% during the forecast period (2026-2031). Tightening fiscal rules, affluent but youth-heavy demographics, and the rapid mingling of Western consumption habits with Gulf health policy shape growth. Traditional formulations remain the volume backbone, yet natural and organic variants are expanding at a 7.13% CAGR as shoppers pivot toward functional wellness. Saudi Arabia’s Vision 2030 sports build-out and Qatar’s post-World Cup participation wave are expanding the addressable athlete and casual exerciser base. Packaging is shifting from metal cans toward lightweight aseptic formats to withstand desert supply lines, while retailers capitalize on impulse-driven demand in convenience stores, despite a 100% excise tax across most GCC states. Geopolitical boycotts and labor markets with a high concentration of migrants inject volatility, forcing brands to diversify their sourcing, reformulate products to comply with caffeine limits, and localize their marketing strategies.
Key Report Takeaways
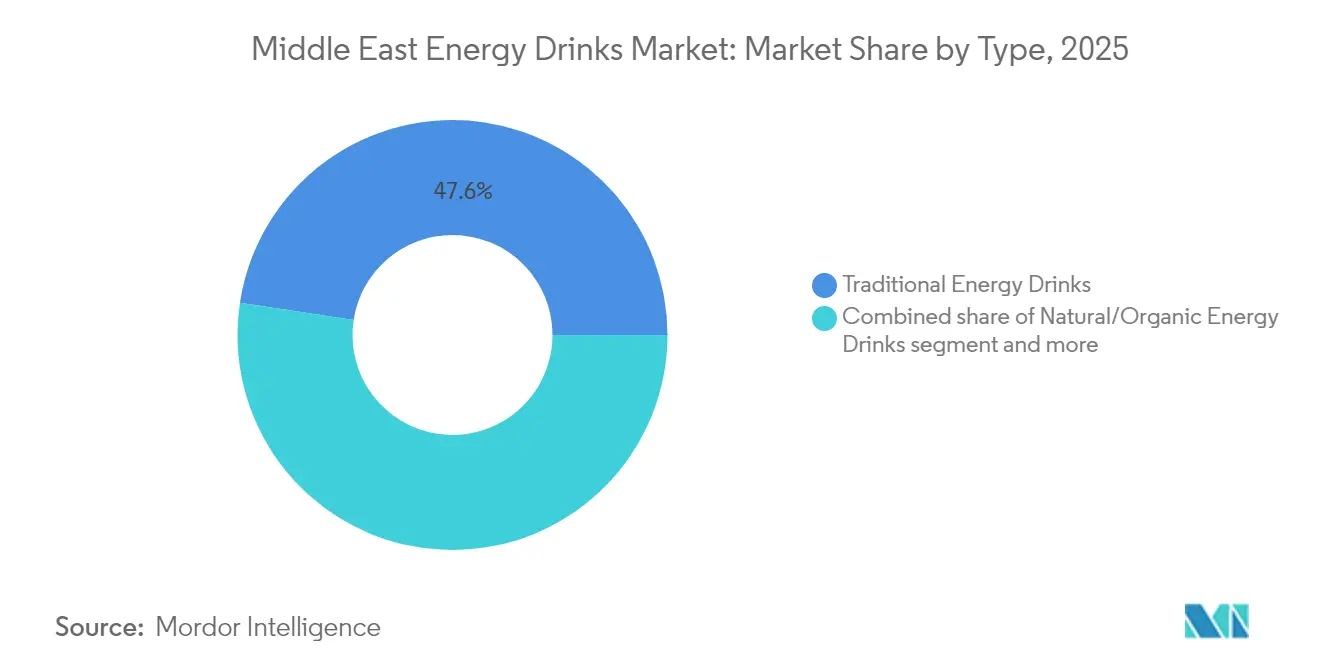
- By type, traditional energy drinks held 47.60% of the Middle East energy drinks market share in 2025, while natural and organic products are projected to post a 6.82% CAGR through 2031.
- By packaging, metal cans accounted for 56.95% of the revenue in 2025; aseptic formats are on track to expand at a 6.22% CAGR through 2031.
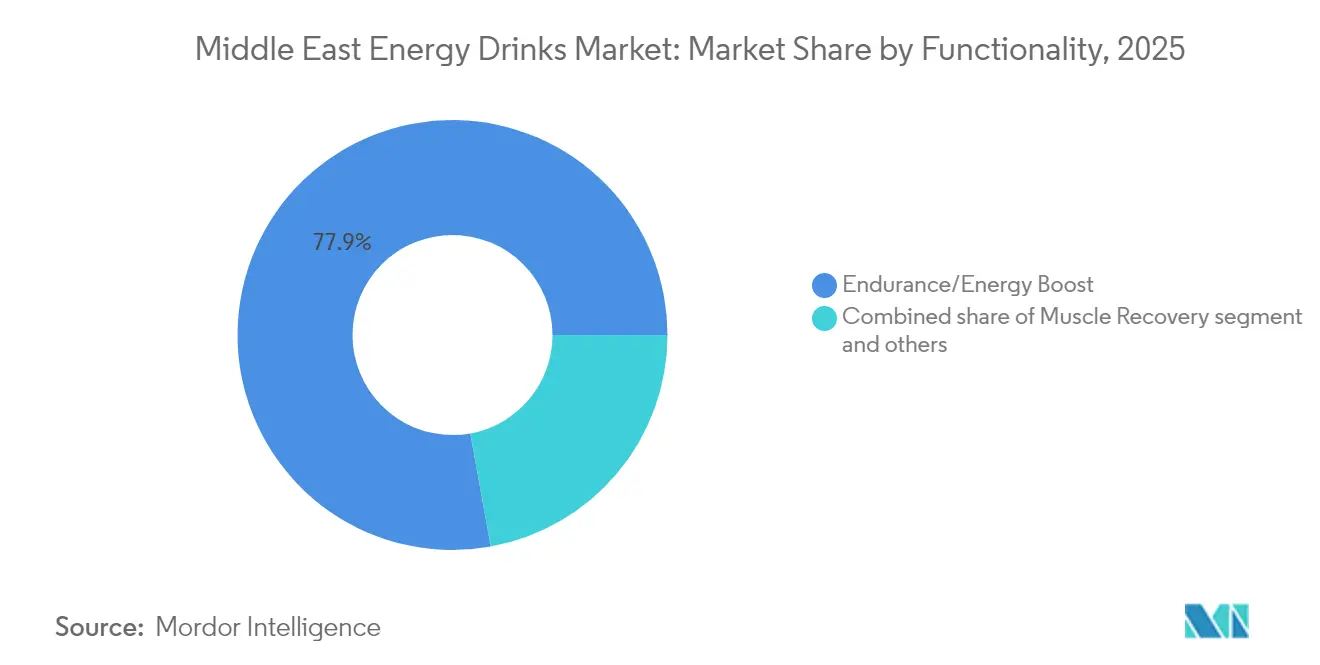
- By functionality, endurance and energy-boost offerings accounted for 77.85% of the Middle East energy drinks market size in 2025, while muscle recovery beverages are forecast to rise at a 7.28% CAGR through 2031.
- By distribution, retail captured a 61.70% share in 2025; however, HoReCa channels are benefiting from a rebound in tourism and sports events, which is broadening premium on-premise consumption.
- By geography, Saudi Arabia led with 55.30% of sales in 2025; Qatar is the fastest-growing territory with a 6.61% CAGR outlook to 2031.
Note: Market size and forecast figures in this report are generated using Mordor Intelligence’s proprietary estimation framework, updated with the latest available data and insights as of 2026.
Middle East Energy Drinks Market Trends and Insights
Drivers Impact Analysis*
| Driver | (~) % Impact on CAGR Forecast | Geographic Relevance | Impact Timeline |
|---|---|---|---|
| Expansion of organized sports leagues and grassroots training ecosystems | +0.9% | Saudi Arabia, UAE, Qatar (post-World Cup legacy infrastructure) | Medium term (2-4 years) |
| High demand for on-the-go, convenient caffeinated beverages in urban centers | +0.8% | GCC urban cores (Riyadh, Dubai, Doha); secondary in Cairo, Amman | Short term (≤ 2 years) |
| Introduction of functional energy drinks with vitamins, amino acids, and herbal extracts | +0.7% | GCC affluent segments; spillover to Levant urban youth | Medium term (2-4 years) |
| Aggressive marketing and sponsorship by energy drink brands | +0.6% | Saudi Arabia (Pro League), UAE (sports events), regional esports circuits | Short term (≤ 2 years) |
| Government and private sector initiatives promoting active lifestyles and wellness events | +0.5% | UAE (National Sports Strategy 2031), Saudi Arabia (Vision 2030 sports pillar) | Long term (≥ 4 years) |
| Influence of Western lifestyle trends and social media on youth consumption patterns | +0.7% | GCC youth (15-34 age bracket); urban Mashreq populations | Short term (≤ 2 years) |
| Source: Mordor Intelligence | |||


Expansion of Organized Sports Ecosystems
Since 2023, Saudi Arabia’s Public Investment Fund has invested over USD 6 billion in stadiums, academies, and the Saudi Pro League, converting strong fan engagement into higher beverage spending at matches and fan zones, according to the Saudi Pro League (SPL)[1]Source: Saudi Pro League, “Roshn Saudi League welcomes PepsiCo as Gold Partner,” spl.com.sa. In parallel, the UAE’s National Sports Strategy 2031 targets 71% population participation, while Abu Dhabi’s Sports for All Policy expands access to facilities, broadening the consumer base beyond elite athletes, as stated by the United Arab Emirates Government. Qatar’s continued use of World Cup infrastructure supports a projected 6.92% CAGR for energy drinks, with stadium concessions, grassroots leagues, and brand activations creating repeat consumption occasions that are expected to sustain steady category growth across GCC cities.
Urban Demand for On-the-Go Caffeinated Drinks
Around 61% of Middle Eastern residents live in urban areas, with GCC capitals exceeding 90% urbanization, according to the United Nations Economic and Social Commission for Western Asia[2]Source: United Nations ESCWA, “Arab Society Demographic and Social Trends Issue 17,” unescwa.org. Long working hours in construction, logistics, and hospitality, largely staffed by migrant workers, drive demand for single-serve cans that deliver quick energy at site kiosks. In the UAE, internet penetration above 95% supports app-based promotions that turn impulse cravings into fast deliveries, as noted by the OECD[3]Source: OECD, “Governing for Sustainable Prosperity in MENA,” oecd.org. Meanwhile, the expected GDP growth of 4.7% in 2025 is set to boost non-oil retail spending and city-center footfall, according to the World Bank. In these densely populated urban markets, convenience often outweighs brand loyalty, prompting marketers to optimize packaging, pricing, and availability as ride-hailing and quick-commerce platforms continue to enhance digital point-of-sale conversions.
Shift Toward Functional, Natural, and Recovery Formulations
Coca-Cola HBC posted a 37.3% increase in energy drink volumes in Q1 2024 following the rollout of Monster Green Zero Sugar across 16 MENA markets. With adult obesity rates exceeding 30%, governments are restricting high-sugar beverages in schools, accelerating interest in plant-based caffeine, adaptogens, and amino acid formulations. Natural and organic variants are projected to grow at a 7.13% CAGR through 2030, while muscle recovery products are expanding at 7.66% as gym participation rises across the Gulf, according to the Department of Community Development in Abu Dhabi. Brands are leaning into clean-label positioning to offset excise taxes that apply equally to sugar-free and functional drinks, targeting higher-margin, wellness-focused consumers. At the same time, regulatory signals such as the Saudi FDA’s 2025 caffeine labeling requirement are pushing early reformulation, which is increasingly seen as a prerequisite for market entry, as noted by the United Arab Emirates Government.
Intensified Brand Sponsorships and Digital Engagement
PepsiCo’s Gold partnership with the Roshn Saudi League, spanning Pepsi, Gatorade, and Aquafina, highlights the strength of sports sponsorships in markets where cultural norms limit traditional advertising, according to the Saudi Pro League (SPL). Esports and music festivals are also helping brands connect with the region’s young audience, with 48% of residents under 25 and highly active on platforms such as TikTok and Instagram, as noted by the OECD. Influencer-led launches are increasingly delivering stronger results than conventional celebrity campaigns, reflecting near-universal smartphone use across the GCC. While these tactics can drive rapid volume gains, brands must balance bold messaging with tightening caffeine and sugar regulations, making flexible sponsorship strategies and real-time content creation essential for staying competitive.
Restraints Impact Analysis*
| Restraint | (~) % Impact on CAGR Forecast | Geographic Relevance | Impact Timeline |
|---|---|---|---|
| Strict regulatory frameworks on caffeine and stimulant content in GCC countries | -0.9% | Saudi Arabia, UAE, Qatar (SFDA, ESMA, GCC Standardization Organization) | Short term (≤ 2 years) |
| High taxation and import duties on energy drinks increasing retail prices | -0.8% | GCC (100% excise tax); Saudi Arabia highest total tax burden (42% of retail price) | Short term (≤ 2 years) |
| Health concerns related to excessive sugar and caffeine intake | -0.6% | GCC (high obesity prevalence); school canteen bans; public health campaigns | Medium term (2-4 years) |
| Dependency on imported energy drinks, leading to supply chain vulnerabilities | -0.5% | West Bank, conflict-affected areas; broader GCC reliance on imported cans and ingredients | Medium term (2-4 years) |
| Source: Mordor Intelligence | |||
Stringent Fiscal and Regulatory Barriers
Energy drinks across the GCC face a 100% excise tax, which, combined with Saudi Arabia’s 15% VAT, results in a total tax burden of around 42%, pushing shelf prices to USD 3.50–4.00 per can, according to the World Health Organization[4]Source: World Health Organization, “Fiscal policies for diet improvement,” who.int. Dubai limits caffeine to 200 mg per serving, while Saudi regulations will require explicit content labels from July 2025, driving rapid reformulation. Additional import duties on cans and sugar increase costs, squeezing retailer margins and reducing shelf space in smaller outlets. Non-compliance risks fines, prompting distributors to streamline SKUs and delay new launches. While these pressures create short-term challenges, harmonized GCC standards could simplify multi-country rollouts once brands adjust.
Rising Health Scrutiny and Supply-Chain Exposure
School restrictions on sugary drinks and WHO adolescent caffeine guidelines are positioning energy drinks as indulgent products in need of reform. The UAE’s Masar program reduced student sugary drink consumption by 10% between 2019 and 2024, indicating shifting habits among future consumers. Supply disruptions, such as can and sugar shortages in the West Bank in October 2024, highlighted the risks of relying heavily on imports. Aujan Coca-Cola’s plan to expand regional production aims to mitigate these risks but will take several years to fully materialize. In the medium term, the sector’s stability will hinge on the development of local canning lines, sugar refineries, and recycling networks to maintain steady inventories.
*Our forecasts treat driver/restraint impacts as directional, not additive. The impact forecasts reflect baseline growth, mix effects, and variable interactions.
Segment Analysis
By Type: Traditional Lines Dominate as Functional Niches Accelerate
In 2025, the Middle East energy drinks market for traditional formulations reached USD 1.18 billion, accounting for 47.60% of value sales, supported by strong distribution and brand recognition. However, its 3.72% CAGR trails the 6.82% growth projected for natural and organic drinks, as affluent consumers shift toward plant-based caffeine, adaptogens, and zero-sugar options. Energy shots, although niche, cater to shift workers who need compact, portable formats, while hybrid waters and protein-carbonates combine hydration and nutrition with stimulation.
Marketing is evolving from extreme-sports imagery to holistic performance, targeting casual gym-goers and wellness-focused women. Uniform taxation is offset by premium positioning, allowing functional SKUs to maintain margins, while sugar-free variants, such as Monster Green Zero Sugar, protect against obesity-driven excises. Clear caffeine labeling may influence ultra-high-stimulant shots, but also builds consumer trust. Traditional volumes remain steady due to demand for migrant labor, while value growth increasingly depends on premium functional offerings that command higher price points.


By Packaging Type: Cans Hold Sway but Aseptic Packs Rise in the Heat
In 2025, metal cans accounted for 56.95% of the Middle East energy drinks market, valued for their ability to retain chill, portability, and impulse-buy appeal at corner stores. However, red-sea freight bottlenecks and conflict-driven shortages underscore the need for diversification of packaging. Aseptic cartons, growing at a 6.22% CAGR, are lighter and withstand hot storage, enabling brands to reach inland and conflict-adjacent markets without the need for refrigerated transport. PET multipacks remain popular in hypermarkets, appealing to family buyers who seek bulk value, while glass bottles position smaller brands as artisanal and environmentally friendly.
Sustainability initiatives and emerging circular economy policies are likely to favor closed-loop aluminum and PET systems, encouraging brands to adopt thinner gauges, tethered caps, and recycling partnerships to attract eco-conscious youth. Despite this, immediate consumer demand continues to favor single-serve cans suited to commuters, making supply resilience dependent on balancing multiple formats, localizing can production, and aligning pack sizes with channel dynamics.
By Functionality: Endurance Still Rules, Recovery Drinks Post Fastest Gains
Endurance-focused energy drinks made up 77.85% of revenue in 2025, driven by demand for quick stimulation among workers and athletes during heat-intensive shifts. Muscle recovery products in the Middle East reached around USD 486 million and are expected to grow at a 7.28% CAGR, outpacing the core energy category. These blends, enriched with BCAAs, taurine, and electrolytes, serve as post-workout aids rather than simple stimulants.
Rising GCC gym memberships, supported by government initiatives like Saudi Vision 2030 and the UAE Sports Strategy, have expanded trials across genders, according to the United Arab Emirates Government. Cognitive-boost drinks containing L-theanine and nootropics remain niche, with regulatory scrutiny limiting marketing claims. While migrant labor sustains demand for endurance flavors, recovery SKUs command higher prices and new shelf space in sports retail and e-commerce. Over time, multitasking formulas combining energy, immunity, and hydration may blur category lines, reinforcing premiumization.
By Distribution Channel: Retail Dominates but HoReCa and Online Advance
In 2025, supermarkets, convenience stores, and small groceries accounted for 61.70% of energy drink sales, benefiting from high foot traffic near dormitories and work sites. Meanwhile, reforms in tourism, events, and food service have driven HoReCa growth, with stadiums, music festivals, and cafés enabling flavor experimentation and premium pricing. Online retail remains under 10% of value but is growing rapidly, as quick-commerce riders deliver chilled cans to offices within minutes, appealing to tech-savvy Gulf youth.
Gaza-related boycotts in 2024 reshuffled retail facings, allowing Egypt’s V7 cola and local challengers to secure prime eye-level slots previously dominated by legacy brands. Convenience chains face tight margins under a 100% excise tax, prompting some to reduce energy drink facings in favor of higher-margin snacks, yet late-night and on-premise consumption after sporting events continues to boost basket values, maintaining the channel’s strategic importance.
Geography Analysis
Saudi Arabia led the Middle East energy drinks market in 2025, generating 55.30% of revenue, supported by a young, sports-focused population and over USD 6 billion in new stadium and training facilities that drive match-day kiosk sales. Despite the region’s highest tax burden, baseline demand remains strong among affluent youth and 11 million migrant workers. Upcoming caffeine disclosure rules may boost trust among health-conscious consumers and encourage innovation in mid-strength SKUs. Mega-events, from boxing matches to esports finals, transform Riyadh and Jeddah into year-round activation hubs, favoring impulse-priced single-serve cans. Meanwhile, retailer consolidation could shift trade-promotion dynamics toward a few dominant hypermarket groups.
In the United Arab Emirates, 100% excise taxes coexist with some of the world’s highest per-capita disposable incomes, sustaining resilient demand for premium products. With nearly 99% of the workforce comprising expatriates, many of whom work in construction and hospitality, on-the-go cans remain popular during long, hot shifts. Government programs, such as the National Sports Strategy 2031 and the Inclusive Sports for All Policy, have broadened consumption beyond youth to seniors and people with disabilities, driving interest in gentler, lower-sugar formulations. Dubai’s caffeine caps require portfolio adjustments, yet its status as a tourism and event hub continues to support HoReCa sales.
Qatar, growing at a 6.61% CAGR, leverages World Cup legacy stadiums and year-round tournaments to attract regional sports tourists and brand activations, with high GDP per capita insulating consumption from excise-driven price increases. Kuwait, Bahrain, and Oman follow regional trends but remain reliant on imports for cans and ingredients, leaving shelves exposed to Red-Sea freight disruptions. Non-GCC markets like Egypt and Jordan are highly price-sensitive, though geopolitical boycotts have opened opportunities for local players such as V7 cola, whose exports tripled in 2024. Currency fluctuations and youth unemployment above 27% constrain broader uptake, making value-oriented formats the preferred strategy in these territories.
Competitive Landscape
The Middle East energy drinks market remains highly consolidated, with Red Bull holding iconic status while Monster, PepsiCo, Power Horse, and The Coca-Cola Company occupy the majority of shelf space. Western brand sales dipped in H1 2024 due to Gaza-related tensions, highlighting volatile brand loyalties and boosting challengers like V7 Cola, whose exports tripled year-over-year. Coca-Cola HBC’s rollout of Monster Green Zero Sugar across 16 markets drove a 37.3% volume increase, showing how incumbents defend market share through functional extensions.
PepsiCo strengthened its presence through a multi-season Gold partnership with the Roshn Saudi League, positioning Gatorade on the sidelines and Pepsi in stadium cup holders. Meanwhile, Aujan Coca-Cola’s planned expansion of MENA canning lines signals a move toward localized production to reduce supply risk and support national industrialization goals. At the same time, esports-focused start-ups are gaining traction with low overhead, influencer bundles, and lower-caffeine micro-shots aimed at gamers seeking alternatives to legacy brands.
Growth opportunities remain in the muscle recovery and organic segments, both of which are forecasted to grow above a 7% CAGR. Local formulators can leverage halal-certified botanical blends to meet wellness and religious requirements simultaneously. With Saudi FDA-mandated caffeine labeling coming in 2025, transparency will push taste, functionality, and credibility to the forefront of competition. Success in the future will depend on agility in sourcing, digital engagement, and functional R&D to distinguish share gainers from laggards.
Middle East Energy Drinks Industry Leaders
Red Bull GmbH
Monster Beverage Corporation
PepsiCo Inc.
Power Horse Energy Drinks GmbH
The Coca-Cola Company
- *Disclaimer: Major Players sorted in no particular order

Recent Industry Developments
- September 2025: Pepsi Kenya has entered the energy drink segment with a new product called Sting Energy, launching two variants: Red Rush and Gold Rush. These variants are available in 330ml bottles nationwide, across supermarkets, convenience stores, and kiosks.
- February 2025: PepsiCo entered a Gold Partnership with the Roshn Saudi League, covering Pepsi, Gatorade, and Aquafina through the 2024-25 season.
- January 2024: Aujan Coca-Cola Beverages Company has announced a manufacturing expansion plan to enhance can and bottle capacity in the MENA region.


Middle East Energy Drinks Market Report Scope
Energy Shots, Natural/Organic Energy Drinks, Sugar-free or Low-calories Energy Drinks, Traditional Energy Drinks are covered as segments by Soft Drink Type. Glass Bottles, Metal Can, PET Bottles are covered as segments by Packaging Type. Off-trade, On-trade are covered as segments by Distribution Channel. Qatar, Saudi Arabia, United Arab Emirates are covered as segments by Country.| Traditional Energy Drinks |
| Sugar-free / Low-calorie Energy Drinks |
| Natural / Organic Energy Drinks |
| Energy Shots |
| Other Energy Drinks |
| PET Bottles |
| Metal Can |
| Aseptic Packaged |
| Glass Bottle |
| Disposable Cups |
| Endurance/Energy Boost |
| Muscle Recovery |
| Other |
| HoReCa | |
| Retail | Supermarkets/Hypermarkets |
| Convenience/Grocery Stores | |
| Online Retail Stores | |
| Other Distribution Channels |
| Saudi Arabia |
| United Arab Emirates |
| Qatar |
| Kuwait |
| Bahrain |
| Oman |
| Rest of Middle East |
| By Type | Traditional Energy Drinks | |
| Sugar-free / Low-calorie Energy Drinks | ||
| Natural / Organic Energy Drinks | ||
| Energy Shots | ||
| Other Energy Drinks | ||
| By Packaging Type | PET Bottles | |
| Metal Can | ||
| Aseptic Packaged | ||
| Glass Bottle | ||
| Disposable Cups | ||
| By Functionality | Endurance/Energy Boost | |
| Muscle Recovery | ||
| Other | ||
| By Distribution Channel | HoReCa | |
| Retail | Supermarkets/Hypermarkets | |
| Convenience/Grocery Stores | ||
| Online Retail Stores | ||
| Other Distribution Channels | ||
| By Country | Saudi Arabia | |
| United Arab Emirates | ||
| Qatar | ||
| Kuwait | ||
| Bahrain | ||
| Oman | ||
| Rest of Middle East | ||


Market Definition
- Carbonated Soft Drinks (CSDs) - Carbonated soft drinks (CSDs) refer to non-alcoholic beverages that are carbonated and typically flavored, containing dissolved carbon dioxide to create effervescence. These beverages commonly include cola, lemon-lime, orange, and various fruit-flavored sodas. Marketed in cans, bottles, or fountain dispense.
- Juices - We have considered packaged juices which encompass non-alcoholic beverages derived from fruits, vegetables, or a combination thereof, processed and sealed in various packaging formats such as bottles, cartons, or pouches. Excluding fresh juices, this market segment involves commercially prepared and preserved juices, often with added preservatives and flavors.
- Ready-to-Drink (RTD) Tea and RTD Coffee - Ready-to-Drink (RTD) tea and RTD coffee are pre-packaged, non-alcoholic beverages that are brewed and prepared for consumption without further dilution. RTD tea typically includes various tea varieties, infused with flavors and sweeteners, and comes in bottles, cans, or cartons. Similarly, RTD coffee involves pre-brewed coffee formulations, often mixed with milk, sugar, or flavorings, and is conveniently packaged for on-the-go consumption.
- Energy Drinks - Energy drinks are non-alcoholic beverages formulated to provide a quick boost of energy and alertness. Whereas, sports drinks are beverages designed to hydrate and replenish electrolytes, particularly after physical exertion, exercise, or intense activity
| Keyword | Definition |
|---|---|
| Carbonated Soft Drinks | Carbonated soft drinks (CSDs) are a combination of carbonated water and flavouring, sweetened by sugar or a non-sugar sweeteners. |
| Standard Cola | Standard Cola is defined as the original flavor of cola soda. |
| Diet Cola | A cola-based soft drink containing no or low amounts of sugar |
| Fruit Flavored Carbonates | A carbonated beverage prepared from fruit juice/fruit flavor with carbonated water and containing sugar, dextrose, invert sugar or liquid glucose either singly or in combination. It may contain peel oil and fruit essences. |
| Juice | Juice is a drink made from the extraction or pressing of the natural liquid contained in fruit and vegetables. |
| 100% Juice | Fruit/vegetable juice made from fruit in the form of its juice with no water added to make up the volume. It is not permitted to add sugars, sweeteners, preservatives, flavourings or colourings to fruit juice. |
| Juice Drinks (up to 24% Juice) | Fruit/vegetable juice drinks with up to 24% fruits/vegetable extract. |
| Nectars (25-99% Juice) | Juices that can have between 25 and 99% of fruit, with the minimum legal limits defined depending on the type of fruit |
| Juice concentrates | Juice Concentrates are those form of juices when most of this liquid is removed resulting in a thick, syrupy product known as juice concentrate. |
| RTD Coffee | Packaged coffee beverages that are sold in a prepared form and are ready for consumption at the time of purchase. |
| Iced Coffee | An iced coffee is a cold version of coffee, usually a combination of hot espresso and milk with ice added to it. |
| Cold Brew Coffee | Cold brew also called cold water extraction or cold pressing is made by steeping ground coffee in room-temperature water for several hours. |
| RTD Tea | Ready-to-drink (RTD) tea is a packaged tea product ready for immediate consumption without brewing or preparation |
| Iced Tea | Ice tea or iced tea is a drink made from tea without milk but with sugar and sometimes fruit flavourings, drunk cold. |
| Green Tea | Green tea is a tea beverage which promotes mental alertness, relieving digestive symptoms and promoting weight loss. |
| Herbal Tea | Herbal tea beverages are made from the infusion or decoction of herbs, spices, or other plant material in hot water. |
| Energy Drink | A type of drink containing stimulant compounds, usually caffeine, which is marketed as providing mental and physical stimulation. They may or may not be carbonated and may also contain sugar, other sweeteners, or herbal extracts, among numerous possible ingredients. |
| Sugar-free or Low-calories Energy Drinks | Sugar-free or Low-calories Energy Drinks are sugar-free, artificially sweetened energy drinks with few or no calories. |
| Traditional Energy Drink | Traditional Energy Drinks are functional soft drinks containing ingredients designed to boost the consumer's energy. |
| Natural/Oraganic Energy Drinks | Natural/Organic energy drinks are energy drinks free of artificial sweeteners and synthetic colorings. Instead, they contain naturally derived ingredients such as green tea, yerba mate, and botanical extracts. |
| Energy Shots | A small but highly concentrated energy drink that contains large amounts of caffeine and/or other stimulants. The quantity is comparatively smaller compared to energy drinks. |
| Sports Drink | Sports drinks are beverages designed specifically for the rapid supply of fluid, carbohydrates, and electrolytes before, during or after exercise. |
| Isotonic | Isotonic drinks contain similar concentrations of salt and sugar as in the human body, and are designed to quickly replace fluids lost during exercise but with an increase of carbohydrate. |
| Hypertonic | Hypertonic drinks have a higher concentration of salt and sugar than the human body. They are best drunk after exercise as it is important to replace glycogen levels quickly after exercise. |
| Hypotonic | Hypotonic drinks are designed to quickly replace fluids lost during exercise. They have very low carbohydrate content and a lower concentration of salt and sugar than the human body. |
| Electrolyte-Enhanced Water | Electrolyte water is water infused with electrically-charged minerals, such as sodium, potassium, calcium, and magnesium. |
| Protein-based Sport Drinks | Protein-based sports drinks are those sports drinks which has added protein in it that will improve performance and reduce muscle protein breakdown. |
| On-Trade | The on-trade refers to places that sell beverages for immediate consumption on the premises like bars, restaurants, and pubs |
| Off-Trade | Off-trade usually means places like liquor stores, supermarkets and other places where you don't consume the beverage right away. |
| Convenience Store | A retail business that provides the public with a convenient location to quickly purchase a wide variety of consumable products and services, generally food and gasoline. |
| Specialty store | A specialty store is a shop/store that carries a deep assortment of brands, styles, or models within a relatively narrow category of goods |
| Online Retail | Online retail is a type of eCommerce whereby a business sells goods or services directly to consumers from a website. |
| Aseptic Packaging | Aseptic packaging refers to the filling of a cold, commercially sterile product under sterile conditions into a presterilized container and closure under sterile conditions to form a seal that effectively excludes microorganisms. These includes tetra packs, cartons, pouches etc. |
| PET Bottle | PET bottle means a bottle made of polyethylene terephthalate. |
| Metal Cans | Metal containers made of aluminum or tin- plated or zinc-plated steel, which are commonly used for packaging food, beverages or other products. |
| Disposable Cups | Disposable Cup means a cup or other container designed for single use to serve beverages, such as water, cold drinks, hot drinks and alcoholic beverages. |
| Gen Z | A way of referring to the group of people who were born in the late 1990s and early 2000s. |
| Millenial | Anyone born between 1981 and 1996 (ages 23 to 38 in 2019) is considered a Millennial |
| Taurine | Taurine is an amino acid that supports immune health and nervous system function. |
| Bars & Pubs | It is a drinking establishment licensed to serve alcoholic drinks for consumption on the premises. |
| Café | It is a foodservice establishment serving refreshments (mainly coffee) and light meals. |
| On the go | It means doing / dealing with while busily engaged with something and not diverting plans in order to accommodate. |
| Internet Penetration | The Internet Penetration Rate corresponds to the percentage of the total population of a given country or region that uses the Internet. |
| Vending Machine | A machine that dispenses small articles such as food, drinks, or cigarettes when a coin or token is inserted |
| Discount store | A discount store or discounter offers a retail format in which products are sold at prices that are in principle lower than an actual or supposed "full retail price". Discounters rely on bulk purchasing and efficient distribution to keep down costs. |
| Clean Label | Clean label on the beverage market are drinks that are made from few ingredients of natural origin and are not or only slightly processed. |
| Caffeine | An alkaloid compound which is a stimulant of the central nervous system. It is mainly used recreationally, as a mild cognitive enhancer to increase alertness and attentional performance. |
| Extreme sport | Action sports, adventure sports or extreme sports are activities perceived as involving a high degree of risk. |
| High-intensity interval training | It incorporates several rounds that alternate between several minutes of high intensity movements to significantly increase the heart rate to at least 80% of one's maximum heart rate, followed by short periods of lower intensity movements. |
| Shelf life | The length of time for which an item remains usable, fit for consumption, or saleable. |
| Cream Soda | Cream soda is a sweet soft drink. Generally flavored with vanilla and based on the taste of an ice cream float |
| Root Beer | Root beer is a sweet North American soft drink traditionally made using the root bark of the sassafras tree Sassafras albidum or the vine of Smilax ornata as the primary flavor. Root beer is typically, but not exclusively, non-alcoholic, caffeine-free, sweet, and carbonated. |
| Vanilla Soda | A carbonated soft drink flavoured with vanilla. |
| Dairy-Free | A product that does not contain any milk or milk products from cows, sheep or goats. |
| Caffeine-Free Energy Drinks | Caffeine-free energy drinks rely on other ingredients to boost the energy. Popular choices include amino acids, B vitamins, and electrolytes. |


Research Methodology
Mordor Intelligence follows a four-step methodology in all our reports.
- Step-1: IDENTIFY KEY VARIABLES: In order to build a robust forecasting methodology, the variables and factors identified in Step 1 are tested against available historical market numbers. Through an iterative process, the variables required for market forecast are set, and the model is built on the basis of these variables.
- Step-2: Build a Market Model: Market-size estimations for the forecast years are in nominal terms. Inflation is not a part of the pricing, and the average selling price (ASP) is kept constant throughout the forecast period for each country.
- Step-3: Validate and Finalize: In this important step, all market numbers, variables, and analyst calls are validated through an extensive network of primary research experts from the market studied. The respondents are selected across levels and functions to generate a holistic picture of the market studied.
- Step-4: Research Outputs: Syndicated reports, custom consulting assignments, databases & subscription platforms


