Market Overview
| Study Period | 2019 - 2030 |
|---|---|
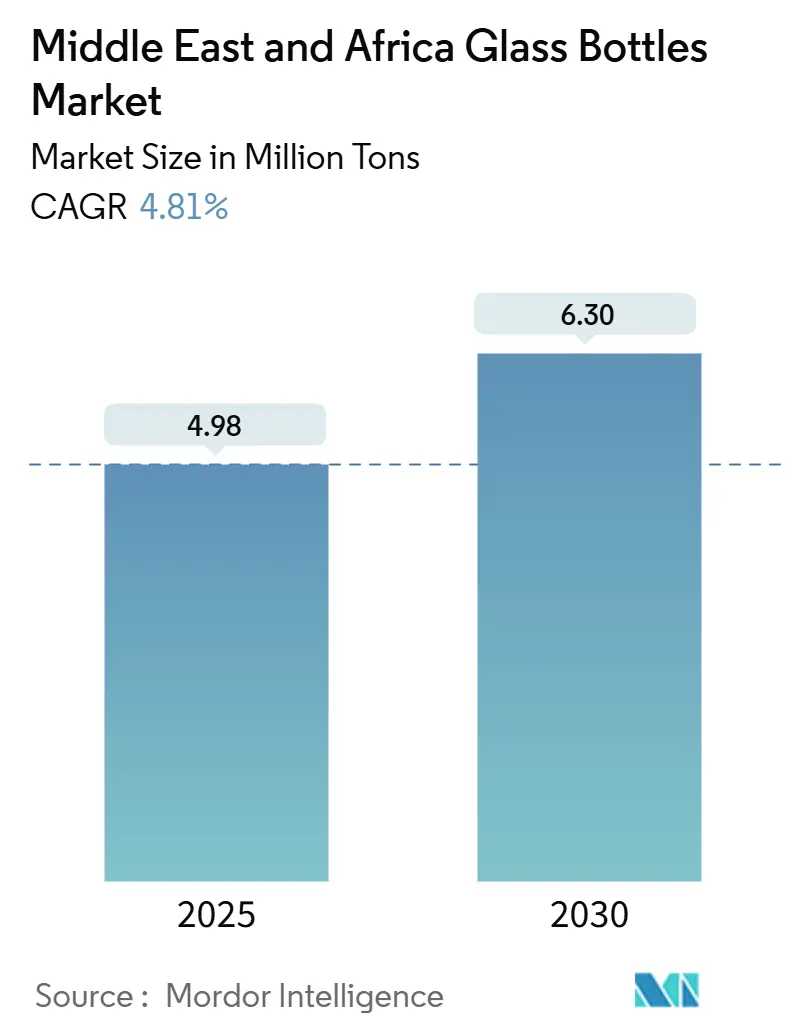
| Market Volume (2025) | 4.98 Million tons |
| Market Volume (2030) | 6.30 Million tons |
| Growth Rate (2025 - 2030) | 4.81% CAGR |
| Fastest Growing Market | Africa |
| Largest Market | Middle East |
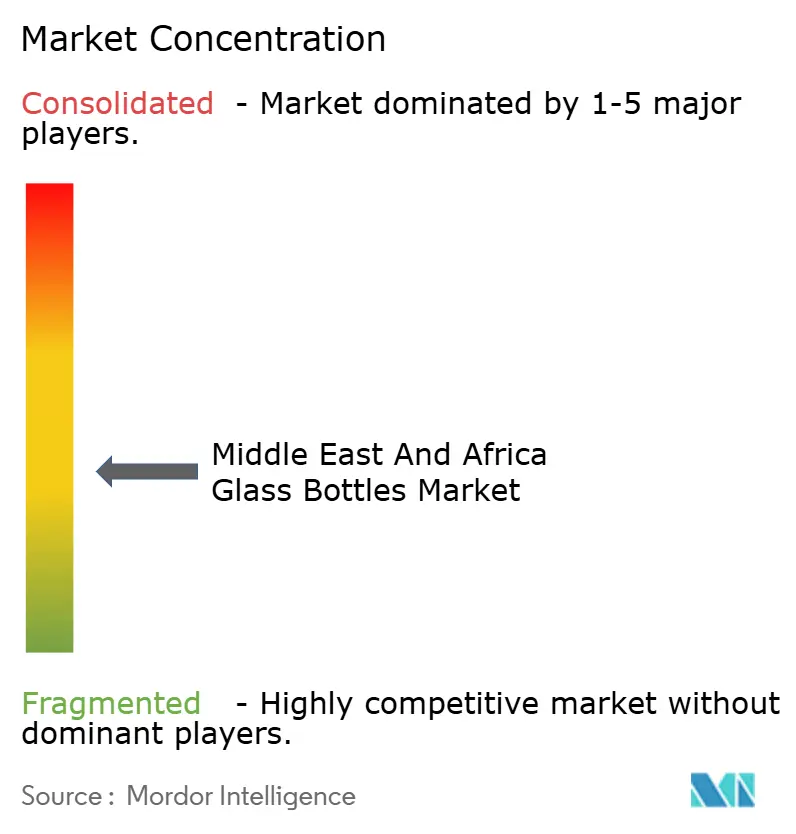
| Market Concentration | Medium |
Major Players *Disclaimer: Major Players sorted in no particular order Image © Mordor Intelligence. Reuse requires attribution under CC BY 4.0. | |
Middle East And Africa Glass Bottles Market Analysis by Mordor Intelligence
The Middle East and Africa Glass Bottles Market size is estimated at 4.98 million tons in 2025, and is expected to reach 6.30 million tons by 2030, at a CAGR of 4.81% during the forecast period (2025-2030). Momentum stems from plastic-substitution mandates, rising pharmaceutical output, and premiumization trends sweeping the beverages, cosmetics, and perfumery sectors. National single-use plastic bans across the GCC compel brand owners to pivot toward endlessly recyclable glass, while large-scale furnace upgrades improve cost positions for early adopters. Growing urban affluence fuels the consumption of packaged goods, especially among Gen Z cohorts, who associate glass with authenticity and eco-consciousness.[1]Carla Seipp, “Gen Z Redefining the Middle East Consumer Landscape,” BeautyMatter, beautymatter.comPharmaceutical clusters in Egypt, Morocco, and the UAE are driving demand for amber and flint containers that meet stringent regulatory standards. Meanwhile, energy-efficient cold-top electric furnaces and rooftop solar arrays cut operating costs and carbon exposure, providing a hedge against volatile fuel prices.
Key Report Takeaways
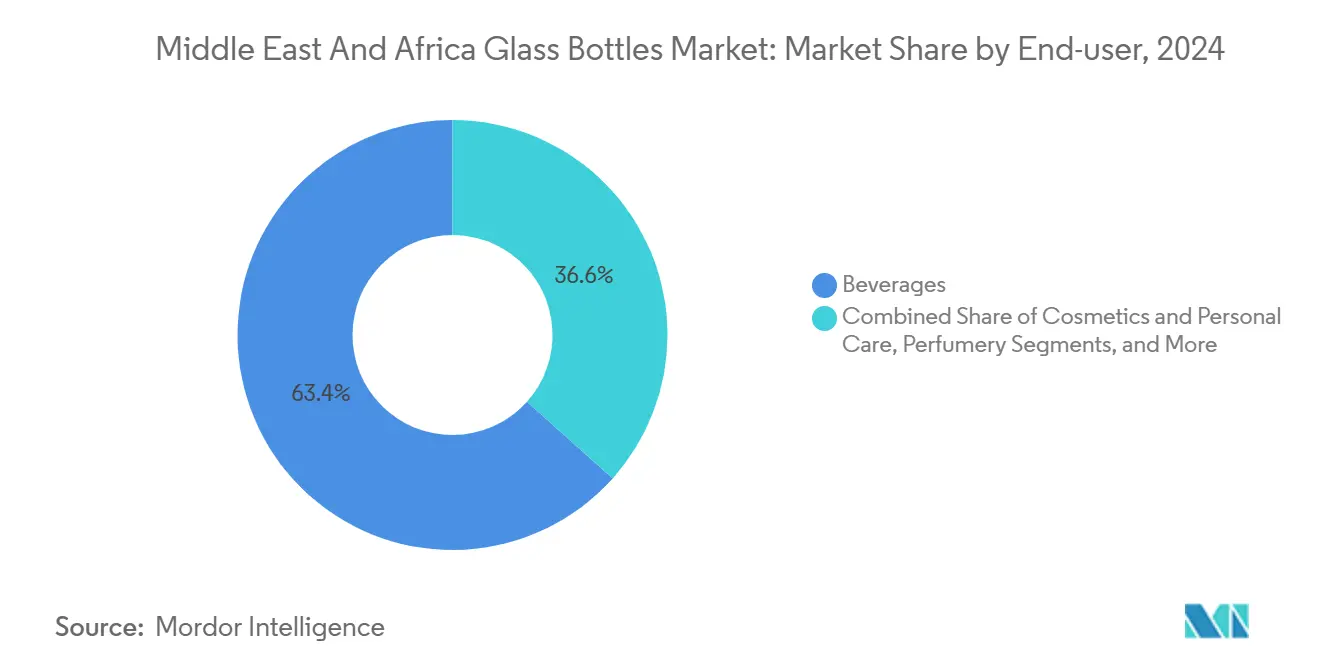
- By end-user, beverages captured 63.38% of the Middle East and Africa glass bottles market share in 2024, and the cosmetics and personal care segment is projected to grow at a 5.738% CAGR between 2025 and 2030.
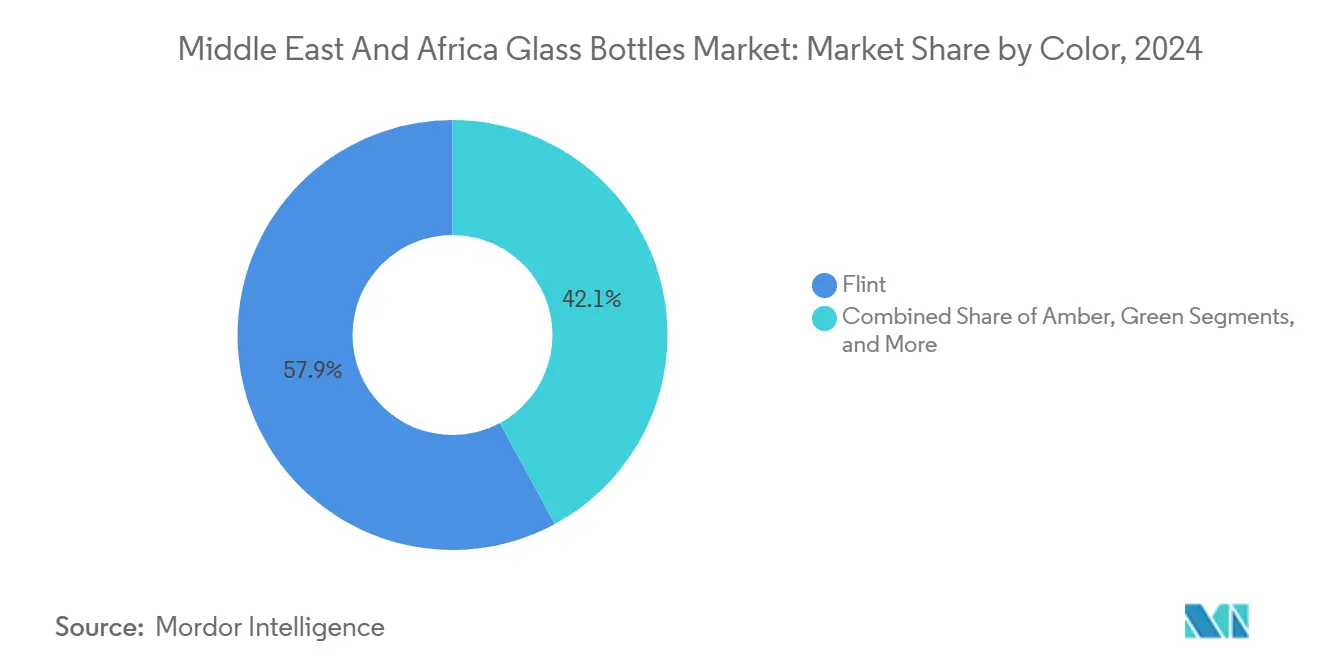
- By color, the Middle East and Africa glass bottles market for amber glass is projected to grow at a 5.68% CAGR between 2025 and 2030, and Flint represents a 57.89% share in 2024.
- By geography, the Middle East captured 53.65% of the Middle East and Africa glass bottles market share in 2024, and Africa, however, is expected to clock a 5.56% CAGR from 2024 to 2030.
Middle East And Africa Glass Bottles Market Trends and Insights
Drivers Impact Analysis*
| Driver | (~) % Impact on CAGR Forecast | Geographic Relevance | Impact Timeline |
|---|---|---|---|
| Urbanization and Lifestyle Shifts Increase Packaged Goods Consumption | +1.2% | Global, with concentration in UAE, Saudi Arabia, Egypt | Medium term (2-4 years) |
| Investment in Lightweighting and Furnace Upgrades Enhances Efficiency | +0.8% | Middle East core, expanding to North Africa | Long term (≥ 4 years) |
| Pharmaceutical Expansion in Egypt, Morocco, and UAE Spurs Glass Demand | +0.9% | Egypt, Morocco, UAE with spillover to broader MENA | Medium term (2-4 years) |
| Surging Beverage Consumption Boosts Demand for Glass Bottles | +1.1% | Global, strongest in Middle East urban centers | Short term (≤ 2 years) |
| Premiumization in Cosmetics and Perfumery Fuels Glass Demand | +0.6% | UAE, Saudi Arabia, with expansion across GCC | Medium term (2-4 years) |
| Sustainability Push and Plastic Substitution Favor Glass Packaging | +1.3% | UAE, Dubai leading, cascading across GCC and North Africa | Short term (≤ 2 years) |
| Source: Mordor Intelligence | |||
Urbanization and lifestyle shifts increase packaged-goods consumption
Rapid urban migration increases per-capita purchases of branded food, beverages, and personal care items that often employ glass packaging. In the UAE, expatriate populations spur demand for premium imports presented in flint bottles, while 71% of Saudi Gen Z shoppers actively seek eco-friendly packaging. The region’s e-commerce value is projected to reach USD 50 billion by 2025, underscoring the need for robust, tamper-evident glass that can withstand last-mile logistics.
Investment in lightweighting and furnace upgrades enhances efficiency
Manufacturing efficiency gains through advanced furnace technology and lightweighting initiatives are reshaping cost structures and competitive positioning across the region. Electroglass cold-top electric furnaces demonstrate thermal efficiencies exceeding 80% at a 100-tonne/day capacity, compared to traditional fuel-fired furnaces that operate at below 50% efficiency. Emirates Glass's installation of 1.20 MWp solar rooftop systems, generating over 1,900 MWh annually and covering 19% of its energy needs, exemplifies how regional manufacturers are integrating renewable energy to reduce operational costs.
Pharmaceutical expansion in Egypt, Morocco, and the UAE spurs glass demand
Hikma Pharmaceuticals is expanding its injectable capacity in Morocco and Algeria, while strengthening supply ties in Jordan and Saudi Arabia, both of which require sterile amber vials and syringes. United Glass Company’s dedicated pharma line in Cairo positions the firm as a regional one-stop shop that meets EU-equivalent GSO 839/1997 and 2231/2012 food-contact rules. These projects underwrite multi-year offtake volumes, lowering revenue volatility for local glassmakers.
Surging beverage consumption boosts glass bottle demand
Dubai's hospitality sector, which hosts 18.8 million tourists annually, with 86.5% staying in hotels, creates concentrated demand for premium beverage packaging. Hotel industry initiatives to eliminate single-use plastic bottles, with over 50 properties having completed their transitions by May 2023, directly translate to increased glass bottle procurement. Consumer preference studies indicate 92% positive sentiment toward glass packaging in beverage applications, driven by perceptions of quality preservation and recyclability.
Restraints Impact Analysis*
| Restraint | (~) % Impact on CAGR Forecast | Geographic Relevance | Impact Timeline |
|---|---|---|---|
| Competition from Plastic and Aluminum Packaging in Mass SKUs | -0.7% | Global, particularly affecting food and mass beverage segments | Short term (≤ 2 years) |
| Logistics and Breakage Risks Limit Glass Adoption in Remote Areas | -0.5% | Rural Africa, remote GCC areas, island territories | Medium term (2-4 years) |
| Limited Cullet Collection Infrastructure in Africa and GCC | -0.4% | Sub-Saharan Africa, select GCC markets excluding UAE | Long term (≥ 4 years) |
| Energy-Intensive Production Raises Cost and Carbon Exposure | -0.6% | Global, with acute impact in energy-import dependent markets | Medium term (2-4 years) |
| Source: Mordor Intelligence | |||
Competition from plastic and aluminum packaging in mass SKUs
Budget-conscious consumers tend to opt for PET and aluminum cans, which offer lower unit costs. Mohinani Group’s rPET capacity in Ghana and Nigeria hit 30,000 t/yr after a USD 37 million IFC-backed expansion, intensifying competition for soft-drink and water contracts.[2]CNS Media, “Mohinani Group Collaborates with Norfund to Advance rPET Packaging Material in West Africa,” Packaging Insights, packaginginsights.comGlass maintains a premium aura but often loses out in high-volume, price-sensitive channels that lack regulatory restraints.
Logistics and breakage risks limit glass adoption in remote areas
Poor road conditions in rural Africa lead to 3-5% breakage losses, eroding cost advantages and deterring bottlers from specifying glass. Rwanda’s plastic ban exposed these constraints, forcing manufacturers to rely on imported bottles, which in turn elevated working-capital needs. Without investment in regional float lines or cullet networks, penetration outside urban centers will lag.
*Our forecasts treat driver/restraint impacts as directional, not additive. The impact forecasts reflect baseline growth, mix effects, and variable interactions.
Segment Analysis
By End-user: Beverages dominate, cosmetics accelerate
Beverages accounted for 63.38% of the Middle East and Africa glass bottles and containers market size in 2024. Craft breweries and premium juice brands continue to adopt flint and green formats to reinforce authenticity. The cosmetics and personal-care segment, although smaller, will grow at a 5.73% CAGR, propelled by Gen Z’s appetite for sustainable luxury and the Gulf’s status as a global perfume capital. Verescence’s glass flacons for Bvlgari’s 2025 Allegra line underscore rising demand for intricate lacquer work in extra-flint substrates.[3]Packaging, “Verescence Creates ‘Gem-Like’ Bottles for Bvlgari,” Cosmetics Business, cosmeticsbusiness.com
The food category remains a steady consumer of condiments, honey, and spreads, while pharmaceutical packaging benefits from North African production expansion. Perfumery, although niche, commands high margins; unit prices exceed those of beverages by more than five times, enticing manufacturers to invest in small-batch decoration technologies.


By Color: Flint retains leadership, amber races ahead
Flint represented 57.89% of the Middle East and Africa glass bottles and containers market share in 2024. Transparency allows consumers to inspect fill levels and product clarity, making flint indispensable for juices, sauces, and color-sensitive creams. Amber will post a 5.68% CAGR through 2030 as pharmaceutical lines seek UV protection and premium spirits pursue an artisanal aesthetic.
Green glass remains entrenched in beer and select wine applications, buoyed by tradition rather than functional superiority. Customized hues, such as cobalt blue and frosted tints, differentiate boutique perfumes and craft gins, albeit at smaller volumes, pointing to a market where value creation hinges on design flexibility as much as volume.
Geography Analysis
Middle Eastern demand led with a 53.65% share in 2024, driven by dense urban centers, strict plastic bans, and world-scale furnace capacity at Şişecam’s 2.6 million tonnes per year Turkish hub. Dubai Investments’ solar-powered Emirates Glass plant yields 2,800 MWh and abates 1,200 t of CO₂ annually, adding ESG luster for regional buyers. Harmonized GSO standards facilitate cross-border flows of food-contact containers.
Africa, however, is expected to clock a 5.56% CAGR through 2030. Nigeria’s Beta Glass posted NGN 15.2 billion pre-tax profit in Q1 2025, a 638.6% leap that propelled its share price 133% by May 2025. Egypt leverages pharma build-outs and strategic Suez logistics, while Morocco attracts export-oriented investors eyeing EU proximity.
Still, many African states struggle with cullet scarcity; South Africa’s 41% recycling rate is an outlier supported by 4,000 bottle banks. Rwanda’s plastic-ban experiment highlighted the fragility of supply chains dependent on imported flint, illuminating the need for localized float capacity before regulatory ambitions can fully translate into glass uptake.
Competitive Landscape
Global majors coexist with agile regional specialists. Ardagh Glass's revenue in Europe and Africa slipped to USD 644 million in Q1 2024, and adjusted EBITDA plunged 55% amid energy price volatility and underutilized furnaces. Conversely, Beta Glass's local scale, captive cullet, and currency hedging delivered outsized margins despite similar inflationary pressures.
Şişecam's new Eskişehir furnace, opened in May 2024, increased consolidated capacity to nearly 1 million tonnes and created 375 jobs, thereby strengthening its bargaining power with beverage giants across the Levant. Energy-efficiency races intensify: Emirates Glass signed a 5-year pact with ClearVue Technology.
In September 2025, Emirates Glass and ClearVue Technology agreed to fabricate solar-integrated glazing for the architectural market, a move that bolsters the ESG credentials and diversifies revenue. Emerging contenders focus on niche value. United Glass Company targets pharma-grade flint and amber, while Verescence courts luxury perfume houses with gem-like flacons.
Middle East And Africa Glass Bottles Industry Leaders
RAK Ghani Glass LLC
Ardagh Group S.A.
Hotpack Packaging Industries LLC
Global Packaging FZC
Saverglass LLC
- *Disclaimer: Major Players sorted in no particular order

Recent Industry Developments
- September 2025: Emirates Glass signed a five-year manufacturing and distribution agreement with ClearVue Technologies to produce solar-integrated glazing, with production slated for late 2025.
- August 2025: Ciner Glass secured EUR 504 million (USD 584 million) financing for a 1,300 t/day Belgian plant to come online in Q2 2026.
- June 2025: The UAE announced a nationwide ban on single-use plastic cups, lids, cutlery, and plates effective Jan 2026.
- May 2025: Beta Glass became Nigeria’s best-performing stock with 133% returns after reporting NGN 41.1 billion revenue (USD 92.7 million) and NGN 15.2 billion profit (USD 34.3 million) for Q1 2025.


Middle East And Africa Glass Bottles Market Report Scope
The Middle East and Africa Glass Bottles Market Report is segmented by End-User, which includes Beverages [Alcoholic (Beer, Wine, Spirits, and Other Alcoholic Beverages such as Cider and Fermented Drinks) and Non-Alcoholic (Carbonated Drinks (CSDs), Dairy Product-Based Drinks, Juices, and Other Non-Alcoholic Beverages)], Food (Jam, Jelly, Marmalades, Honey, Condiments, Oil, Pickles), Cosmetics and Personal Care, Pharmaceuticals (excluding Vials and Ampoules), and Perfumery. The market is further categorized by Color, including Flint, Amber, Green, and Other Colors; and by Country, covering the Middle East (United Arab Emirates, Saudi Arabia, Turkey, and the Rest of the Middle East) and Africa (Egypt, Nigeria, Morocco, South Africa, and the Rest of Africa). The market forecasts are provided in terms of volume (tons).
By End-user
| Beverages | Alcoholic | Beer |
| Wine | ||
| Spirits | ||
| Other Alcoholic Beverages (Cider and Other Fermented Drinks) | ||
| Non-Alcoholic | Juices | |
| Carbonated Drinks (CSDs) | ||
| Dairy Product Based Drinks | ||
| Other Non-Alcoholic Beverages | ||
| Food (Jam, Jelly, Marmalades, Honey, Sausages and Condiments, Oil, Pickles) | ||
| Cosmetics and Personal Care | ||
| Pharmaceuticals (excluding Vials and Ampoules) | ||
| Perfumery | ||
By Color
| Green |
| Amber |
| Flint |
| Other Colors |
By Country
| Middle East | United Arab Emirates |
| Saudi Arabia | |
| Turkey | |
| Rest of Middle East | |
| Africa | Egypt |
| Nigeria | |
| Morocco | |
| South Africa | |
| Rest of Africa |
| By End-user | Beverages | Alcoholic | Beer |
| Wine | |||
| Spirits | |||
| Other Alcoholic Beverages (Cider and Other Fermented Drinks) | |||
| Non-Alcoholic | Juices | ||
| Carbonated Drinks (CSDs) | |||
| Dairy Product Based Drinks | |||
| Other Non-Alcoholic Beverages | |||
| Food (Jam, Jelly, Marmalades, Honey, Sausages and Condiments, Oil, Pickles) | |||
| Cosmetics and Personal Care | |||
| Pharmaceuticals (excluding Vials and Ampoules) | |||
| Perfumery | |||
| By Color | Green | ||
| Amber | |||
| Flint | |||
| Other Colors | |||
| By Country | Middle East | United Arab Emirates | |
| Saudi Arabia | |||
| Turkey | |||
| Rest of Middle East | |||
| Africa | Egypt | ||
| Nigeria | |||
| Morocco | |||
| South Africa | |||
| Rest of Africa | |||


Key Questions Answered in the Report
How large is the Middle East and Africa glass bottles and containers market in 2025?
The market totals 4.81 million tons in 2025 and is projected to reach 6.30 million tons by 2030.
Which segment is growing fastest?
Cosmetics and personal care will advance at a 5.73% CAGR through 2030, eclipsing other end-user categories.
Why is amber glass demand rising?
Pharmaceutical expansion in Egypt, Morocco, and the UAE and premium beverage positioning drive a 5.68% CAGR for amber containers.
What regulations are shaping demand?
GCC-wide plastic bans and GSO 839/1997 standards for food-contact materials are accelerating glass adoption across packaged goods.
Which companies lead the regional landscape?
Ardagh Glass, Şişecam, and Beta Glass collectively hold more than 45% volume share, with Beta Glass posting standout profitability in 2025.
Page last updated on:


