
Market Overview
| Study Period | 2020 - 2031 |
|---|---|
| Forecast Data Period | 2026 - 2031 |
| Historical Data Period | 2020 - 2024 |
| Market Size (2026) | USD 19.22 Billion |
| Market Size (2031) | USD 22.78 Billion |
| Growth Rate (2026 - 2031) | 3.46 % |
| Market Concentration | High |
Major Players *Disclaimer: Major Players sorted in no particular order Image © Mordor Intelligence. Reuse requires attribution under CC BY 4.0. | |
Mexico Telecom MNO Market Analysis by Mordor Intelligence
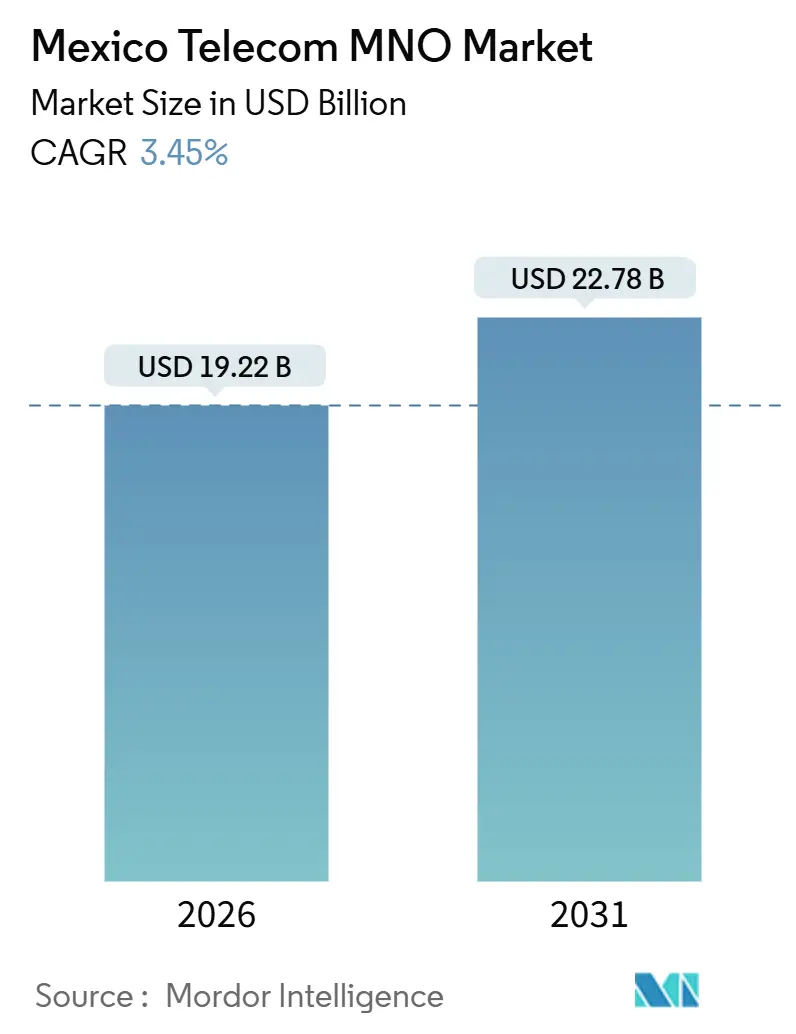
The Mexico Telecom MNO Market size is estimated at USD 19.22 billion in 2026, and is expected to reach USD 22.78 billion by 2031, at a CAGR of 3.45% during the forecast period (2026-2031). In terms of subscriber volume, the market is expected to grow from 133.83 million subscribers in 2026 to 155.19 million subscribers by 2031, at a CAGR of 3.01% during the forecast period (2026-2031).
This expansion of the Mexico telecom MNO market reflects a delicate balance: rising postpaid adoption and IoT monetization are pushing data average revenue per user higher, while persistent prepaid churn and spectrum fees that sit roughly 60% above global norms are compressing margins. Operators are channeling capital into mid-band 5G, yet the structural overhaul of the regulatory framework in 2025 has created uncertainty around future spectrum auctions, forcing firms to adopt staged roll-out plans. Private-sector spending on towers and fiber has accelerated because new passive-infrastructure-sharing rules allow multiple carriers to lease the same sites, reducing redundant capex and shortening payback periods. Meanwhile, the wholesale Red Compartida network has lowered rural coverage costs, allowing more than 100 MVNOs to undercut incumbent pricing and intensifying competition for the Mexico telecom MNO market.
Key Report Takeaways
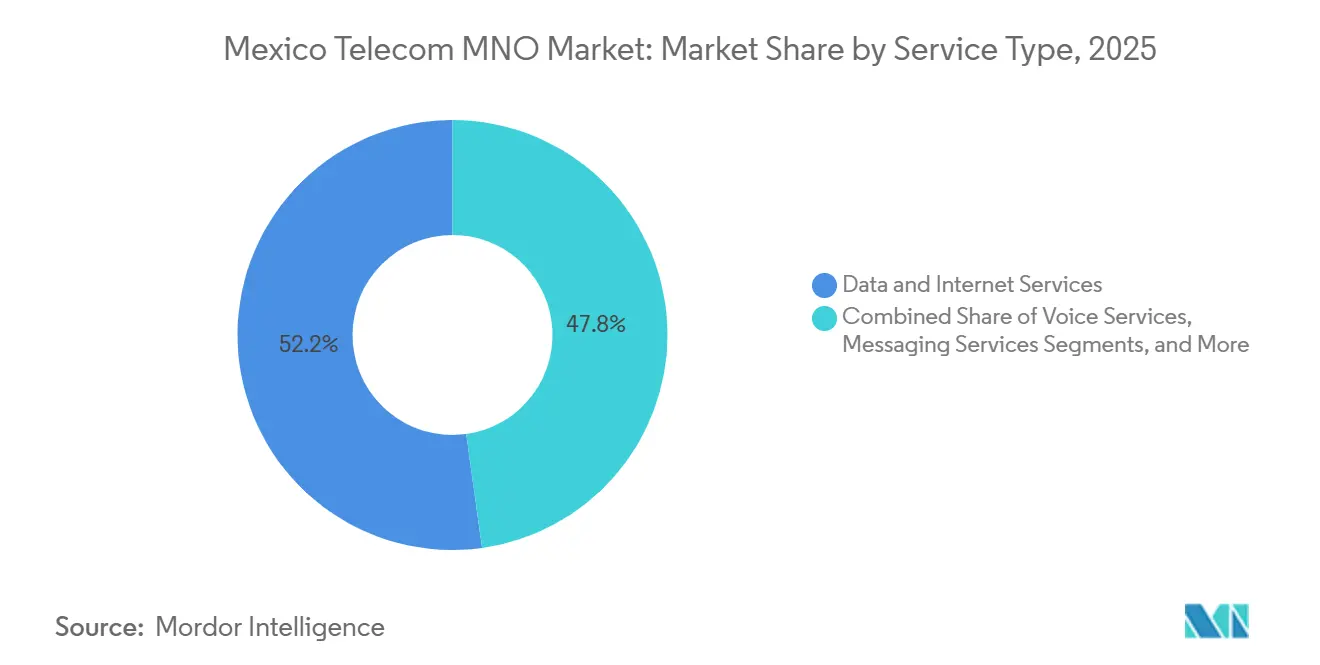
- By service type, Data and Internet Services led with 52.19% of the Mexico telecom MNO market share in 2025; IoT and M2M Services are poised to expand at a 4.57% CAGR through 2031.
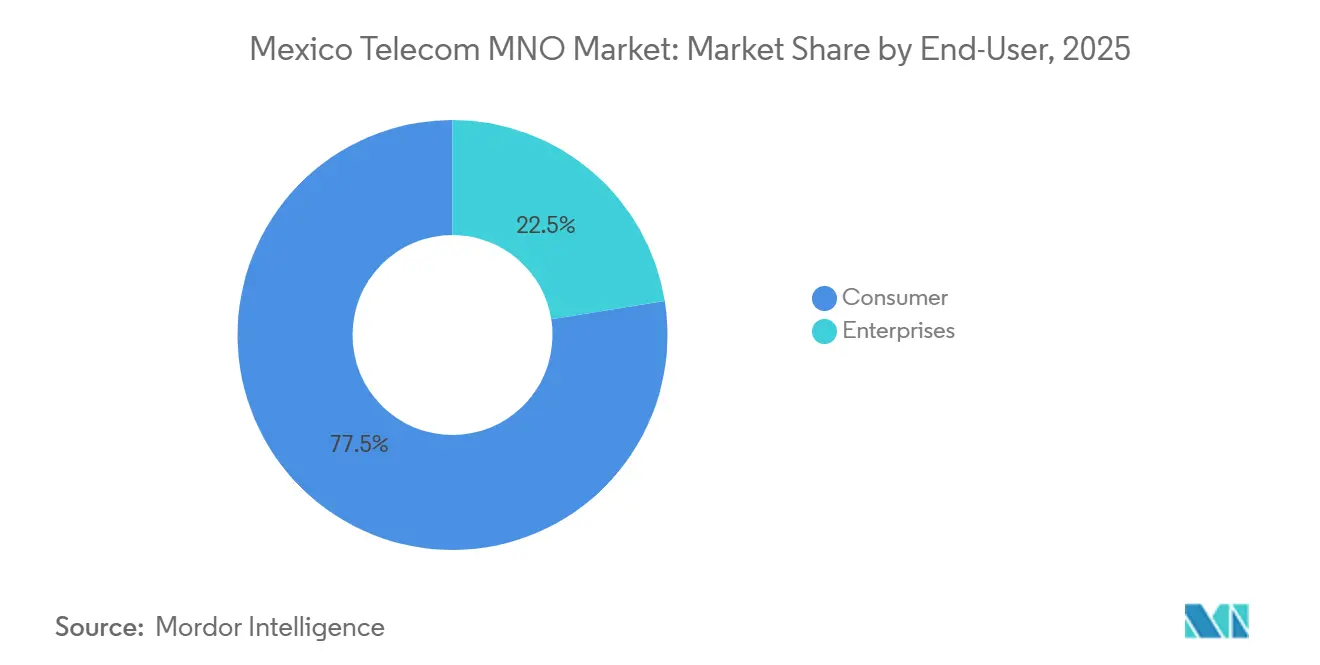
- By end-user, the Consumer segment accounted for 77.52% of the Mexico telecom MNO market size in 2025, while the Enterprises segment is projected to grow at a 3.86% CAGR to 2031.
Note: Market size and forecast figures in this report are generated using Mordor Intelligence’s proprietary estimation framework, updated with the latest available data and insights as of January 2026.
Mexico Telecom MNO Market Trends and Insights
Drivers Impact Analysis*
| Driver | (~) % Impact on CAGR Forecast | Geographic Relevance | Impact Timeline |
|---|---|---|---|
| Rapid 5G Roll-Out Boosts Data ARPU | +1.2% | National, concentrated in Mexico City, Monterrey, Guadalajara metropolitan areas | Medium term (2-4 years) |
| IoT Demand from Nearshoring Manufacturing and Automotive Clusters | +0.9% | Northern states (Nuevo León, Querétaro, Guanajuato, Baja California) with spillover to Aguascalientes, San Luis Potosí | Medium term (2-4 years) |
| Red Compartida Lowers Rural Roll-Out Cost and Expands Coverage | +0.6% | National, priority in underserved rural municipalities | Long term (≥ 4 years) |
| OTT Video and Mobile-Gaming Partnerships Drive Traffic Monetization | +0.4% | National, skewed toward urban postpaid and youth demographics | Short term (≤ 2 years) |
| 2G and 3G Sunset Frees Sub-1 GHz Spectrum for Capacity | +0.3% | National, accelerated impact in rural areas | Medium term (2-4 years) |
| New Passive-Infrastructure-Sharing Rules Cut Capex | +0.2% | National, benefiting operators in high-density urban zones and underserved rural sites | Short term (≤ 2 years) |
| Source: Mordor Intelligence | |||
Rapid 5G Roll-Out Boosts Data ARPU
Telcel’s network covered 125 cities and 12.3 million 5G subscribers by late 2024, posting median download speeds near 228 Mbps, roughly four times the all-technology average. Postpaid blended ARPU rose to MXN 186 during 2025, a 4.9% year-on-year uplift, as speed and latency improvements enabled premium tiers bundling unlimited social media and cross-border calling [1]América Móvil, “América Móvil’s third quarter of 2025 financial and operating report,” americamovil.com. Performance leadership has let Telcel price above peers, while AT&T and Movistar trail with 5G speeds below 70 Mbps, cementing a two-tier market. Operators now view 5G less as a coverage race and more as a margin lever, targeting latency-sensitive use cases such as cloud gaming. The Mexico telecom MNO market therefore links 5G investment directly to revenue quality rather than subscriber counts, encouraging capital allocation to high-density corridors before rural expansion. Over the medium term, sustained ARPU growth hinges on successful migration of prepaid users to postpaid plans that monetize 5G performance.
IoT Demand from Nearshoring Manufacturing and Automotive Clusters
IoT and M2M connections topped 15 million in 2024, with automotive and electronics manufacturers leading adoption as supply chains shift from Asia under USMCA incentives. General Motors, Ford, and Tesla assembly sites in Nuevo León, Querétaro, and Guanajuato depend on ultra-reliable low-latency connectivity for robotics and quality control, pushing operators to offer private LTE slices and edge-computing bundles.[2]Reuters, “America Movil forecasts USD 6.7 billion capex for 2025,” reuters.com Source: Telecom Review Americas, “Telefónica México: The Disruptive Operator of Connectivity Democratization,” telecomreviewamericas.com Regional revenue outperforms national averages by up to 300 basis points because each plant deploys thousands of sensors. Managed IoT services lift ARPU multiples three-fold, redefining the growth narrative for the Mexico telecom MNO market from consumer scale to enterprise margin. Operators that integrate cybersecurity and analytics with connectivity are positioned to claim a deeper share of manufacturer IT budgets. As nearshoring accelerates, the IoT growth vector is expected to remain the fastest within the service portfolio through 2031.
Red Compartida lowers rural roll-out cost and expands coverage
Operated by CFE Telecomunicaciones, Red Compartida hit 70% national coverage in 2024, offering 700 MHz wholesale capacity that reduces per-site capex by up to 60% compared with traditional builds. Hispasat’s Ka-band satellite backhaul unlocked 65 additional remote base stations, connecting 600,000 people in low-density areas.[3]HISPASAT, “HISPASAT will provide Ka band satellite links to extend Altán la Red Compartida,” hispasat.com The model shifts rural economics for the Mexico telecom MNO market, enabling MVNOs to introduce sub-MXN 200 plans and compelling incumbents to re-price entry-level tariffs. While Telcel has challenged state support in court, government commitment to universal service indicates that wholesale coverage will keep expanding, narrowing the urban-rural divide. Over the long term, rural adoption will become a volume engine, though operators must differentiate through quality and bundled content rather than pure footprint.
OTT video and mobile-gaming partnerships drive traffic monetization
Average monthly data consumption per user has risen sharply as carriers package zero-rated access to Netflix, Disney+, and Amazon Prime Video into mid-tier plans. The strategy trades network costs for lower churn and higher lifetime value, supporting higher pricing in the Mexico telecom MNO market. Telcel recorded the top 5G gaming experience score at 82.93 in late 2024, with median 80 ms latency, allowing operators to market cloud-gaming bundles that add 10%-15% to high-end ARPU. Increasingly, value propositions center on guaranteed latency rather than volumetric data, transforming tariff structures. Partnerships with gaming publishers are expected to mature into dedicated network slices, further segmenting premium user tiers. Short-term gains materialize quickly, but sustaining momentum will depend on continuous network upgrades to maintain service quality.
Restraints Impact Analysis*
| Restraint | (~) % Impact on CAGR Forecast | Geographic Relevance | Impact Timeline |
|---|---|---|---|
| Spectrum Fees Among the World’s Highest Limit 5G Coverage | -0.8% | National, heavier drag on rural and peri-urban economics | Long term (≥ 4 years) |
| Proposed 2025 Telecom Law Clouds Regulatory Certainty | -0.6% | National, affects auctions, sharing, and competition policy | Medium term (2-4 years) |
| High Prepaid Churn Suppresses Profitability | -0.4% | National, concentrated in low-income segments | Short term (≤ 2 years) |
| Rural Backhaul Gaps Keep 18% Population Outside 4G | -0.3% | Rural municipalities in Oaxaca, Chiapas, Guerrero | Long term (≥ 4 years) |
| Source: Mordor Intelligence | |||
Spectrum Fees Among the World’s Highest Limit 5G Coverage
Reserve prices that run 60% above global averages crippled the 2021 spectrum auction, with only 3 of 41 blocks sold. The follow-up tender slated for late 2024 was canceled, freezing access to mid-band frequencies desperately needed for capacity. A coverage-for-discount auction has been penciled in for 2026, but the newly formed Telecommunications Regulatory Commission lacks a track record, raising the risk of design flaws or delays. América Móvil’s Mexico EBITDA margin of 41.3% in 2024 underscores capital discipline amid spectrum scarcity. Without fee reform, nationwide 5G roll-out will remain skewed toward dense urban corridors, capping total addressable revenue for the Mexico telecom MNO market.
Proposed 2025 Telecom Law Clouds Regulatory Certainty
The July 2025 dissolution of the autonomous IFT split policy formulation from enforcement, creating potential for conflicting mandates. Operators remain uncertain whether asymmetric rules on Telcel will be eased, maintained, or tightened, complicating investment planning. The OECD has warned that predictability in spectrum policy underpinned past investment success.[4]OECD, “Bridging Connectivity Divides,” oecd.org Capital allocation for the Mexico telecom MNO market now contemplates regulatory risk equal to competitive and technological risk, prompting Telefónica to weigh a full exit. Until clarity emerges, carriers may defer rural expansion and secondary-city densification, slowing the sector’s growth cadence.
*Our forecasts treat driver/restraint impacts as directional, not additive. The impact forecasts reflect baseline growth, mix effects, and variable interactions.
Segment Analysis
By Service Type: Data Dominance Meets IoT Acceleration
Data and Internet Services commanded 52.19% of the Mexico telecom MNO market in 2025, mirroring nationwide smartphone penetration above 80% and the ubiquity of unlimited social-media bundles. Voice revenues have commoditized, with pay-as-you-go minutes priced at MXN 0.0125, while SMS traffic continues to migrate to OTT applications. IoT and M2M Services represent the fastest-growing slice at a 4.57% CAGR through 2031, reflecting industrial sensor deployments and smart-city pilot projects in Monterrey and Guadalajara. OTT and PayTV add stickiness to high-value tariffs via bundled content, exemplified by Telcel’s 2025 “Libre” plans.
Differentiation now hinges on upselling managed IoT platforms that combine connectivity with edge analytics and cybersecurity, lifting margins well above basic data transport. Operators that execute on this pivot can turn low-ARPU machine connections into corporate accounts generating triple the revenue of consumer plans. Wholesale capacity and roaming remain adjunct revenue streams, useful for extracting value from excess backhaul and spectrum. Overall, the Mexico telecom MNO market is evolving toward a portfolio mix that favors high-bandwidth consumer data and high-margin enterprise IoT, while legacy voice and messaging steadily lose relevance.



By End-User: Consumer Scale Versus Enterprise Margin
Consumers delivered 77.52% of 2025 revenue, anchored by 84.6 million wireless lines of which 81% were prepaid. Churn rates above 3% per month reflect fierce price competition fueled by more than 100 MVNOs leveraging Red Compartida’s wholesale access. Postpaid penetration, however, is rising at 3.1% year-on-year, and postpaid ARPU is double that of prepaid, making migration strategies a priority.
Enterprises account for only 22.48% of current revenue but are advancing at a 3.86% CAGR, supported by nearshoring manufacturers that demand private LTE and edge solutions. Multi-year contracts, vertical integration, and cross-sell potential create resilient cash flows. Operators investing in dedicated enterprise sales teams and industry-specific solutions stand to capture disproportionate gains. Regulatory outcomes that determine Telcel’s bundling rights will influence competitive dynamics, but regardless of policy, enterprise digitalization is set to raise the strategic importance of this segment within the Mexico telecom MNO market.
Geography Analysis
Metropolitan Mexico City, Monterrey, and Guadalajara attract over three-quarters of new 5G investment because densities above 1,000 inhabitants per square kilometer and postpaid penetration north of 30% shorten payback periods for mid-band roll-outs. Northern manufacturing hubs in Nuevo León, Querétaro, and Baja California post enterprise connectivity growth that is two to three percentage points faster than the national rate as automotive and electronics plants demand low-latency IoT links. Red Compartida’s 70% footprint, reinforced by Hispasat Ka-band satellite backhaul, has pulled towns under 10,000 people into the coverage map and enabled more than 100 MVNOs to introduce sub-MXN 200 plans, shaving the urban-rural divide. These gains coexist with spectrum scarcity, so operators focus first on corridors where blended ARPU exceeds MXN 180, then layer incremental sites outward once fiber backhaul is in place. As a result, the Mexico telecom MNO market shows a mosaic of ultrafast pockets surrounded by legacy 4G zones that still host 18% of the population.
Urban centers generate roughly 75% of service revenue even though they house only 60% of residents, a gap driven by higher smartphone ownership and stronger enterprise demand. Border states such as Baja California monetize cross-border calling bundles to the United States, while inland cities like Puebla, León, and Tijuana are emerging as secondary 5G nodes because they combine acceptable density with lower competitive intensity than Mexico City or Monterrey. Rural deployment can cost 60% more in mountainous Oaxaca and Guerrero, so carriers lean on passive tower sharing and Red Compartida wholesale access to keep cash needs manageable. The planned 2026 coverage-for-discount spectrum tender is designed to lower upfront fees for operators willing to serve underserved municipalities, a policy that, if executed cleanly, could accelerate 4G and 5G reach.
Secondary-city momentum is creating fresh connectivity corridors: industrial parks in San Luis Potosí and Aguascalientes now attract tier-one automotive suppliers that request dedicated fiber and private LTE slices, generating enterprise revenue where little existed five years ago. Tower companies such as Telesites, American Tower, and Mexico Tower Partners lease sites to multiple tenants, trimming redundant capex by up to 30% and making low-density roll-outs economically viable. Government support remains pivotal, as the state-owned Red Compartida plans to hit 92.2% population coverage by 2028, an ambition that would narrow geographic revenue imbalances but will not erase them because income gaps and enterprise density still favor large metros. Overall, geography will matter less for basic coverage but more for premium service uptake, with ARPU differentials enduring even as physical connectivity improves.
Regulatory Landscape
Mexico overhauled telecom governance in July 2025 with the publication of the new Federal Telecommunications and Broadcasting Law, which dissolved the autonomous IFT and split responsibilities across the Agency for Digital Transformation and Telecommunications (ATDT) for policy and the Telecommunications Regulatory Commission (CRT) for technical and operational regulation. This shift coincides with key market frictions already tracked in the report, including spectrum fees that run roughly 60% above global norms, and uncertainty around the mechanics and timing of future spectrum awards, including the in-scope discussion of a 2026 coverage-linked tender concept.
Through late 2025 and 2026, the CRT has been issuing day-to-day oversight decisions through operational rulings, including determinations for non-agreed interconnection conditions among operators, alongside cross-agency coordination. In March 2026, the CRT and the National Antimonopoly Commission (CNA) signed an agreement to coordinate the biennial review of preponderance measures, anchoring how asymmetric obligations on the dominant operator are assessed. Separately, the enforcement of mandatory mobile line registration to the national CURP database, with a compliance deadline set around late June 2026, adds another compliance and customer-management layer for operators and MVNOs active in the Mexico telecom MNO market.
Competitive Landscape
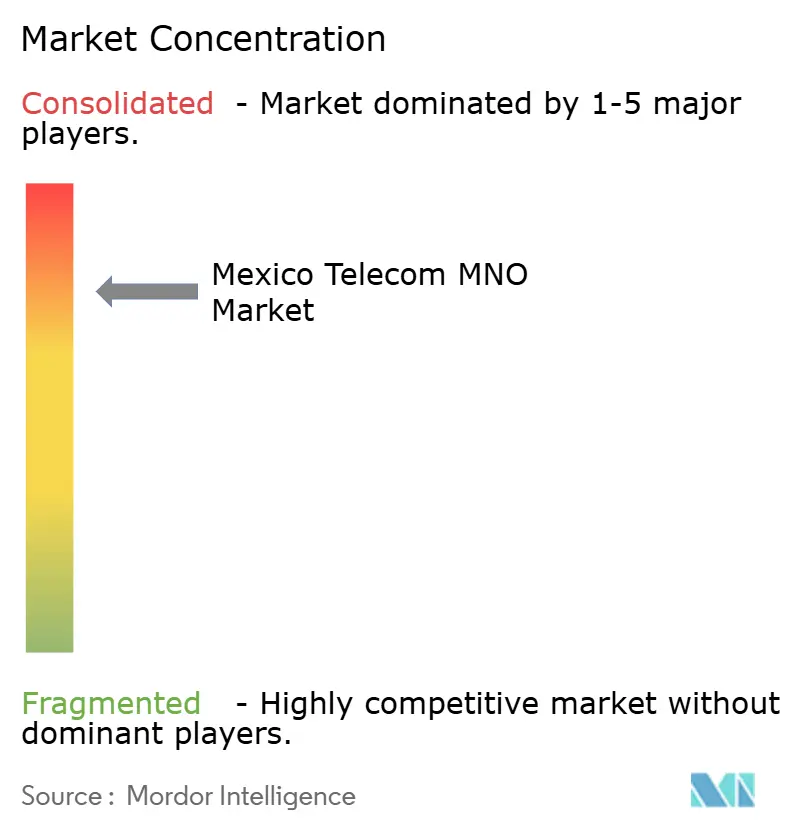
Telcel dominates the Mexico telecom MNO market with about 70% share, a position fortified by deep C-band spectrum holdings and an exclusive retail presence in 15,000 Oxxo stores that drew a USD 94 million fine in June 2025 for anticompetitive behavior. AT&T moved to exit by selling its local unit to Telefónica for USD 2.2 billion in October 2024, and Telefónica has since weighed a full departure by mid-2026, underscoring pressure on second-tier players. More than 100 MVNOs, riding on Red Compartida, now offer entry plans priced 30%-50% below incumbent tariffs, siphoning price-sensitive prepaid users and forcing constant promotional activity from network operators.
Technology leadership is Telcel’s chief moat: median 5G speeds exceed 200 Mbps with 89.7% consistency, allowing premium price tiers and lower churn among high-value accounts. Competitors compensate by renting rather than owning assets, leveraging tower portfolios from American Tower and Telesites to keep capital needs in check. Passive-sharing rules introduced in 2024 lowered urban build costs by up to 30%, making network densification feasible for smaller brands. MVNOs such as Flash Mobile and Bait rely on this wholesale fabric to stay asset-light and focus on marketing, yet their razor-thin margins limit large-scale investment in differentiated services.
Future rivalry will hinge on regulatory resolve. If the Telecommunications Regulatory Commission keeps asymmetric obligations on Telcel and mandates fair access to Red Compartida, challengers can scale enterprise IoT and rural niches where bespoke solutions outweigh raw coverage. Should oversight soften, Telcel’s economies of scale and spectrum depth could entrench its lead, potentially lifting its share beyond today’s already high level. Enterprise accounts offer the best hedge for rivals because managed services tie customers into multi-year contracts and yield margins above 50%. For Telcel, protecting dominance means converting its speed advantage into ecosystem stickiness, pairing 5G with exclusive video, gaming, and fintech bundles. Overall, the market blends high concentration with pockets of agile innovation, a recipe that sustains intense yet asymmetric competition across consumer and enterprise segments.
Mexico Telecom MNO Industry Leaders
Telcel (América Móvil)
AT&T México
Telefónica Movistar México
- *Disclaimer: Major Players sorted in no particular order

Market Opportunities and Future Outlook
Enterprise monetization tied to nearshoring remains the clearest whitespace for MNOs. IoT and M2M connections exceeded 15 million in 2024, and manufacturers in Nuevo Leon, Queretaro, and Guanajuato are adopting sensor-heavy operations that align with private LTE/5G deployments, edge computing, and managed security bundles. That supports a broader service mix shift already visible in the market, where data and internet services accounted for 52.19% of revenue in 2025, while IoT and M2M is the fastest-growing service category in the report segmentation. Operators that package connectivity with analytics and cybersecurity can capture more of plant-level IT and OT budgets than connectivity-only offers, and multi-year enterprise contracts can help offset high prepaid churn in the consumer base.
Network economics and compliance-driven processes also shape the opportunity set. Passive infrastructure sharing introduced in 2024 reduces duplicated build costs, while Red Compartida provides a wholesale route to extend 4G/5G into underserved municipalities where 18% of the population still sits outside 4G due to backhaul gaps. In 2026, reported year-on-year growth in mobile services in early 2026 and continued 5G and fiber deployments support near-term execution, while policy initiatives such as the 2026-2030 National Spectrum Program point to rural connectivity and a more continuous spectrum assignment approach rather than isolated tenders. At the same time, the CURP-linked line registration mandate and the CRT-CNA preponderance review process create operational and competitive inflection points, favoring operators and MVNOs that can scale customer verification, reduce involuntary churn, and differentiate on network quality and bundled services rather than headline pricing alone.
Recent Industry Developments
- June 2026: Telcel (América Móvil) CRT grants temporary 5-minute approval for 330 MHz spectrum to Telcel, AT&T, and Altán Redes for 2026 FIFA World Cup connectivity. The measure enables coordinated spectrum use to bolster nationwide coverage during the event. This action supports competitive parity by ensuring sufficient capacity for peak demand across major markets.
- June 2026: AT&T México CRT requires AT&T to pay 1.472 billion pesos to renew 800/850 MHz spectrum concessions. The renewal creates a regulatory cost that will influence investment budgeting. The payment obligation shapes capex planning and affects competitive positioning amid ongoing spectrum renewals.
- June 2026: Comisión Reguladora de Telecomunicaciones (CRT) extends mandatory mobile line registration deadlines on a staggered schedule. The regulatory change affects the SIM registration process across operators. It imposes new operational requirements and timelines for all MNOs to manage subscriber registrations.


Research Methodology Framework and Report Scope
Market Definition and Coverage
For this methodology, the Mexico telecom market is defined as operator service revenues generated in Mexico from mobile network services that customers pay for, across consumer and enterprise use.
Scope exclusions: We exclude handset and device sales, as well as pure infrastructure leasing revenues that do not reflect retail service consumption.
Segmentation Overview
- Overall Telecom Revenue and ARPU
- Service Type
- Voice Services
- Data and Internet Services
- Messaging Services
- IoT and M2M Services
- OTT and PayTV Services
- Other Service Type
- End-user
- Enterprises
- Consumer
Data Sources, Market Sizing, and Validation
Desk Research
Desk research is used to set the outer limits of the model, so the totals stay aligned with real Mexico connectivity and spending patterns. We mainly relied on public statistics and industry dashboards such as IFT publications, ITU indicators, World Bank macro series, and OECD broadband and mobile datasets, which help with subscriber counts, penetration, and usage context.
We also reviewed operator annual reports and investor presentations, along with press releases and reputable business press for tariff moves, network rollouts, and packaging changes that can shift ARPU. In addition, we referenced paid subscriptions for company financials and intelligence, patent databases, and an import-export shipment-level database to sense-check capex intensity and the direction of device cycles when that affects service uptake. The desk sources listed here are illustrative, and we also used other public and paid sources for cross-checks and clarification during the work.
Primary Interviews and Surveys
Primary work focused on validating the revenue pool and the main drivers behind service pricing and usage, so assumptions are not purely spreadsheet-led. We spoke with a mix of operator-side leaders, channel and distribution specialists, enterprise connectivity buyers, and independent industry experts across Mexico to confirm adoption trends, plan mix, and typical price movement by service.
Input from these discussions was used to fill gaps in secondary data, and then to test model outputs against on-the-ground signals such as promotions, churn pressure, and bundle behavior in mass market and business segments.
Distribution of primary research fieldwork respondents
| Company type | Respondent position |
|---|---|
| Top tier: 25% | CXOs: 15% |
| Mid tier: 56% | Functional/Unit leaders: 36% |
| Smaller Players: 19% | Managers: 49% |
Market-Sizing & Forecasting
Sizing starts with a top-down build that reconstructs the addressable revenue pool from Mexico operator service lines, then aligns it to demand signals such as subscriber base, smartphone share, and data usage growth. Once the market shape is established, we run selective bottom-up checks using sampled plan price points, estimated active subscriber counts by service type, and channel feedback on typical bundle attach rates.
Key inputs tracked include mobile subscribers and net adds, ARPU movement by prepaid and postpaid mix, mobile data consumption trends (GB per user), 4G and 5G coverage and adoption milestones, and enterprise demand for IoT and M2M connections. Where a line item is not consistently disclosed, we use proxy ratios confirmed in interviews and then constrain them using observed market behavior such as promotion frequency and price resets.
For forecasting, scenario analysis is used around regulatory shifts, inflation and FX effects on pricing, and spectrum and rollout timing. We then smooth the selected path using time-series logic to avoid unrealistic jumps. Assumptions are kept simple enough to re-run each update cycle, so changes in drivers like ARPU or subscribers can be traced through to the total market value.
Data Validation & Update Cycle
Outputs are checked in layers before sign-off, starting with basic variance tests against historical trends, then moving to sanity checks against independent indicators such as reported subscriber counts, broadband access trends, and macro consumer spending direction. When a metric breaks pattern, we reopen the driver and either correct, cap, or re-anchor the assumption to a more defensible input.
A second analyst review is performed to confirm the math, the scope logic, and the narrative links to the inputs. Reports are refreshed annually, and interim updates are triggered when material events occur such as major pricing actions, regulatory changes, or large network milestones. Before delivery, a final review pass is completed so clients receive the latest updated view.
Mordor Intelligence's Mexico Telecom Market Size Compared With Other Published Estimates
Published market values for Mexico telecom can look far apart, even when they appear to cover the same space. The gap usually comes from what each publisher counts as telecom revenue, how pay-TV and OTT are treated, and how quickly pricing and subscriber assumptions are refreshed.
Some external estimates are built as a broad telecom plus pay-TV service revenue pool, and that pushes totals higher by including adjacent services. In Mordor Intelligence, the total is limited to Mexico mobile network operator service revenues, and categories like handset sales are kept outside the market value so the model stays tied to service consumption.
Benchmark comparison
| Source | Market Size | Gaps in Research Methodology |
|---|---|---|
| Mordor Intelligence | USD 19.22 B (2026) | |
| Global Consultancy A | USD 25.70 B (2024) | Uses a wider revenue definition that combines telecom services with pay-TV services, and the figure is anchored to a different base year, which changes FX timing and price-level context. |
| Industry Association B | USD 17.83 B (2024) | Often stays closer to reported operator service lines and may exclude newer revenue pockets like IoT and M2M, and it can understate pricing uplift when promotions and plan migrations are not modeled in detail. |
The table shows that scope and base year choice explain most of the spread, and then the handling of newer service lines and pricing progression further widens it. By keeping inclusions explicit, tying drivers to subscribers and ARPU signals, and re-checking outliers through primary feedback, the estimate remains traceable and repeatable from update to update.


Key Questions Answered in the Report
How large is the Mexico telecom MNO market in 2026?
The market is valued at USD 19.22 billion, advancing at a 3.46% CAGR toward 2031.
Which service category is expanding fastest in Mexican mobile?
IoT and M2M Services lead with a projected 4.57% CAGR through 2031, outpacing other segments.
What share of revenue comes from consumer subscribers?
Consumers account for 77.52% of 2025 revenue, driven by more than 84 million wireless lines.
Why are spectrum fees seen as a restraint?
Prices are roughly 60% above global norms, limiting operator participation in auctions and slowing 5G coverage.
How does Red Compartida influence competition?
The wholesale network lowers rural capex and supports over 100 MVNOs that offer low-priced plans, intensifying competitive pressure.
What regions benefit most from nearshoring-driven IoT demand?
Nuevo León, Querétaro, and Guanajuato see the strongest enterprise IoT growth due to automotive and electronics manufacturing clusters.
Page last updated on:


 Your data is secure and never sold or shared.


