Immersive Entertainment Market Size and Share
Market Overview
| Study Period | 2020 - 2031 |
|---|---|
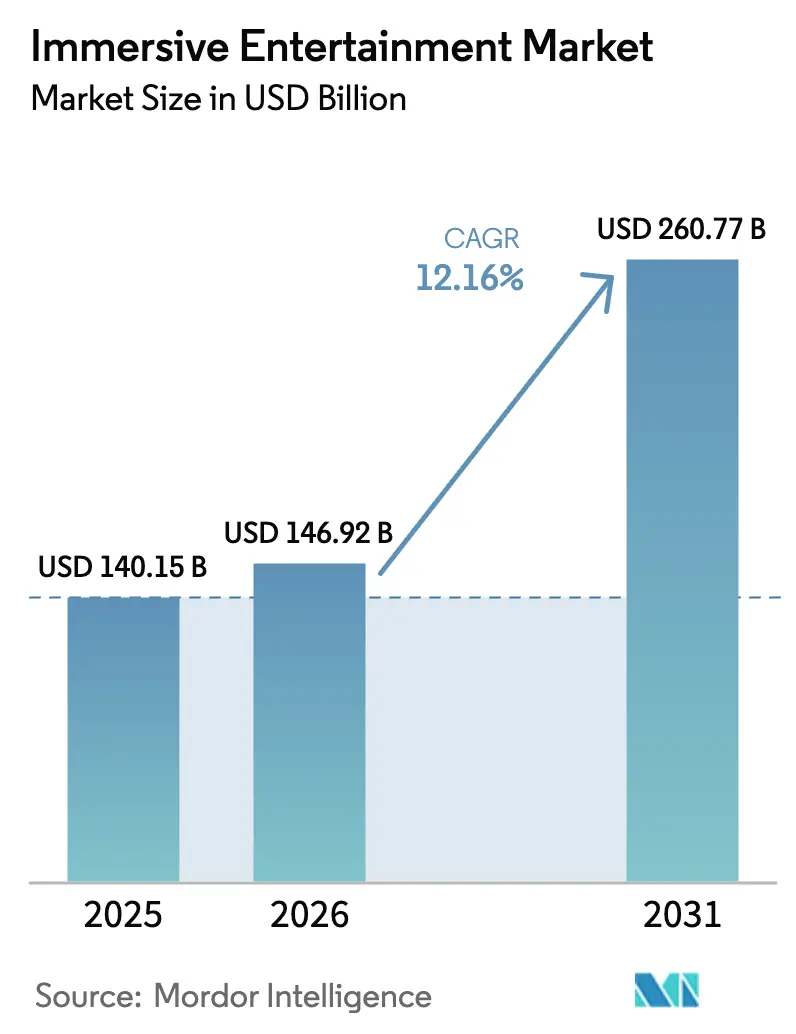
| Market Size (2026) | USD 146.92 Billion |
| Market Size (2031) | USD 260.77 Billion |
| Growth Rate (2026 - 2031) | 12.16% CAGR |
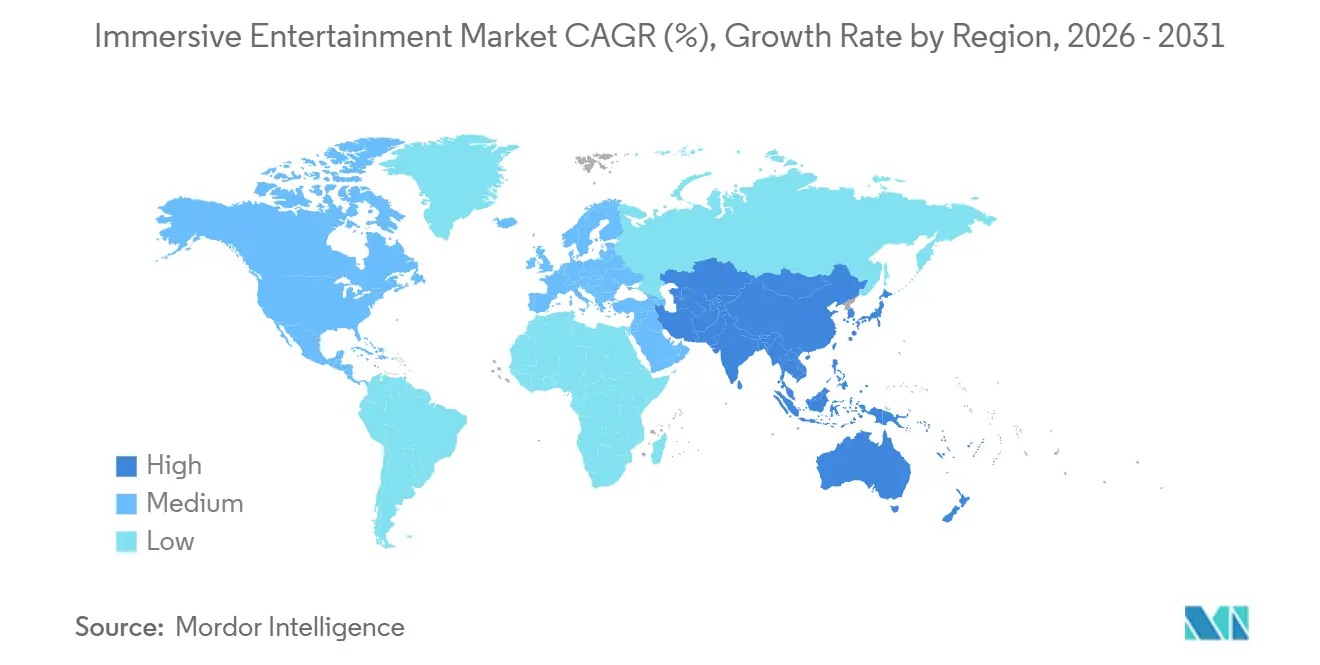
| Fastest Growing Market | Asia Pacific |
| Largest Market | North America |
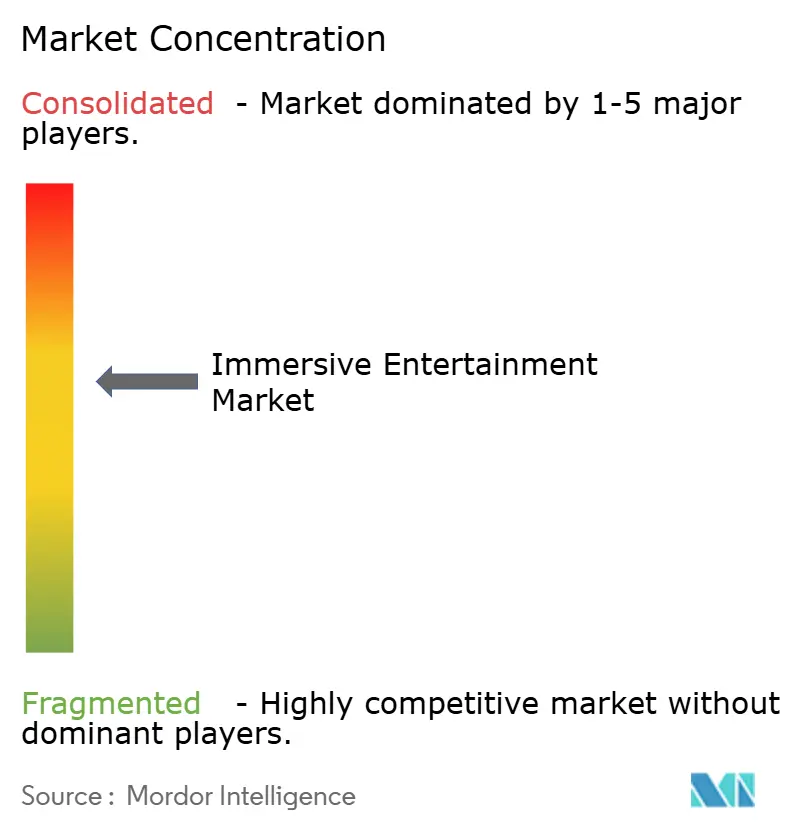
| Market Concentration | Medium |
Major Players *Disclaimer: Major Players sorted in no particular order Image © Mordor Intelligence. Reuse requires attribution under CC BY 4.0. | |
Immersive Entertainment Market Analysis by Mordor Intelligence
The immersive entertainment market size is expected to increase from USD 140.15 billion in 2025 to USD 146.92 billion in 2026 and reach USD 260.77 billion by 2031, growing at a CAGR of 12.16% over 2026-2031. Pent-up demand for shared, out-of-home experiences, multi-billion-dollar venue reinvestment, and AI-driven pricing engines are raising average guest spend while smoothing revenue volatility. Capital flows are accelerating, with experiential real-estate investment trusts underwriting venue build-outs and reducing operators’ cost of capital. Concurrently, 5G-enabled mixed-reality overlays and affordable haptic hardware are refreshing aging attractions at far lower cost than ground-up construction. These shifts allow operators to capture larger consumer-wallet share even as traditional theme-park attendance plateaus in mature regions.
Key Report Takeaways
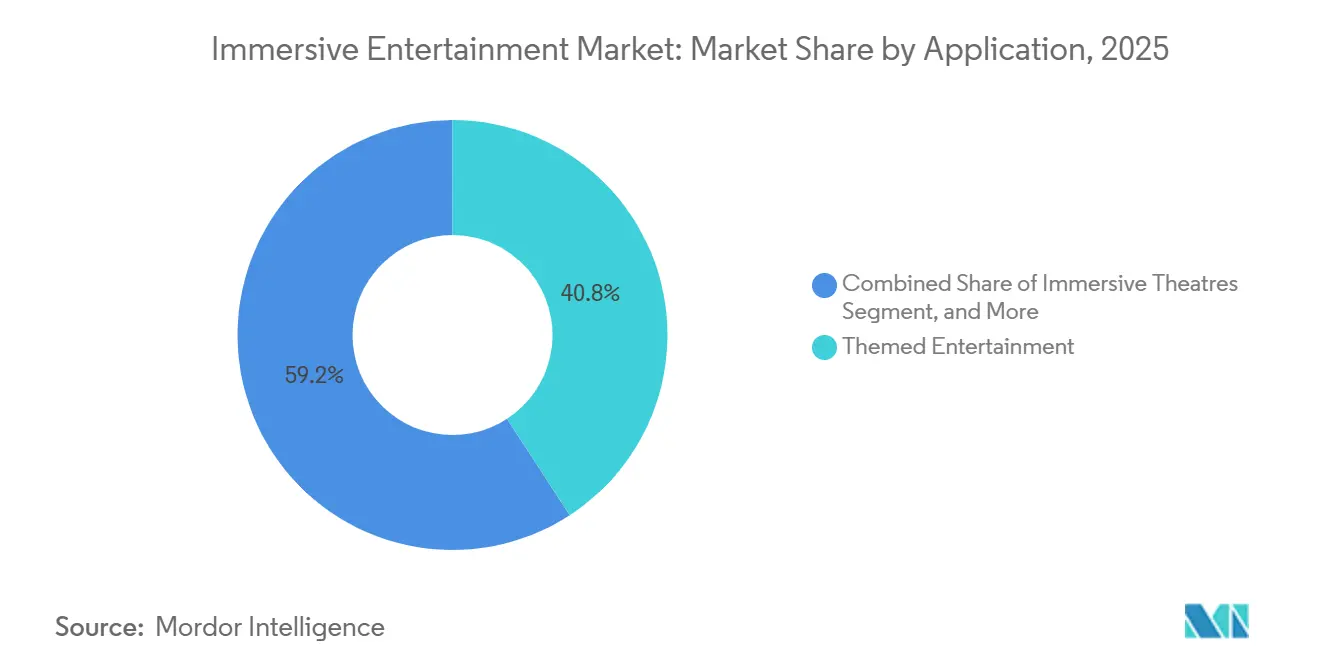
- By application, themed entertainment led with 40.83% revenue share in 2025, while live immersive gaming events are projected to expand at 12.20% CAGR to 2031.
- By technology, virtual reality commanded 31.73% of spend in 2025; haptics and multisensory technology are the fastest-growing at 12.23% CAGR through 2031.
- By venue type, theme and amusement parks held 37.91% of revenue in 2025, whereas pop-up and temporary installations are forecast to advance at 12.28% CAGR to 2031.
- By revenue stream, ticket sales represented 51.62% of turnover in 2025; sponsorship and brand partnerships are expected to rise at 12.34% CAGR during 2026-2031.
- By geography, North America accounted for 44.52% of revenue in 2025, yet Asia-Pacific is poised for the swiftest growth at 12.39% CAGR to 2031.
Note: Market size and forecast figures in this report are generated using Mordor Intelligence’s proprietary estimation framework, updated with the latest available data and insights as of January 2026.
Global Immersive Entertainment Market Trends and Insights
Drivers Impact Analysis*
| Driver | (~) % Impact on CAGR Forecast | Geographic Relevance | Impact Timeline |
|---|---|---|---|
| Explosive Theme-Park CAPEX Pipelines | +2.8% | Global, focus in North America, Middle East, China | Medium term (2-4 years) |
| Post-COVID “Experience over Things” Shift | +2.3% | Global, strongest in North America and Europe | Short term (≤ 2 years) |
| Fast-Maturing Location-Based VR Models | +1.9% | North America and Asia-Pacific urban centers | Medium term (2-4 years) |
| 5G and Edge for Real-Time Multi-User AR | +1.7% | Asia-Pacific and North America | Long term (≥ 4 years) |
| Experiential Real-Estate REIT Financing | +1.5% | North America and Europe | Long term (≥ 4 years) |
| AI-Driven Dynamic Ticket Pricing | +1.4% | Global, early adoption in North America | Short term (≤ 2 years) |
| Source: Mordor Intelligence | |||
Explosive Theme-Park CAPEX Pipelines Drive Market Expansion
Operators are pouring record sums into new lands, ride systems, and hospitality assets to defend pricing power and lengthen guest stays. The Walt Disney Company earmarked USD 60 billion for parks and experiences through 2034, eclipsing its streaming budget. Universal is debuting the USD 5 billion Epic Universe resort in Orlando in May 2025, adding 750 acres and several proprietary IP zones. Merged Six Flags-Cedar Fair now manages 42 parks, unlocking procurement synergies and cross-park season-pass reciprocity. High CAPEX creates a moat because smaller rivals lack the balance-sheet strength to match multi-sensory fidelity, enabling tier-one operators to justify 40-60% ticket premiums.
Post-COVID “Experience over Things” Consumer Shift
Global household budget allocations continue to tilt toward live experiences over material goods, with Gen Z and millennials prioritizing social-media-worthy outings. Operators design attractions around shareable moments-such as Meow Wolf’s kaleidoscopic rooms-cutting customer-acquisition costs by an estimated 30-40% versus paid digital advertising. Social commerce further amplifies reach; user-generated content from teamLab’s Tokyo exhibitions accounts for roughly half of annual ticket sales. Consequently, even discretionary spending slowdowns have had a muted impact on visit frequency.
Fast-Maturing Location-Based VR Business Models
A new cohort of VR arcade chains has reached unit economics breakeven by optimizing session length, group sizes, and content-refresh cadence. Sandbox VR, fresh from a USD 37 million Series B round, reports 65% repeat-visit rates within 90 days thanks to quarterly game rotations. Upsells such as premium avatars and souvenir video packages lift average transaction values to USD 70-85. Co-location with family entertainment centers is trimming overhead, improving four-wall margins by 20-25%.
5G and Edge Computing Enable Real-Time Multi-User AR Overlays
Sub-20-millisecond latency from 5G and edge compute lets hundreds of guests share synchronous AR experiences. Qualcomm’s Snapdragon Spaces, piloted in Asian parks in 2025, demonstrated real-time treasure hunts that overlay digital assets onto physical environments.[1]Qualcomm, “Qualcomm Announces Snapdragon Spaces AR Platform for Theme Parks,” qualcomm.com A Halloween overlay costs USD 50,000-100,000 to develop versus USD 2-5 million for temporary physical sets, compressing content amortization from 5 years to 1 year.
Restraints Impact Analysis*
| Restraint | (~) % Impact on CAGR Forecast | Geographic Relevance | Impact Timeline |
|---|---|---|---|
| Rising Insurance and Safety-Compliance Costs | -1.2% | Global, acute in North America and Europe | Short term (≤ 2 years) |
| Content-Licensing Fatigue | -0.9% | Global, concentrated in North America | Medium term (2-4 years) |
| High Staff Turnover in Live Attractions | -0.7% | Global, most severe in North America | Short term (≤ 2 years) |
| Local-Community Backlash over “Immersive Fatigue” | -0.5% | Urban centers in North America and Europe | Long term (≥ 4 years) |
| Source: Mordor Intelligence | |||
Rising Insurance and Safety-Compliance Costs
Premiums for interactive attractions jumped 15-20% in 2024-2025 after a spate of incidents prompted tighter underwriting. Deductibles for VR venues climbed to USD 50,000-75,000, while adherence to ASTM F24 and ISO 17025 standards adds up to USD 250,000 annually in inspection and remediation costs. Smaller operators face disproportionate burden, as fixed compliance expenses consume 8-12% of revenue versus 2-3% for large chains with dedicated safety teams. The strategic response: operators are consolidating or exiting, ceding market share to well-capitalized players who can absorb regulatory overhead.
Content-Licensing Fatigue among IP Right-Holders
Studios now demand royalty rates above 12% of gross attraction revenue plus stiff minimum guarantees. Harry Potter themed lands reportedly carry a USD 50 million annual minimum.[2]Financial Times, “Warner Bros Discovery Licensing Terms for Theme Parks,” ft.com The constraint, licensing costs are rising faster than ticket-price elasticity allows operators to pass through, compressing margins by 200-300 basis points. Operators are responding by developing proprietary IP (e.g., Meow Wolf's original narratives) or partnering with emerging franchises willing to accept lower upfront fees in exchange for exposure.
*Our forecasts treat driver/restraint impacts as directional, not additive. The impact forecasts reflect baseline growth, mix effects, and variable interactions.
Segment Analysis
By Application: Themed Entertainment Dominates while Gaming Events Accelerate
Themed entertainment captured 40.83% of 2025 application revenue, reflecting decades of installed ride capacity and multi-generational brand loyalty. Live immersive gaming events, however, are projected to log the fastest 12.20% CAGR as esports arenas integrate VR battle zones that monetize both competitors and spectators, extending the immersive entertainment market size for event-focused venues. Haunted attractions and escape rooms remain attractive for investors because a single site can open for USD 0.2-0.5 million yet deliver paybacks within two peak seasons.
Repeat visitation is becoming a key metric. VR esports lounges piloted by Dave and Buster’s delivered 35% longer dwell times and USD 18-22 incremental food-and-beverage spend per visit. Immersive theaters such as Punchdrunk’s Sleep No More command premium price points but scale slowly because each production requires bespoke casts and venues. Experiential art museums, led by teamLab, generate high margins once installations are amortized, proving that aesthetic novelty can rival narrative IP in expanding the immersive entertainment market.


By Technology: VR Still Leads, Haptics to Gain Share
Virtual reality accounted for 31.73% of 2025 technology spend, boosted by sub-USD 500 headsets and evergreen content libraries. Haptics and multisensory rigs are forecast to rise at 12.23% CAGR, leveraging motion seats, tactile vests, and scent cannons to justify premium ticket tiers and defend the immersive entertainment market share of premium experiences. Augmented reality adoption lags due to battery life and device fragmentation, yet mixed-reality hybrids such as Mario Kart: Bowser’s Challenge prove that practical sets fused with AR can sustain hour-plus queue times.
Disney’s Guardians of the Galaxy, Cosmic Rewind integrates programmable motion seats delivering 12 degrees of freedom, commanding USD 20-30 upcharges for enhanced rides.[3]The Walt Disney Company, “Guardians of the Galaxy: Cosmic Rewind Enhancements,” thewaltdisneycompany.com Suppliers including D-BOX Technologies report 40-50% order growth from operators combating at-home VR commoditization. Such upgrades solidify “you-must-be-there” differentiation and expand the immersive entertainment market size for haptic-rich attractions.
By Venue Type: Parks Anchor Revenue, Pop-Ups Surge
Theme and amusement parks generated 37.91% of venue revenue in 2025, with Disney, Universal, and Six Flags-Cedar Fair leveraging destination clusters to maximize per-trip guest spend. Pop-up and temporary installations, however, are primed for a 12.28% CAGR by exploiting vacant retail space and avoiding permanent-facility overhead, thereby gaining future market share in the immersive entertainment market in urban environments.
Illuminarium’s traveling projection domes, for example, can relocate after 18-24 months, allowing operators to chase fresh demand without incurring stranded assets. Family entertainment centers that bolt on VR arenas are capturing suburban audiences seeking all-weather outings, while stand-alone art experiences such as Meow Wolf achieve 70-80% gross margins once capital is amortized. The elasticity of the format portfolio keeps the immersive entertainment market resilient across economic cycles.

By Revenue Stream: Tickets Still Drive Cash Flow, Sponsorships Accelerate
Ticket sales contributed 51.62% of 2025 revenue, underscoring admission’s anchor role in the immersive entertainment market. Nonetheless, sponsorship and brand partnerships are poised for a 12.34% CAGR as consumer-goods companies integrate storylines into attractions to skirt ad-blocker fatigue. Food and beverage already yields 65-75% margins at parks that employ mobile ordering to shrink wait times and nudge upsells.
Coca-Cola’s renewed exclusivity at Disney World reportedly delivers USD 30-40 million in annual value to the operator. Merchandise spend remains tightly correlated with blockbuster IP launches, and season-pass subscriptions are converting price-sensitive locals into predictable revenue streams. Layering these channels expands the market for immersive entertainment without materially increasing fixed costs.
Geography Analysis
North America retained 44.52% of 2025 global revenue, anchored by Florida’s and California’s dense theme-park ecosystems that pulled roughly 90 million visits last year. High disposable income supports an average daily per-capita spend of USD 100-plus, while AI-driven pricing platforms such as Disney’s Genie+ lifted per-guest revenue by USD 8-12. Market saturation is prompting operators to invest in premium add-ons rather than raw capacity, sustaining the immersive entertainment market despite plateauing attendance.
Asia-Pacific is the fastest-growing region, with a projected 12.39% CAGR, propelled by China’s cultural tourism mandates and Japan’s leadership in projection-mapping artistry. Saudi Arabia’s USD 8 billion Qiddiya complex exemplifies how Gulf giga-projects are importing best-in-class operators to leapfrog regional competition. Southeast Asia’s middle class is crossing discretionary-income thresholds that historically trigger accelerated adoption in the immersive entertainment market.
Europe accounted for roughly one-quarter of revenue in 2025 but is constrained by shorter operating seasons and lower per-visitor spend. Yet the continent is home to artistic projection venues such as Atelier des Lumières, illustrating that cultural heritage fused with digital art can sustain demand outside peak summer months. The Middle East and Africa segment, while small, benefits from sovereign funding backing large-scale integrated resorts, progressively lifting the immersive entertainment market share of the region.
Mordor Intelligence provides coverage of the immersive entertainment market across other key regional markets, including Latin America, Asia, Europe, and North America, each with their regulatory frameworks and demand patterns.

Competitive Landscape
The sector shows a barbell structure, Disney, Universal (Comcast), and Merlin Entertainments jointly hold an estimated one-half of global revenue, conferring economies of scale in IP licensing and ride engineering. Mid-tier innovators like Meow Wolf and teamLab carve niches through original story worlds that amplify virally on social media, proving that organic buzz can offset the absence of legacy franchises. At the long-tail end, thousands of independent VR arcades and escape rooms compete locally, keeping overall market fragmentation high.
Strategic imperatives increasingly revolve around proprietary technology. Disney filed a dozen patents in 2024-2025 covering AR wayfinding and queue-management algorithms, and Universal submitted patents on motion-based synchronization and ride haptics. Capital-light models are also surfacing: experiential REITs such as EPR Properties acquire real estate and triple-net-lease it back to operators, freeing operator cash for content.
Mergers and venture financing are reshaping competitive boundaries. Six Flags-Cedar Fair’s consolidation formed a USD 8 billion North American giant, while Sandbox VR’s fundraising supports a pipeline of 25 new locations, mainly across Asia-Pacific and Europe. The immersive entertainment market therefore combines legacy scale advantages with fertile openings for agile disruptors that exploit white-space formats.
Immersive Entertainment Industry Leaders
The Walt Disney Company
Universal Parks and Resorts
Merlin Entertainments Limited
Meow Wolf, LLC
Six Flags Entertainment Corp.
- *Disclaimer: Major Players sorted in no particular order

Recent Industry Developments
- January 2026: The Walt Disney Company announced a USD 2.5 billion expansion of Tokyo DisneySea, adding a Fantasy Springs themed area featuring Frozen, Tangled, and Peter Pan attractions.
- January 2026: Universal Parks and Resorts finalized a USD 1.8 billion investment in Universal Studios Beijing, adding a Jurassic World-themed expansion and nighttime spectacular.
- December 2025: Merlin Entertainments opened Legoland Shenzhen Resort in China, a USD 850 million investment spanning 580,000 square meters.
- November 2025: SeaWorld Entertainment Corporation launched a USD 300 million transformation of SeaWorld San Diego, replacing legacy animal shows with immersive ocean-exploration attractions featuring AR headsets and underwater projection mapping.


Global Immersive Entertainment Market Report Scope
The Immersive Entertainment Market refers to the industry focused on creating engaging, interactive experiences for consumers through advanced technologies such as Virtual Reality (VR), Augmented Reality (AR), Mixed Reality (MR), 3D Audio, and Haptics. These experiences are designed to immerse participants in themed environments, live events, exhibitions, and other entertainment venues. The market caters to a range of applications, including themed entertainment, haunted attractions, escape rooms, immersive theaters, experiential art museums, exhibitions, retail installations, and live immersive gaming events.
The Immersive Entertainment Market Report is Segmented by Application (Themed Entertainment, Haunted Attractions and Escape Rooms, Immersive Theatres, Experiential Art Museums, Exhibitions and Retail Installations, and Live Immersive Gaming Events), Technology (VR, AR, 3D Audio, MR, and Haptics), Venue Type (Theme Parks, FECs, Museums, Stand-Alone Venues, and Pop-Ups), Revenue Stream (Tickets, Food and Beverage, Merchandise, Sponsorships, IP Licensing, and Subscriptions), and Geography (North America, South America, Europe, Asia-Pacific, Middle East, and Africa). The Market Forecasts are Provided in Value (USD).
| Themed Entertainment |
| Haunted Attractions and Escape Rooms |
| Immersive Theatres |
| Experiential Art Museums |
| Exhibitions and Retail Installations |
| Live Immersive Gaming Events |
| Virtual Reality (VR) |
| Augmented Reality (AR) |
| 3D Audio and Spatial Sound |
| Mixed Reality (MR) |
| Haptics and Multisensory Tech |
| Theme and Amusement Parks |
| Family/Indoor Entertainment Centers |
| Museums and Galleries |
| Stand-Alone Immersive Venues |
| Pop-Up and Temporary Installations |
| Ticket Sales |
| Food and Beverage |
| Merchandise |
| Sponsorship and Brand Partnerships |
| IP Licensing and Royalties |
| Subscription and Memberships |
| North America | United States |
| Canada | |
| Mexico | |
| South America | Brazil |
| Argentina | |
| Rest of South America | |
| Europe | Germany |
| United Kingdom | |
| France | |
| Italy | |
| Spain | |
| Rest of Europe | |
| Asia-Pacific | China |
| Japan | |
| India | |
| South Korea | |
| ASEAN | |
| Rest of Asia-Pacific | |
| Middle East | Saudi Arabia |
| United Arab Emirates | |
| Rest of Middle East | |
| Africa | South Africa |
| Nigeria | |
| Egypt | |
| Rest of Africa |
| By Application | Themed Entertainment | |
| Haunted Attractions and Escape Rooms | ||
| Immersive Theatres | ||
| Experiential Art Museums | ||
| Exhibitions and Retail Installations | ||
| Live Immersive Gaming Events | ||
| By Technology | Virtual Reality (VR) | |
| Augmented Reality (AR) | ||
| 3D Audio and Spatial Sound | ||
| Mixed Reality (MR) | ||
| Haptics and Multisensory Tech | ||
| By Venue Type | Theme and Amusement Parks | |
| Family/Indoor Entertainment Centers | ||
| Museums and Galleries | ||
| Stand-Alone Immersive Venues | ||
| Pop-Up and Temporary Installations | ||
| By Revenue Stream | Ticket Sales | |
| Food and Beverage | ||
| Merchandise | ||
| Sponsorship and Brand Partnerships | ||
| IP Licensing and Royalties | ||
| Subscription and Memberships | ||
| By Geography | North America | United States |
| Canada | ||
| Mexico | ||
| South America | Brazil | |
| Argentina | ||
| Rest of South America | ||
| Europe | Germany | |
| United Kingdom | ||
| France | ||
| Italy | ||
| Spain | ||
| Rest of Europe | ||
| Asia-Pacific | China | |
| Japan | ||
| India | ||
| South Korea | ||
| ASEAN | ||
| Rest of Asia-Pacific | ||
| Middle East | Saudi Arabia | |
| United Arab Emirates | ||
| Rest of Middle East | ||
| Africa | South Africa | |
| Nigeria | ||
| Egypt | ||
| Rest of Africa | ||


Key Questions Answered in the Report
How large will global spending on immersive entertainment reach by 2031?
The immersive entertainment market is projected to hit USD 260.77 billion by 2031, reflecting a 12.16% CAGR over 2026-2031
Which technology is expanding the fastest in location-based attractions?
Haptics and broader multisensory systems are forecast to grow at 12.23% CAGR as operators add motion seats, tactile vests, and scent effects to justify premium tiers.
Why are live immersive gaming events important to venue operators?
They combine tournament fees, spectator admission, and sponsorships, driving a 12.20% CAGR and higher food-and-beverage spend compared with traditional arcade formats.
What region will contribute most to future growth?
Asia-Pacific is expected to record the fastest regional expansion at 12.39% CAGR through 2031, driven by China’s cultural-tourism agenda and Gulf giga-projects.
How are operators mitigating rising insurance costs?
Larger chains leverage dedicated safety teams, bulk-buy coverage, and technology-driven incident tracking to dilute per-venue compliance expenses that hamper smaller rivals.
What new financing models are emerging for venue build-outs?
Experiential real-estate REITs are purchasing properties and leasing them back to operators, trimming weighted-average cost of capital by 150-200 basis points.
Page last updated on:


