Gaming Headsets Market Size and Share
Market Overview
| Study Period | 2020 - 2031 |
|---|---|
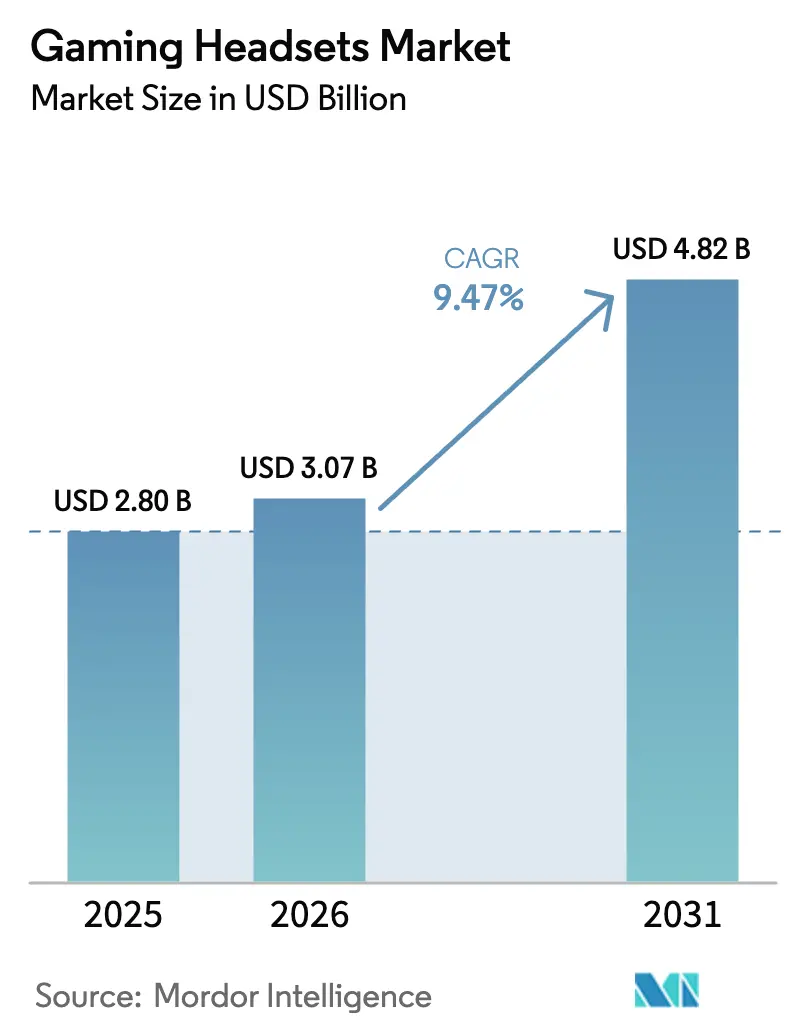
| Market Size (2026) | USD 3.07 Billion |
| Market Size (2031) | USD 4.82 Billion |
| Growth Rate (2026 - 2031) | 9.47% CAGR |
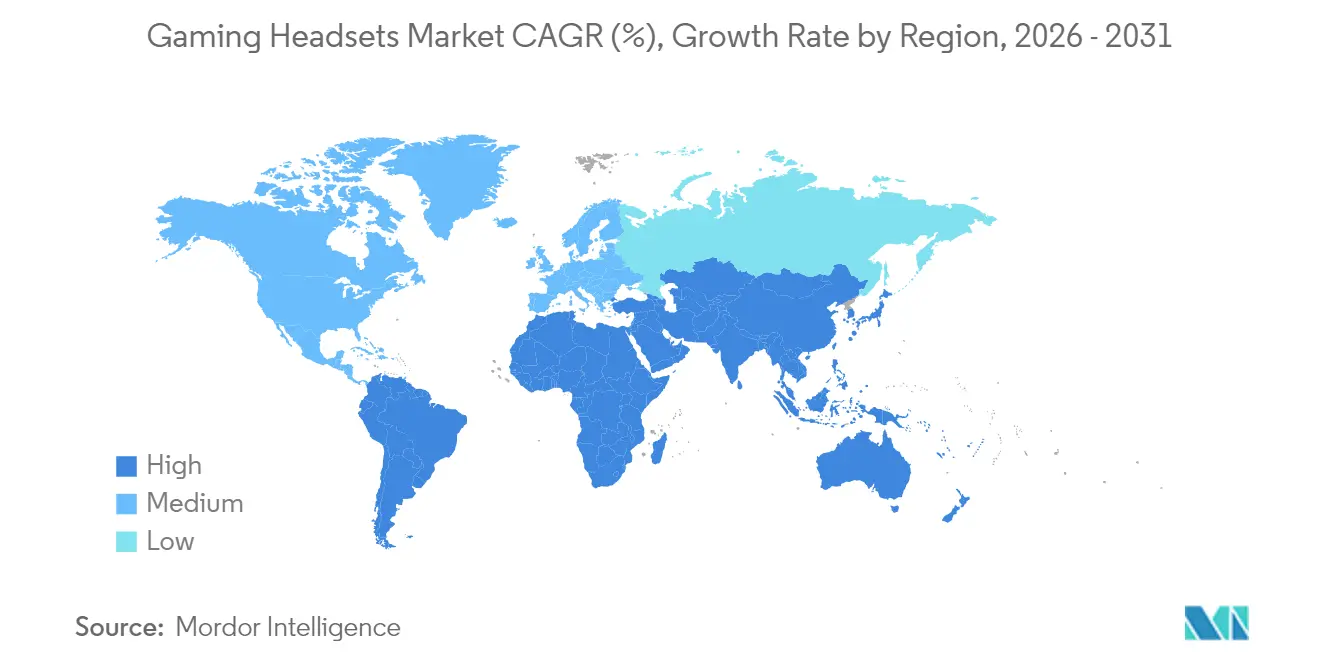
| Fastest Growing Market | Asia Pacific |
| Largest Market | Europe |
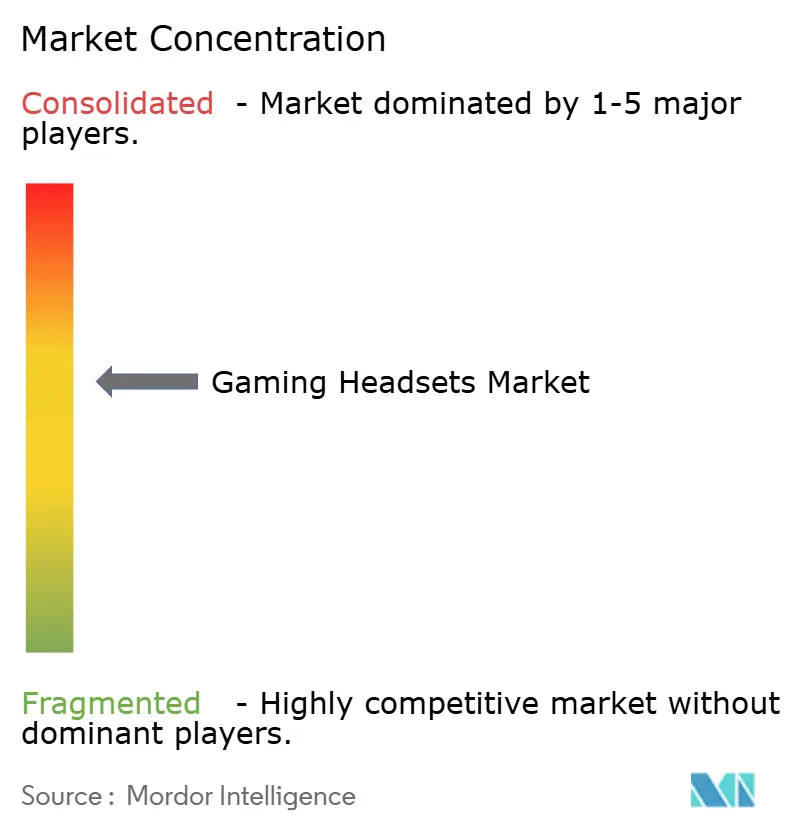
| Market Concentration | Medium |
Major Players
*Disclaimer: Major Players sorted in no particular order Image © Mordor Intelligence. Reuse requires attribution under CC BY 4.0. |
|
Gaming Headsets Market Analysis by Mordor Intelligence
Gaming headsets market size in 2026 is estimated at USD 3.07 billion, growing from 2025 value of USD 2.8 billion with 2031 projections showing USD 4.82 billion, growing at 9.47% CAGR over 2026-2031. Continued demand for immersive audio, the convergence of console, PC and mobile play, and the mainstreaming of VR experiences are turning headsets from optional accessories into everyday communication tools.[1]Tom’s Guide, “The Best VR Headsets in 2025,” tomsguide.com Europe currently leads in revenue, yet Asia-Pacific is accelerating fastest as cloud gaming, 5G roll-outs and rising disposable incomes boost hardware uptake. Segment data shows that wired designs still dominate shipments, but steady advances in low-latency chipsets are steering consumers toward wireless alternatives. Retail stores remain the primary distribution route, though direct-to-consumer online strategies are rapidly reshaping how brands reach players and streamers.
Key Report Takeaways
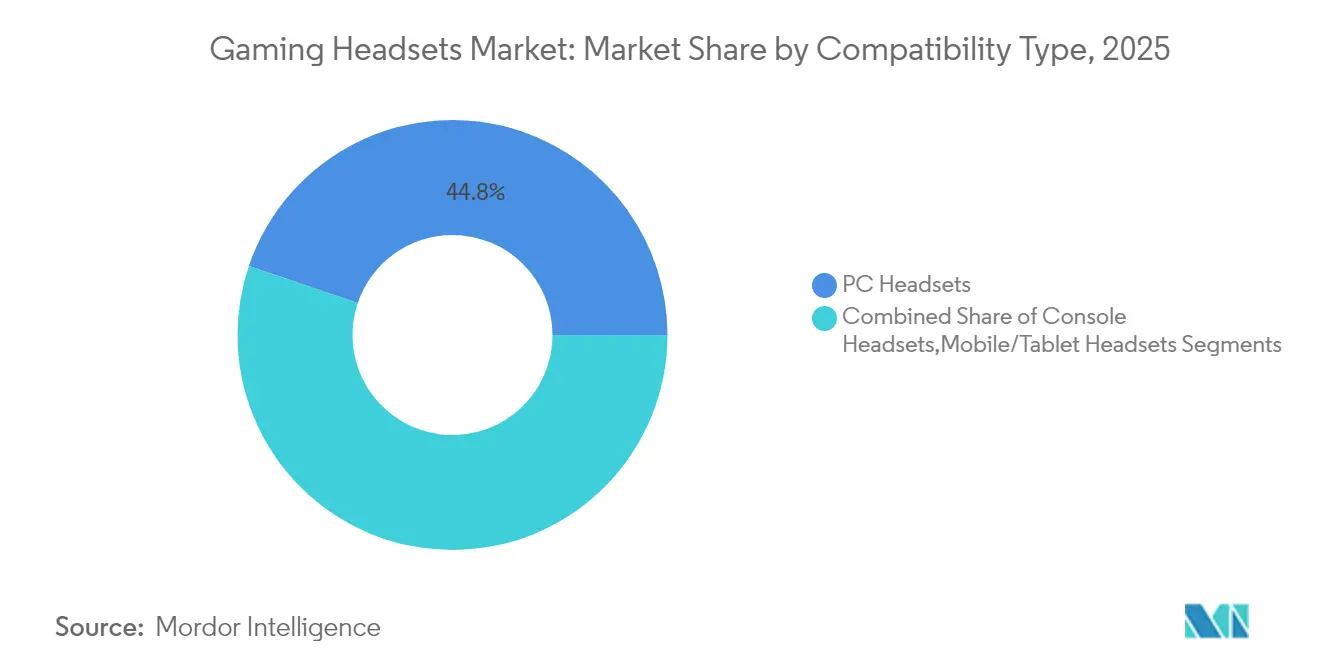
- By compatibility type, PC headsets captured 44.80% of gaming headsets market share in 2025, while mobile/tablet models are poised for the highest 11.72% CAGR through 2031.
- By connectivity, wired solutions held 61.20% of the gaming headsets market size in 2025, yet wireless models are expanding at a 12.56% CAGR.
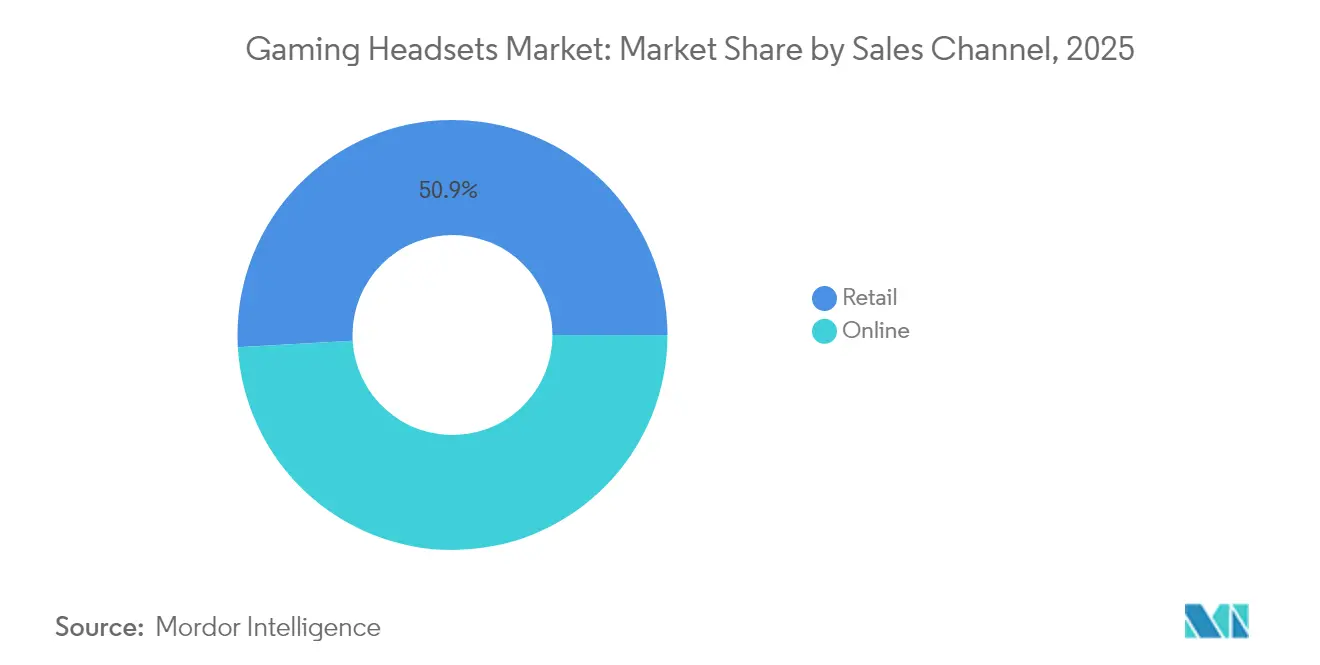
- By sales channel, retail outlets accounted for a 50.90% slice of the gaming headsets market size in 2025; online platforms represent the fastest-growing route at a 13.22% CAGR.
- By price band, entry-level units under USD 50 commanded 42.60% of market revenue in 2025, whereas premium sets priced USD 100-199 are advancing at a 14.29% CAGR.
- By geography, Europe led with 27.20% revenue share in 2025, but Asia-Pacific is projected to grow 10.74% annually to 2031.
Note: Market size and forecast figures in this report are generated using Mordor Intelligence’s proprietary estimation framework, updated with the latest available data and insights as of 2026.
Global Gaming Headsets Market Trends and Insights
Drivers Impact Analysis*
| Driver | (~ ) % Impact on CAGR Forecast | Geographic Relevance | Impact Timeline |
|---|---|---|---|
| Rising popularity of VR gaming | +1.8% | Global – strongest in North America and Asia-Pacific | Medium term (2-4 years) |
| Booming global e-sports viewership and prizes | +2.1% | Global – strongest in Asia-Pacific and Europe | Short term (≤ 2 years) |
| Rapid uptake of low-latency wireless chips | +1.5% | Global – led by North America and Europe | Medium term (2-4 years) |
| Cross-platform compatibility demand | +2.3% | Global | Short term (≤ 2 years) |
| Surge in cloud and mobile gaming | +1.9% | Asia-Pacific core, global spill-over | Medium term (2-4 years) |
| Growth of streaming culture and ASMR | +0.8% | North America and Europe, expanding to Asia-Pacific | Long term (≥ 4 years) |
| Source: Mordor Intelligence | |||
Rising Popularity of VR Gaming
VR titles now headline major release calendars, and their need for spatial audio has expanded the gaming headsets market far beyond traditional stereo devices. The Meta Quest 3 success story in 2024 highlighted consumers’ readiness for combined audio-haptic experiences, prompting legacy brands to redesign products with integrated 3D processors and motion tracking.[2]Bluetooth SIG, “High Data Throughput: The Next Leap for Wireless Audio,” audioxpress.com These specifications, once niche, are quickly migrating into mainstream wireless SKUs where cabling would disrupt room-scale movement. As VR arcades gain traction in malls across Seoul, London and Los Angeles, demand grows for headsets that deliver accurate positional cues even at low bitrates to preserve battery life. The resulting R&D race among suppliers accelerates chip innovation that will eventually filter down to non-VR models as well.
Booming Global E-sports Viewership and Prize Pools
Prize purses topping USD 10 million for flagship mobile and PC tournaments have turned pro-grade headsets into aspirational gear for everyday players. Sponsorships such as Turtle Beach’s provision of Stealth 700 headsets for the 2025 Capcom Pro Tour translate tournament victories into retail sell-through, especially in Asia-Pacific where café-based amateurs watch regional stars daily. Organizers require sealed earcups and tuned voice coils to block arena crowd noise, inspiring brands to add detachable boom mics and customizable EQ presets. As livestreams on Twitch and YouTube replay team comms for millions, the microphone is now a headline feature on spec sheets, driving premium model sales.
Rapid Adoption of Low-Latency Wireless Audio Chips
Next-generation silicon—exemplified by NXP’s NXH3670 achieving sub-20 ms lag—has removed the core objection to wireless play.[3]NXP Semiconductors N.V., “NXH3670 | Wireless Gaming Headphone | Bluetooth Low Energy Audio,” nxp.com Simultaneously, the Bluetooth SIG roadmap toward multichannel 8 Mbps rates eliminates bandwidth caps that once forced lossy compression. Platform holders are responding: every Xbox accessory unveiled in 2025 defaults to wireless, nudging the gaming headsets market toward cable-free norms. Brands building on these chips can advertise desktop-class performance in a travel-friendly form factor, widening appeal to hybrid workers who game after office hours.
Cross-Platform Compatibility Demand from Multi-Device Gamers
A single gamer now juggles Switch, PC, smartphone and cloud services, expecting the same headset to swap seamlessly among them. Logitech’s latest ASTRO A50 with PLAYSYNC AUTO exemplifies dual-radio designs that sync to a console while maintaining Bluetooth audio from a phone without manual pairing.[4]Logitech International S.A., “Logitech G Thrills the Global Gaming Community With Major Announcements and Exclusive Partnerships at Logi PLAY 2024,” ir.logitech.com Such all-in-one versatility has become the key purchase driver in North America and Europe and is quickly resonating across Korea and India. Manufacturers catering to cross-platform use see higher margins because buyers accept premium pricing for a product that consolidates accessories.
Restraints Impact Analysis*
| Restraint | (~) % Impact on CAGR Forecast | Geographic Relevance | Impact Timeline |
|---|---|---|---|
| Chip shortages and factory disruptions | -1.2% | Global, most acute in Asia-Pacific manufacturing hubs | Short term (≤ 2 years) |
| Budget-conscious buyers in fast-growing regions | -0.9% | APAC emerging economies, Latin America, Africa | Medium term (2-4 years) |
| Rising safety worries about long listening sessions | -0.8% | Global, strictest enforcement in Europe and North America | Long term (≥ 4 years) |
| Tighter electronic-waste rules raising compliance spend | -0.6% | Europe and North America, expanding gradually into Asia-Pacific | Medium term (2-4 years) |
| Source: Mordor Intelligence | |||
Semiconductor Supply-Chain Volatility
Recurring chip shortages linked to geopolitical friction and natural disasters have forced headset makers to redesign around whatever ICs remain on allocation, raising bill-of-material costs and squeezing gross margins. The disruption is most visible in wireless SKUs that rely on power-efficient SoCs; brands postpone launches or ship reduced features when specific codecs are unavailable. Short lead-time solutions such as dual-sourcing and safety inventory buffer larger companies but are costly for mid-size entrants, slowing overall wireless transition and trimming projected growth by 1.2 percentage points.
Health Concerns Over Prolonged Headphone Use and Hearing Loss
The February 2025 WHO-ITU standard mandates sound-exposure tracking and safe-listening prompts, capping permissible loudness at 100 dB. Complying requires extra sensors and firmware that inflate RandD spend and complicate certification. Competitive gamers often favor louder volumes, so brands must add dynamic range compression that preserves positional cues while respecting limits. Non-compliance risks legal action and sales bans in Europe and North America, motivating early adoption but temporarily delaying rollouts and trimming market expansion by 0.8 percentage points.
*Our forecasts treat driver/restraint impacts as directional, not additive. The impact forecasts reflect baseline growth, mix effects, and variable interactions.
Segment Analysis
By Compatibility Type: Mobile Gaming Drives Platform Diversification
Mobile and tablet units post an 11.72% CAGR through 2031, reflecting the fastest uptake among all categories as cloud services bring AAA titles to phones. PC designs nonetheless hold 44.80% of gaming headsets market share in 2025, anchored by esports cafés and content creators who require high-output drivers. Console peripherals, buoyed by the late-2024 refresh cycle, remain stable but cede incremental share to device-agnostic models. The gaming headsets market size for mobile-centric designs is projected to add USD 804 million between 2026 and 2031 as handsets integrate better graphics processors.
Cross-compatibility has become non-negotiable, turning USB-C and dual-2.4 GHz / Bluetooth radios into baseline specs. Microsoft’s refreshed Xbox Wireless Headset illustrates how platform holders converge on universal profiles, helping mobile-first items gain traction even in mature PC regions. As 5G latency improvements reach mainstream cities, lobby waiting times fall and portable competitive play normalizes, reinforcing the premium paid for multi-device models.


By Connectivity Type: Wireless Revolution Accelerates Despite Wired Dominance
Wired SKUs still represented 61.20% of gaming headsets market size in 2025 owing to zero-latency assurance and attractive entry pricing. Yet wireless shipments will grow at a 12.56% CAGR, chipping away at that lead as codec efficiency and battery life leapfrog past legacy limitations. The latest Maxwell model’s 80-hour endurance eliminates mid-session charging fears, and sub-20 ms lag now registers below human reaction thresholds for casual play.
Streamers and VR users are leading adopters, valuing untethered movement to camera or headset rigs. As VR arcades progress, wireless penetration accelerates even faster in Asia-Pacific, where room dimensions in urban homes often mandate flexible setups. Over the forecast horizon, analysts expect the gaming headsets market share of wireless to overtake wired shortly after 2028, reshaping accessory merchandising plans at big-box retailers.
By Sales Channel: Digital Commerce Transforms Distribution Dynamics
Physical retailers controlled 50.90% of 2025 revenue, yet online marketplaces are racing ahead with a 13.22% CAGR. Direct-to-consumer websites by Turtle Beach, Logitech and Razer leverage influencer unboxings, bundled game codes and tailored firmware updates to deepen engagement and capture first-party data. Reviews, ratings and algorithmic recommendations on Amazon or regional platforms in India and Brazil allow niche SKUs to surface quickly, broadening choice for shoppers who once relied on limited shelf space.
Brick-and-mortar stores nonetheless defend relevance through try-before-buy listening stations and immediate availability for gift purchases. Hybrid models such as “click and collect” are rising, allowing shoppers to audition headsets in-store after ordering online. Brands optimizing both channels widen reach: they seed launches online for early adopters, then roll into retail once demand proofs reduce return risk.
By Price Band: Premium Segment Captures Value Migration
Entry-level units under USD 50 retained 42.60% revenue in 2025 as casual mobile players sought affordability. Yet premium products priced USD 100-199 clock the quickest 14.29% CAGR, spotlighting growing consumer readiness to invest in meaningful performance advantages. Gaming headsets market size for the premium tier is forecast to climb from roughly USD 785 million in 2025 to nearly USD 1.73 billion by 2031.
Driving that splurge are esports ambitions and streaming monetization: competition-grade drivers, leatherette memory-foam pads and hi-res certified microphones translate to measurable FPS or audience growth. The mid-range USD 50-99 band faces squeeze as discount brands upgrade acoustics while flagships become more affordable through seasonal promotions. Manufacturers offset cost-lier RandD by repurposing earlier-generation ANC or wireless modules into sub-USD 70 launches, keeping entry users engaged in their brand ecosystem.
Geography Analysis
Europe’s 27.20% stake in 2025 highlights its mature, premium-oriented customer base, but saturation and macro-economic pressures are tempering unit growth. Hardware refresh cyclicality, evident in the UK’s 1.8% market dip, affects attached peripherals as console sell-through moderates. Germany and France maintain robust PC gaming cultures that sustain demand for high-impedance drivers, while Nordic operators push wireless adoption by bundling headsets with fiber broadband plans. Environmental directives on recyclability and e-waste place added design constraints, inadvertently benefiting domestic OEMs familiar with EU compliance regimes.
Asia-Pacific is growing at 10.74% annually, powered by China, Japan and South Korea’s convergence of 5G coverage and booming mobile esports. The gaming headsets market size in the region is projected to eclipse Europe before the decade closes as portable play fuels both volume and ASP increases. Local OEMs capitalize on cost advantages to iterate rapidly, though global brands still command cachet in tournament circuits. Cultural norms of long commuting hours foster demand for lightweight, foldable designs; meanwhile, WHO safety guidelines resonate strongly with Japan’s aging gamer demographic, boosting sales of models with integrated exposure meters.
North America advances steadily on the back of technology leadership, high ARPU gamers and a burgeoning creator economy. Content creators on Twitch and YouTube prefer broadcast-quality mics, prompting iterative upgrades even when base audio hardware remains functional. Proposed tariffs on Chinese imports could lift retail pricing and encourage near-shoring; early signs of pilot runs in Mexico for final assembly are emerging. Canada’s generous tax incentives for game studios indirectly lift headset sales among developers who demand reference-grade monitoring. Overall, the region remains skewed toward premium price points, though entry-level wireless is gaining traction among scholastic esports clubs.
Mordor Intelligence provides coverage of the gaming headsets market across other key regional markets, including Europe, Middle East and Africa, Middle East and Africa, North America, and Latin America, each with their regulatory frameworks and demand patterns. Detailed country-level analysis extends to United Kingdom, Canada, China, India, and Japan incorporating local coverage and market participation, as required.

Competitive Landscape
The sector is moderately fragmented: the combined top five vendors hold an estimated 48% of 2024 revenue. Logitech, Razer and Corsair build lock-in through unified software suites that control EQ, RGB lighting and cross-device macros, making ecosystem exit costly for users. Turtle Beach, with 82 million lifetime headset shipments, leverages its console heritage and tournament sponsorships to stay top-of-mind among casual buyers. Sony’s new Inzone line shows how platform owners can diversify into PC accessories, potentially absorbing share via brand trust.
Wireless innovation is the principal battleground. Brands race to adopt BLE Audio, proprietary 2.4 GHz links and emerging Wi-Fi codecs to sustain a premium moat. Component shortages empower vertically integrated players that can secure custom ASIC supply ahead of rivals. Compliance with WHO-ITU standards is another differentiator: early movers highlight safe-listening dashboards and auto-volume caps as selling points to parents and school leagues. Smaller challengers focus on esports niches or culturally targeted SKUs—example: compact, anime-themed models in Japan—then expand regionally through influencer merchandising.
Partnership strategies remain dynamic. Hardware makers bundle introductory Game Pass or PlayStation Plus months to sweeten value, while telecom carriers in Korea and Scandinavia package headsets with 5G contracts. White-label OEM supply to supermarket chains sustains volume for price-sensitive markets, yet margins favor direct brand channels sharpened by data analytics. Over the forecast, winners will balance silicon control, software ecosystems and omnichannel reach.
Gaming Headsets Industry Leaders
-
Razer Inc.
-
Sony Interactive Entertainment
-
HyperX (HP Inc.)
-
Logitech International SA
-
Corsair Gaming Inc.
- *Disclaimer: Major Players sorted in no particular order

Recent Industry Developments
- May 2025: Turtle Beach launched 16 new cross-platform headsets and controllers, including officially licensed Nintendo Switch Recon 70 and Airlite Fit models.
- May 2025: Turtle Beach became the official headset partner for Capcom Pro Tour 2025, supplying Stealth 700 wireless units for tournament play.
- April 2025: JLab and MrBeast released a USD 29.99 wired gaming headset exclusive to Walmart, targeting budget-conscious buyers.
- February 2025: WHO and ITU published a global standard to prevent gaming-related hearing loss, mandating exposure tracking and safety modes.


Research Methodology Framework and Report Scope
Market Definitions and Key Coverage
Our study defines the gaming-headset market as all wired or wireless, over-ear or on-ear audio peripherals that include an integrated microphone and are promoted mainly for console, PC, or mobile gaming use. Revenue is captured at manufacturer selling price and validated with retail sell-out where available.
Scope exclusions include headsets optimized only for office telephony, music-only headphones without microphones, and mixed-reality head-mounted displays that are not counted.
Segmentation Overview
-
By Compatibility Type
- Console Headsets
- PC Headsets
- Mobile/Tablet Headsets
-
By Connectivity Type
- Wired
- Wireless
-
By Sales Channel
- Retail
- Online
-
By Price Band
- Entry/Budget (< USD 50)
- Mid-range (USD 50-99)
- Premium (USD 100-199)
- High-end/Esports (USD 200+)
-
By Geography
-
North America
- United States
- Canada
- Mexico
-
Europe
- United Kingdom
- Germany
- France
- Italy
- Rest of Europe
-
Asia-Pacific
- China
- Japan
- India
- South Korea
- Rest of Asia-Pacific
-
Middle East and Africa
-
Middle East
- Israel
- Saudi Arabia
- United Arab Emirates
- Turkey
- Rest of Middle East
-
Africa
- South Africa
- Egypt
- Nigeria
- Rest of Africa
-
Middle East
-
South America
- Brazil
- Argentina
- Rest of South America
-
North America
Detailed Research Methodology and Data Validation
Primary Research
Mordor analysts interviewed component suppliers, audio-chip vendors, e-sports team managers, specialty retailers, and regional distributors across North America, Europe, and Asia Pacific. These conversations clarified average selling prices, emerging features like spatial audio, return rates, and promotional calendars, which were used to fine-tune model coefficients and test elasticity assumptions.
Desk Research
We began by mapping installed-base and accessory-attach rates using open statistics from bodies such as the Entertainment Software Association, China Audio Industry Association, and Japan Computer Game Association, alongside import-export panels from UN Comtrade and U.S. Census electronics trade tables. Consumer spending data drawn from sources like the U.S. Consumer Technology Association, Eurostat household ICT surveys, and Statistica's publicly released e-sports snapshots helped size demand pockets across regions.
For company metrics, we pulled audited revenue lines and shipment commentary from annual reports filed to the SEC and European registries, which are indexed in Dow Jones Factiva and D&B Hoovers. Pricing corridors were cross-checked through web-scraped retailer catalogs and voluntary disclosures on leading e-commerce portals. The secondary-source list above is illustrative; many additional outlets were consulted to refine assumptions.
Market-Sizing & Forecasting
We applied a top-down device-penetration build that starts with active console, PC, and mobile gamer counts, layers average headset ownership per gamer cohort, and multiplies by weighted ASPs. Selective bottom-up supplier roll-ups and channel checks helped validate totals before final adjustment. Key variables tracked include annual console shipments, PC gaming GPU installs, e-sports tournament viewership growth, retail ASP drift by connectivity, exchange-rate movements, and seasonality spikes during holiday quarters. Forecasts through 2030 rely on multivariate regression blended with scenario analysis, where variable trajectories are stress-tested against the consensus view gathered from primary experts. Data gaps on niche geographies were bridged by regional proxy ratios derived from past adoption curves.
Data Validation & Update Cycle
Outputs pass three-layer checks: automated variance flags, analyst peer review, and senior sign-off. We re-open models whenever quarterly earnings, tariff shifts, or technology launches move inputs materially. Full refreshes occur annually, and every published copy is revalidated immediately before client delivery.
Why Our Gaming Headsets Baseline Stands Reliable
Published figures often diverge because firms mix in VR headsets, apply retailer margins inconsistently, or refresh models sporadically. By anchoring on gamer cohorts, current ASP ladders, and a yearly update cadence, Mordor Intelligence delivers a balanced view clients can replicate.
Benchmark comparison
| Market Size | Anonymized source | Primary gap driver |
|---|---|---|
| USD 2.80 B | Mordor Intelligence | - |
| USD 2.71 B | Regional Consultancy A | Excludes premium esports models and applies static ASP from 2023 |
| USD 3.63 B | Global Consultancy B | Bundles streaming headsets and applies optimistic 12% CAGR from a 2024 base |
These contrasts show that when definitions widen or price progression is overstated, totals swing sharply. Our disciplined variable selection and transparent refresh cycle therefore furnish decision-makers with the most dependable starting point.


Key Questions Answered in the Report
What is the current size of the gaming headsets market?
The gaming headsets market is worth USD 3.07 billion in 2026 and is projected to expand to USD 4.82 billion by 2031.
Which region is growing fastest for gaming headsets?
Asia-Pacific leads growth at a 10.74% CAGR through 2031, driven by mobile esports, 5G connectivity and rising disposable incomes.
Why are wireless gaming headsets gaining popularity?
Advances in low-latency chipsets and longer battery life now match wired performance, making wireless more convenient for VR, streaming and everyday play.
How will the new WHO hearing-safety standard affect headset design?
Manufacturers must add exposure tracking and volume-limiting features, raising R&D costs but giving early adopters a competitive edge with safety-focused consumers.
Which price segment is expanding quickest?
Premium models priced USD 100-199 are the fastest-growing, climbing at a 14.29% CAGR as gamers invest in higher fidelity and tournament-grade microphones.
Who are the leading companies in the gaming headsets market?
Logitech, Razer, Turtle Beach, Corsair and HyperX collectively hold almost half of global revenue, leveraging brand ecosystems and wireless innovations to stay ahead.
Page last updated on:


