
MEMS Microphones Market Size and Share
Market Overview
| Study Period | 2020 - 2031 |
|---|---|
| Market Size (2026) | USD 2.54 Billion |
| Market Size (2031) | USD 3.38 Billion |
| Growth Rate (2026 - 2031) | 5.88% CAGR |
| Fastest Growing Market | Middle East |
| Largest Market | Asia Pacific |
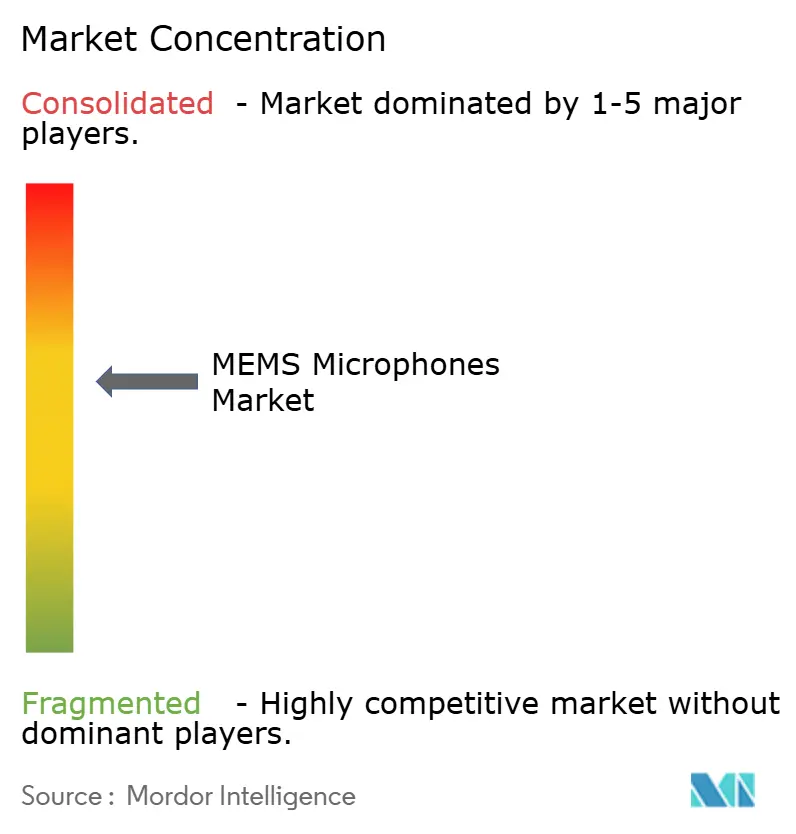
| Market Concentration | Medium |
Major Players
*Disclaimer: Major Players sorted in no particular order Image © Mordor Intelligence. Reuse requires attribution under CC BY 4.0. |
|
MEMS Microphones Market Analysis by Mordor Intelligence
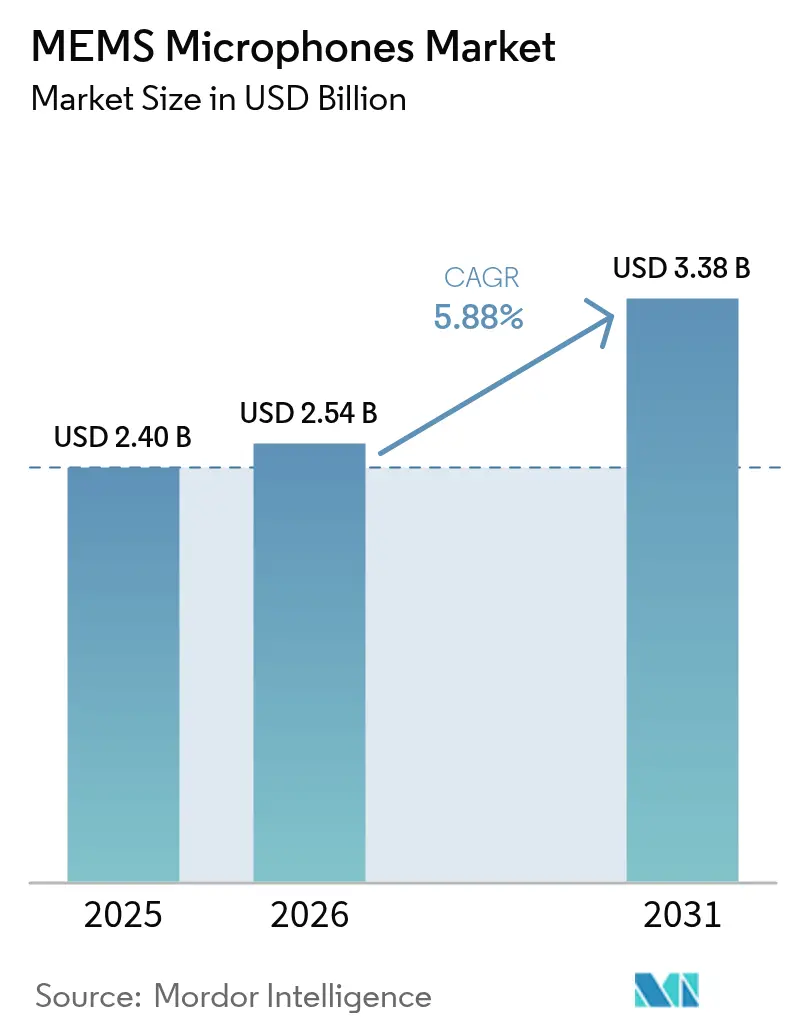
The MEMS microphone market size is expected to grow from USD 2.40 billion in 2025 to USD 2.54 billion in 2026 and is forecast to reach USD 3.38 billion by 2031 at 5.88% CAGR over 2026-2031. This expansion reflects the rising demand for high-fidelity audio capture in voice-enabled devices, vehicle cabins, and hearing aids, where traditional electret microphones no longer meet the needs for miniaturization and performance. Manufacturers accelerate innovations in high-signal-to-noise-ratio (SNR) designs, wafer-level packaging, and integrated digital signal processing to support features such as spatial audio, beamforming, and edge AI inference. Growth is further propelled by regulatory pushes for in-cabin driver monitoring, the rapid adoption of true wireless earbuds, and smart infrastructure deployments that rely on distributed acoustic sensing. Competitive strategies increasingly favor vertical integration, portfolio specialization, and strategic divestitures that sharpen focus on premium or application-specific niches while addressing pricing pressure in commoditized consumer segments.
Key Report Takeaways
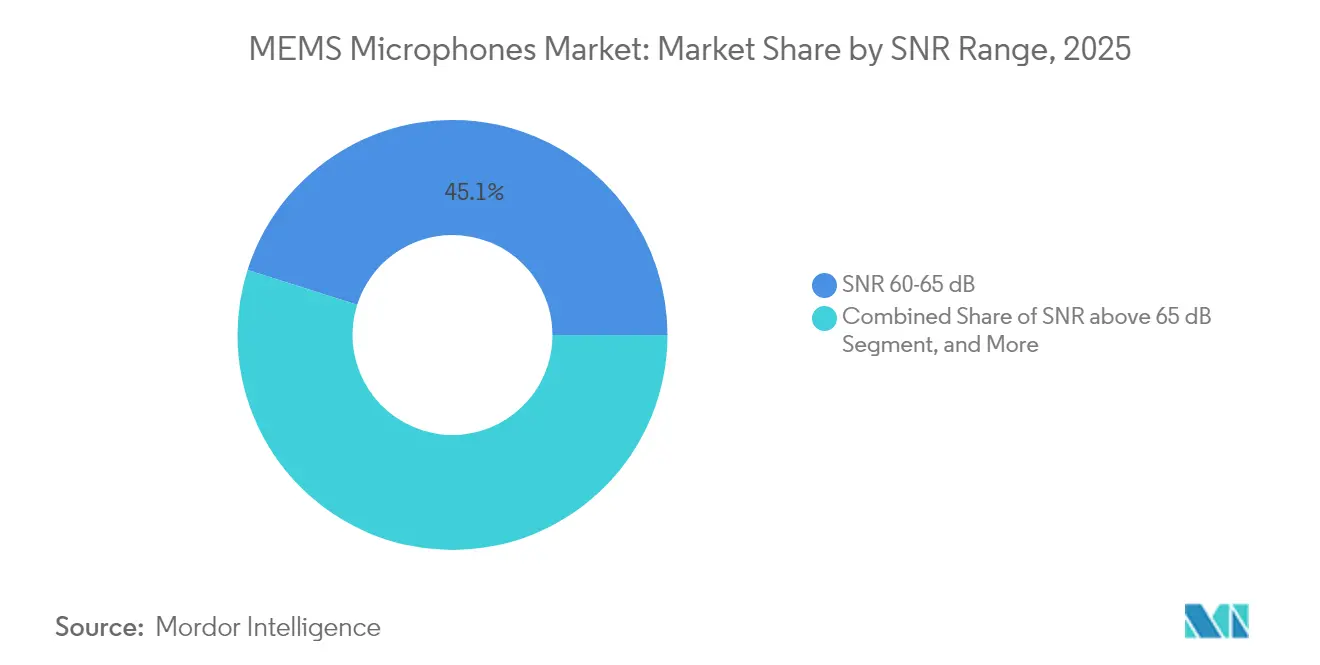
- By SNR range, the SNR 60-65 dB tier captured 45.12% of the MEMS microphone market share in 2025, whereas the SNR >65 dB tier is forecast to post the fastest 7.55% CAGR through 2031.
- By signal type, digital microphones commanded 67.55% share of the MEMS microphone market size in 2025 and are poised to record an 7.82% CAGR through 2031.
- By application, hearing aids accounted for a 49.10% share of the MEMS microphone market size in 2025, while automotive applications are projected to expand at a 6.62% CAGR to 2031.
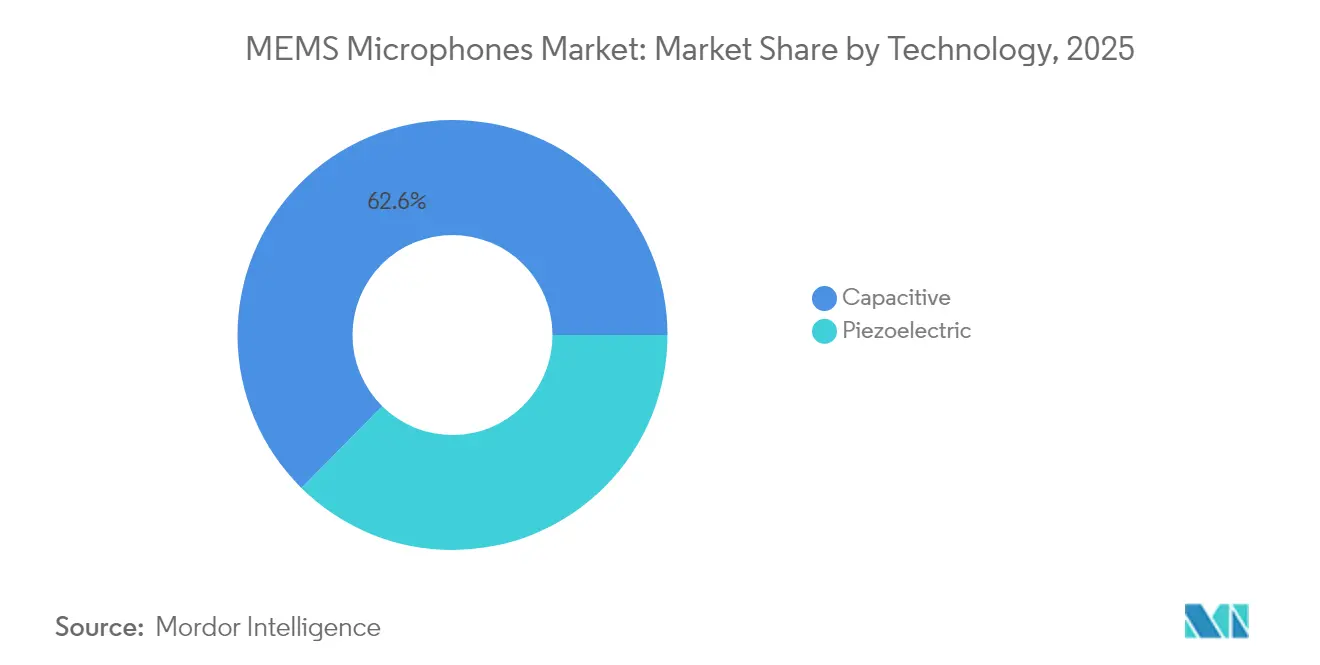
- By technology, capacitive designs held 62.60% share of the MEMS microphone market size in 2025; piezoelectric designs are expected to grow at an 7.95% CAGR over the same period.
- By package type, bottom-port devices led with a 54.20% share of the MEMS microphone market size in 2025, whereas top-port devices are projected to rise at an 7.90% CAGR through 2031.
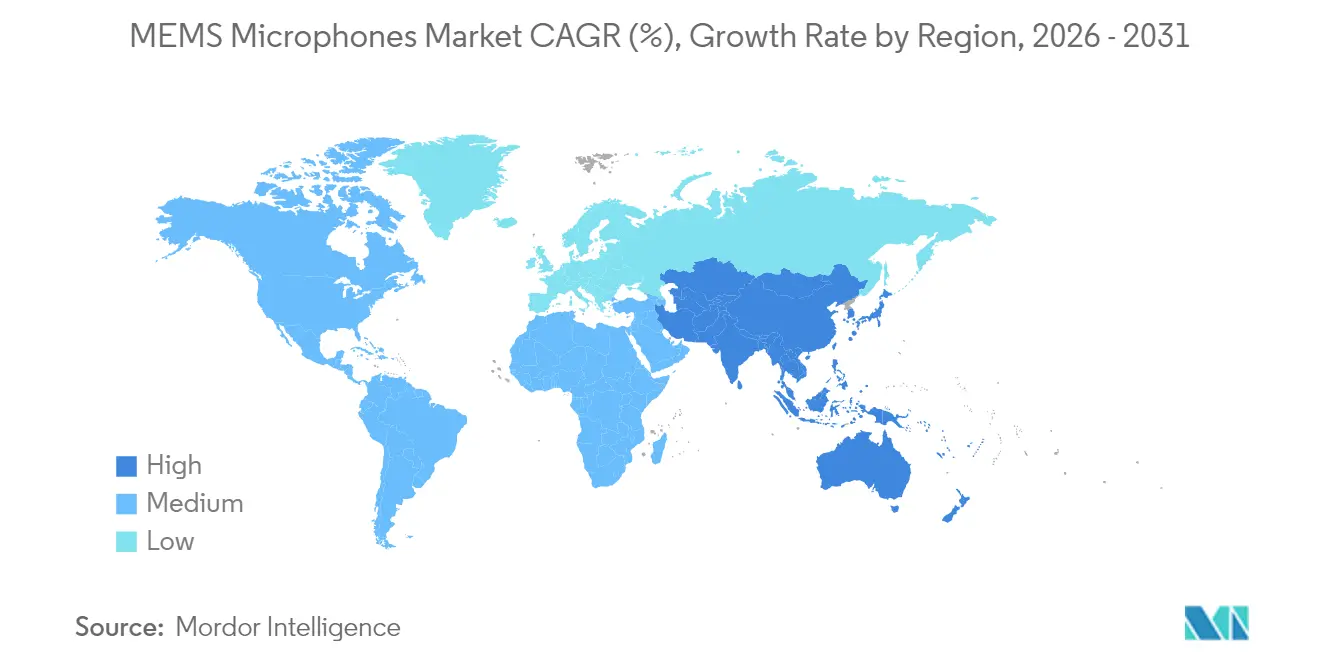
- By geography, the Asia Pacific region dominated the MEMS microphone market with a 46.90% share in 2025, and the Middle East is projected to post the highest CAGR of 6.65% through 2031.
Note: Market size and forecast figures in this report are generated using Mordor Intelligence’s proprietary estimation framework, updated with the latest available data and insights as of 2026.
Global MEMS Microphones Market Trends and Insights
Drivers Impact Analysis*
| Driver | (~) % Impact on CAGR Forecast | Geographic Relevance | Impact Timeline |
|---|---|---|---|
| Proliferation of Voice Assistant Enabled Smart Devices | +1.8% | Global with concentration in North America and Asia Pacific | Medium term (2-4 years) |
| Rising Adoption of MEMS Microphones in True Wireless Stereo Earbuds | +1.5% | Global led by Asia Pacific manufacturing and North America consumption | Short term (≤ 2 years) |
| Growing Demand for High-Fidelity Audio in Smartphones | +1.2% | Asia Pacific core, spill-over to Europe and North America | Medium term (2-4 years) |
| Integration of MEMS Microphones in Smart Infrastructure for Acoustic Sensing | +0.9% | North America and Europe expanding to Asia Pacific | Long term (≥ 4 years) |
| Automotive Cabin Noise Cancellation Systems Adoption | +0.7% | Global with early adoption in Europe and North America | Medium term (2-4 years) |
| Regulatory Push for In-Cabin Driver Monitoring | +0.3% | Europe and North America with Asia Pacific following | Long term (≥ 4 years) |
| Source: Mordor Intelligence | |||
Proliferation of Voice Assistant-Enabled Smart Devices
Global shipments of smart speakers surpassed 150 million units in 2024, and far-field voice pickup requirements are driving the shift toward multi-microphone arrays capable of 65 dB-plus SNR performance.[1]Consumer Technology Association, “Smart Speaker Market Analysis 2024,” cta.tech Device makers now embed wake-word detection and beamforming directly inside microphone packages to conserve system power and reduce latency. Consistent phase response across arrays is crucial for direction-of-arrival algorithms that underpin natural language interfaces. High-SNR microphones also minimize false wake-ups, enhancing user experience and increasing adoption in smart displays, home appliances, and enterprise collaboration equipment.
Rising Adoption of MEMS Microphones in True Wireless Stereo Earbuds
Wireless earphone shipments exceeded 800 million units in 2025, with each pair typically integrating two to four MEMS microphones for enhanced noise cancellation and improved call clarity.[2]International Data Corporation, “Worldwide Wearables Market Forecast 2025,” idc.com Wafer-level packaging reduces the footprint by 40%, allowing for sleeker form factors without compromising battery life. Premium earbuds are increasingly incorporating spatial audio and head-tracking features, which require closely matched microphone pairs for accurate rendering. Standby current has fallen below 10 µA, extending listening time and supporting higher refresh-rate voice pickup for safety alerts and fitness coaching.
Growing Demand for High-Fidelity Audio in Smartphones
Smartphone OEMs differentiate flagship models through cinematic video capture and immersive streaming. Up to six MEMS microphones per handset enable audio zoom, wind noise suppression, and spatial recording.[3]Institute of Electrical and Electronics Engineers, “MEMS Microphone Design and Applications,” ieeexplore.ieee.org Low phase distortion and wide dynamic range ensure compatibility with on-device machine-learning algorithms used in computational videography. The move toward creator-centric features raises design-in value for high-performance microphones, counterbalancing average selling price (ASP) erosion in mainstream tiers.
Integration of MEMS Microphones in Smart Infrastructure for Acoustic Sensing
Smart-city projects deploy distributed microphone arrays to monitor noise pollution, detect traffic incidents, and enhance public safety. Edge computing embedded within microphone modules classifies sound events locally, minimizing bandwidth and addressing privacy concerns. Outdoor units require conformal coatings and extended temperature operation from -40°C to +85°C, prompting vendors to develop ruggedized variants. Similar architectures are emerging in industrial settings for predictive maintenance, where acoustic signatures flag bearing wear and air-leak anomalies well before catastrophic failure.
Restraints Impact Analysis*
| Restraint | (~) % Impact on CAGR Forecast | Geographic Relevance | Impact Timeline |
|---|---|---|---|
| Continuous Decline in Average Selling Prices | -1.4% | Global most pronounced in Asia Pacific manufacturing | Short term (≤ 2 years) |
| Technical Limitations in Extreme Acoustic Environments | -0.8% | Global with specific challenges in automotive and industrial applications | Medium term (2-4 years) |
| Supply Chain Concentration in Southeast Asia Causing Geopolitical Risk | -0.6% | Global impact originating from Asia Pacific concentration | Long term (≥ 4 years) |
| Rising Electromagnetic Interference Challenges in High-Density Wearables | -0.4% | Global concentrated in consumer electronics and wearables | Medium term (2-4 years) |
| Source: Mordor Intelligence | |||
Continuous Decline in Average Selling Prices
STMicroelectronics reported an 8% ASP drop for its Analog, MEMS, and Sensors segment in 2024, highlighting sustained price pressure across high-volume consumer channels. Scaled Asia Pacific fabs support aggressive cost structures that smaller rivals struggle to match, prompting consolidation and capacity rationalization. While integrated digital signal processing can lift margins, development expense and competitive time-to-market windows constrain widespread adoption. Commoditization in entry-level smartphones and IoT gadgets restricts the premium tier TAM, tempering overall revenue growth despite rising unit shipments.
Technical Limitations in Extreme Acoustic Environments
MEMS diaphragms risk damage above 130 dB SPL, limiting deployment near jet turbines, heavy machinery, or live-concert speaker stacks. Automotive electronics subject microphones to rapid temperature swings and high vibration, necessitating costly hermetic packaging that inflates the bill of materials. At frequencies below 100 Hz, capacitive architectures exhibit reduced sensitivity, which curtails their use in bass-intensive professional audio. Additional electromagnetic shielding is often required in dense wearable devices, offsetting the space gains achieved through miniaturization and increasing assembly complexity.
*Our forecasts treat driver/restraint impacts as directional, not additive. The impact forecasts reflect baseline growth, mix effects, and variable interactions.
Segment Analysis
By SNR Range: Premium Audio Drives High-Performance Adoption
The SNR 60-65 dB tier represented 45.12% of the MEMS microphone market in 2025, underpinning mainstream smartphones, tablets, and smart speakers. The premium SNR >65 dB tier is expected to expand at a 7.55% CAGR, driven by the demand for autonomous-driving cabins, AI beamforming arrays, and professional content creation, which require lower self-noise. High-SNR devices support audio zoom and noise-robust speech recognition, fueling differentiation in flagship consumer electronics.
Automotive platforms amplify demand because occupant-monitoring algorithms must isolate driver speech from road, HVAC, and powertrain noise. The AEC-Q103-003 standard requires microphones to retain performance between -40 °C and +125 °C, compelling vendors to optimize materials and package stress relief. Compliance unlocks higher ASPs and entrenches suppliers within multi-year vehicle design cycles, partially hedging consumer demand swings.



By Signal Type: Digital Integration Accelerates System Optimization
Digital variants held a 67.55% share in 2025 and are expected to rise at an 7.82% CAGR as time-division multiplexing, programmable gain, and on-chip filtering simplify PCB layout and enhance noise immunity. Eliminating external analog-to-digital converters cuts component count and frees board area for antennas or battery capacity. Array deployments favor digital outputs because synchronized clocks reduce timing skew and enhance the precision of beamforming.
Analog devices remain relevant where host processors already feature integrated converters or where ultra-low latency voice loops are critical. Some cost-sensitive IoT nodes also retain analog solutions; however, the shrinking cost of mixed-signal silicon is narrowing the differential. Hybrid product lines enable manufacturers to cross-sell to customers transitioning between architectures, thereby maintaining volume leverage.
By Application: Hearing Aids Lead While Automotive Accelerates
Hearing aids accounted for 49.10% of the MEMS microphone market in 2025 as discreet form factors and multi-mic noise suppression elevate performance expectations. Over-the-counter availability in the United States broadens consumer access, and aging demographics in Europe and Japan underpin steady baseline demand. Devices typically integrate three microphones within enclosures smaller than 4 cm³, necessitating wafer-level packaging, matched phase response, and ultra-low power sleep current to prolong battery life.
Automotive adoption is projected to post the fastest 6.62% CAGR through 2031. Increasing regulatory focus on driver vigilance, child presence detection, and clear voice HMI elevates microphone attachment rates per vehicle. Cabin noise cancellation systems also integrate array microphones near headrests and door pillars, expanding unit opportunities beyond infotainment modules. As design cycles can exceed five years, early qualification and supply-chain resilience are key differentiators.
By Technology: Capacitive Dominance Faces Piezoelectric Challenge
Capacitive microphones captured 62.60% share in 2025, thanks to mature tools and lithography compatibility with mainstream CMOS lines. Established wafer fabs deliver cost advantages and predictable performance across consumer volumes. However, piezoelectric devices are forecast to grow at an 7.95% CAGR because they tolerate temperature extremes, vibration, and electromagnetic fields better than capacitive counterparts.
Recent breakthroughs in scandium-doped aluminum nitride films have closed the sensitivity gap, and the absence of a bias voltage reduces standby power. Automotive and industrial customers value the intrinsic immunity to electrostatic discharge, which simplifies ESD design and reduces the need for external components. As 200 mm and 300 mm piezoelectric production scales approach price parity with capacitive, adoption in wearables and smart infrastructure nodes may accelerate.
By Package Type: Top-Port Innovation Drives Market Shift
Bottom-port designs held a 54.20% market share in 2025 because consumer product engineers had a good understanding of through-hole acoustic channels. They ease gasket design and protect diaphragms during surface-mount assembly. Nonetheless, top-port packages are expected to grow at an 7.90% CAGR, as they deliver a flatter frequency response and lower acoustic resonance. Designers gain the freedom to place microphones closer to device enclosures, reducing tube length and improving low-frequency pickup.
Wafer-level top-port architectures integrate dust filters and resonance dampers directly above the diaphragm, trimming the bill of materials. In true wireless earbuds, the absence of board-through holes allows for thinner PCB stacks, reclaiming internal volume for batteries. Hearing-aid makers utilize this configuration to align the port orientation with the outer ear canal, thereby enhancing directivity and speech intelligibility in noisy environments.
Geography Analysis
Asia Pacific led the MEMS microphone market with a 46.90% share in 2025. High-volume smartphone assembly in China, South Korea, and Vietnam anchors regional consumption, while foundries in Taiwan and Singapore provide front-end fabrication scale. Government incentives for sensor localization support new entrants; however, over-reliance on regional manufacturing poses geopolitical and logistics risks. Japanese suppliers focus on automotive-grade components, leveraging longstanding relationships with Tier-1 system integrators.
North America maintains a strong position in premium applications such as professional audio interfaces and advanced driver assistance systems. Silicon Valley platform companies dictate performance roadmaps for voice assistants and AR-VR headsets, driving early adoption of high-SNR and integrated DSP features. U.S. automakers incorporate MEMS microphones into cabin monitoring and acoustic holography, contributing to steady demand independent of smartphone cycles.
Europe benefits from stringent safety regulations that mandate the installation of driver-monitoring cameras and audio sensors in new vehicles. Industrial IoT retrofits across Germany and Scandinavia incorporate MEMS microphones for predictive maintenance, driving modest yet resilient growth. The Middle East registers the fastest 6.65% CAGR, underpinned by smart-city projects in the United Arab Emirates and Saudi Arabia that deploy acoustic nodes for traffic and security analytics. The South American market remains nascent due to macroeconomic volatility, but growing demand for smartphone replacements offers long-term potential.

Regulatory Landscape
Global standardization is tightening around MEMS microphone characterization and reliability, shifting qualification from vendor-specific methods to harmonized benchmarks. The International Electrotechnical Commission (IEC) published IEC 62047-50:2025 (April 2025) to define performance test methods and conditions for MEMS capacitive microphones, including procedures tied to sensitivity and noise metrics, and IEC 62047-49:2025 (November 2025) to standardize reliability testing methods for piezoelectric MEMS structures under temperature and humidity stress. Trade and customs policies also affect landed cost and sourcing decisions for microphone components that sit between semiconductor and finished-audio classifications.
In India, a November 2024 Delhi High Court ruling in Vivo Mobile India Pvt. Ltd. v. Customs Authority for Advance Rulings treated MEMS microphones as microphones under CTH 8518 (instead of integrated circuits under CTH 8542), influencing duty treatment for imported parts. In the United States, a January 2026 Federal Register action outlined a two-phase plan to address semiconductor imports, including an immediate 25% tariff on a narrow category of semiconductors tied to AI and technology policy, increasing supply chain exposure for MEMS microphone ecosystems that rely on cross-border semiconductor flows.
Value Chain Analysis
The MEMS microphone value chain starts with specialty materials and wafer substrates, then moves into MEMS transducer fabrication and mixed-signal ASIC development, followed by wafer-level packaging, module assembly, qualification, and distribution into OEM and contract-manufacturing channels. A common production approach uses a two-chip architecture that pairs a MEMS transducer die (often capacitive, with growing piezoelectric adoption in rugged use cases) with an ASIC for amplification and signal processing, letting vendors differentiate on noise performance, power, and interface (analog vs digital) while keeping footprints suited to wearables, smartphones, hearing aids, and vehicle cabins.
Industry structure increasingly blends vertically integrated suppliers with ecosystem partners in advanced packaging and audio-AI enablement. Syntiant completed the USD 150 million acquisition of Knowles consumer MEMS microphone business in January 2025, reflecting a shift toward bundling MEMS microphones with edge AI audio solutions rather than selling standalone components. Regionalization efforts are also reshaping back-end steps: Infineon Technologies and Kaynes Semicon signed an MoU in September 2025 to establish Indias first MEMS microphone and advanced semiconductor package manufacturing facility, highlighting how packaging and final test are becoming strategic levers to reduce lead times, improve resilience, and manage tariff and logistics risk.
Competitive Landscape
The landscape is moderately concentrated, with the top five suppliers collectively holding roughly a 65% share. Knowles divested its consumer unit to Syntiant in December 2024 for USD 150 million, refocusing on medical and industrial niches while Syntiant gains mature supply chains for high-volume wearables. STMicroelectronics has committed USD 75 million to expand automotive-qualified MEMS microphone output in Italy, targeting demand for cabin monitoring. TDK-InvenSense has released a 70 dB-SNR digital microphone that meets AEC-Q103-003 standards, reinforcing its automotive portfolio.
Patent filings exceed 300 per year, with emphasis on diaphragm topology, acoustic porting, and embedded AI accelerators. Start-ups such as Vesper and MEMSensing are pursuing piezoelectric and wake-word-enabled designs that promise lower power consumption and integrated intelligence. Meanwhile, volume leaders reduce ASPs through advanced lithography migration and the use of larger-diameter wafers. Strategic priorities now balance cost efficiency with differentiated feature sets that defend margins in premium segments.
Mergers and acquisitions align around complementary capabilities. Infineon’s 2024 acquisition of a European design team accelerates its piezoelectric roadmap, while Bosch Sensortec’s ultra-low-power release targets IoT nodes with an ASP below USD 1. Industry collaboration with smartphone OEMs and automotive Tier-1 suppliers shapes product cadence, with joint reference designs shortening qualification cycles and locking in socket wins.
MEMS Microphones Industry Leaders
-
Knowles Corporation
-
GoerTek Inc.
-
AAC Technologies Holdings Inc.
-
STMicroelectronics N.V.
-
Infineon Technologies AG
- *Disclaimer: Major Players sorted in no particular order

Market Opportunities and Future Outlook
A near-term whitespace sits in professional and creator-grade audio, where MEMS microphones compete on studio-class noise performance, repeatability, and manufacturability that traditional electret designs struggle to match at small form factors. In April 2026, Røde introduced Sonaura, a studio-grade MEMS microphone technology reported at 83 dB SNR through a technical collaboration with Infineon Technologies, indicating active productization and brand pull beyond phones and earbuds. This supports opportunities for suppliers that can deliver tight matching across multi-mic arrays, low distortion, and robust acoustic porting for camera accessories, compact recorders, and conferencing endpoints.
Another opportunity area is the move from discrete microphones to integrated microphone modules that combine high-SNR capture with on-device processing and always-on operation constraints. Demand drivers visible in the market, such as multi-mic arrays in premium smartphones and push toward edge classification in smart infrastructure acoustic sensing, create room for suppliers that can co-design MEMS plus ASIC, packaging, and firmware-ready interfaces. Alongside this, optical and hybrid transduction approaches are moving toward commercialization and scale: in May 2026, sensiBel announced a high-volume supply-chain partnership with Silex Microsystems to manufacture its optical MEMS microphone, indicating that foundry partnerships and manufacturing readiness are becoming decisive for entrants targeting performance ceilings beyond conventional capacitive architectures.
Recent Industry Developments
- January 2026: GoerTek debuted a compact MEMS acoustic sensor at CES 2026, featuring an IP68 rating and a new waterproof architecture. The design targets wearables and compact devices where water resistance and thin profiles drive microphone selection and packaging.
- October 2025: Knowles introduced the MM60 MEMS microphone for AI-optimized hearing aids at the EUHA convention in Nuremberg. The product positions microphone performance and integration around hearing-health workloads that rely on on-device algorithms for speech enhancement and noise management.
- September 2024: Knowles signed a definitive agreement to sell its Consumer MEMS Microphones business to Syntiant for USD 150 million. The transaction accelerates portfolio realignment across the supplier base and combines acoustic front ends with edge AI processing roadmaps.


Research Methodology Framework and Report Scope
Market Definition and Coverage
This market covers revenue generated from MEMS microphones sold as components and integrated modules across end devices, counted at the point where the microphone is shipped into the device supply chain. Values are measured in USD and reflect demand across key consuming industries.
Scope exclusions: Excludes traditional electret and other non-MEMS microphone technologies, as well as standalone acoustic test and measurement equipment sales.
Segmentation Overview
-
By SNR Range
- SNR <60 dB
- SNR 60-65 dB
- SNR >65 dB
-
By Signal Type
- Analog
- Digital
-
By Application
- Consumer Electronics and Accessories
- Hearing Aids
- Wearables and IoT Devices
- Head-Mounted Displays (AR, VR, MR)
- Automotive
- Other Applications
-
By Technology
- Capacitive
- Piezoelectric
-
By Package Type
- Top Port
- Bottom Port
-
By Geography
-
North America
- United States
- Canada
- Mexico
-
Europe
- Germany
- United Kingdom
- France
- Russia
- Rest of Europe
-
Asia-Pacific
- China
- Japan
- India
- South Korea
- Australia
- Rest of Asia-Pacific
-
Middle East and Africa
-
Middle East
- Saudi Arabia
- United Arab Emirates
- Rest of Middle East
-
Africa
- South Africa
- Egypt
- Rest of Africa
-
Middle East
-
South America
- Brazil
- Argentina
- Rest of South America
-
North America
Data Sources, Market Sizing, and Validation
Desk Research
Desk research started with building the industry map, where we aligned what gets counted as a MEMS microphone and how it flows from wafer and packaging stages into end devices. Public sources were used to anchor the demand context and unit direction, such as U.S. International Trade Commission data, UN Comtrade trade statistics, OECD indicators, World Bank macro series, and International Telecommunication Union (ITU) connectivity indicators.
To make the model practical, we also reviewed company filings, investor presentations, product briefs, and press coverage to understand shipment ramps, pricing direction, and application mix shifts, such as the move toward multi-mic arrays in phones and smart devices. Patent databases and shipment-level import and export datasets were used selectively to sanity-check technology intensity and cross-border supply movements. The sources listed are illustrative only, and many other public references were used to collect, validate, and clarify data points during the study.
Primary Interviews and Surveys
Primary work was used to pressure-test the sizing logic through interviews and short surveys with component suppliers, device OEM teams, channel participants, and industry specialists who track audio and sensing content. Because this is a global supply chain, inputs were validated across APAC, EMEA, and the Americas to align shipment seasonality, ASP movement, and adoption timing by application.
Distribution of primary research fieldwork respondents
| Company type | Respondent position | Region |
|---|---|---|
| Top tier: 35% | CXOs: 18% | APAC: 48% |
| Mid tier: 46% | Functional/Unit leaders: 32% | EMEA: 32% |
| Smaller Players: 19% | Managers: 50% | Americas: 20% |
Market-Sizing & Forecasting
Sizing was built with a top-down model where device demand pools were reconstructed, then converted into MEMS microphone value using attach rates and average selling prices by application. After the demand pools were shaped, the market total is obtained by applying the microphone count per device and the blended ASP by signal type and package preference.
Inputs were selected because they are measurable and explain value changes well, including smartphone and wearable shipment trends, growth in true wireless earbuds and accessories, the average number of microphones used per device (single versus array setups), the split between analog and digital interfaces, and ASP steps linked to SNR ranges and package type (top port versus bottom port). To keep outputs realistic, we corroborated totals with selective bottom-up approximations, such as supplier revenue sampling, channel checks on pricing bands, and a few volume times ASP cross-checks for high-volume applications. Where variances persisted, we adjusted the blended assumptions.
For forecasting, scenario analysis was used with a central case guided by expert consensus on device shipment outlooks, microphone content growth, and pricing pressure versus premium mix. Where bottom-up signals were missing for smaller applications, gaps were handled by using proxy indicators, for example related device shipment indices, and then re-checked in primary calls before finalizing year-by-year curves.
Data Validation & Update Cycle
Validation was done by checking the model against independent signals like device shipment baselines, trade movement direction, and the implied revenue per unit range for each major application. When a number looked too high or too low, we revisited the drivers first, such as attach rate, microphone count per device, and ASP ladders, before accepting any revision.
A multi-step review is followed, where assumptions are checked by a second analyst and any outliers are discussed and resolved before sign-off. Reports are refreshed annually, and interim updates are triggered when material events occur, such as sudden device shipment resets, major regulatory changes affecting audio features, or sharp currency moves. Before delivery, a fresh review pass is completed so clients receive the most current view available at that time.
Mordor Intelligence's Mems Microphones Market Size Compared Against Other Published Estimates
Published market values for MEMS microphones can look far apart, even when the topic name is the same, because the fine print changes what is being counted and how the forecast path is shaped. Differences usually come from technology inclusion, the year chosen as the start point, and how pricing is carried forward when performance mixes shift.
Electret condenser microphones and other non-MEMS microphone types sit outside Mordor Intelligence's scope, and that exclusion often narrows the total versus studies that treat all microphone technologies as one pool. Gaps also show up when one estimate uses an aggressive device growth case or assumes faster ASP expansion tied to premium features, without checking if adoption is broad enough across mid-range devices and regions. Currency conversion timing and how often assumptions are refreshed can further widen the spread, especially when electronics demand shifts quickly.
Benchmark comparison
| Source | Market Size | Gaps in Research Methodology |
|---|---|---|
| Mordor Intelligence | USD 2.54 B (2026) | |
| Global Consultancy A | USD 2.64 B (2026) | Uses a wider growth arc and often treats application expansion as uniformly high, which can push value upward when attach rates in wearables and accessories are assumed to rise faster than observed in channel checks. |
| Industry Publisher B | USD 2.08 B (2024) | Different base year and pricing context can compress the value, and the estimate may rely more heavily on historic shipment conditions without fully carrying forward the later device mix shift toward multi-mic designs. |
The comparison shows that year selection and the definition of what counts as a MEMS microphone explain most of the spread. By keeping inputs tied to device shipments, microphone content per device, and realistic ASP bands, the resulting number stays traceable and easier to reproduce when assumptions are updated.


Key Questions Answered in the Report
What is the current value of the MEMS microphone market?
The MEMS microphone market size stands at USD 2.54 billion in 2026.
How fast is the market expected to grow by 2031?
The market is forecast to expand at a 5.88% CAGR between 2026 and 2031, reaching USD 3.38 billion.
Which application segment leads in revenue?
Hearing aids hold the largest share at 49.10% as of 2025.
Where is the fastest regional growth projected?
The Middle East is expected to post the highest 6.65% CAGR through 2031.
Which technology type is growing the quickest?
Piezoelectric microphones exhibit the fastest projected growth at an 7.95% CAGR.
Why are digital MEMS microphones gaining traction?
Digital outputs integrate signal conditioning, lower PCB complexity, and support multi-mic arrays, explaining their 67.55% share and 7.82% growth trajectory.
Page last updated on:






