Medical Waste Containers Market Size and Share
Market Overview
| Study Period | 2020 - 2031 |
|---|---|
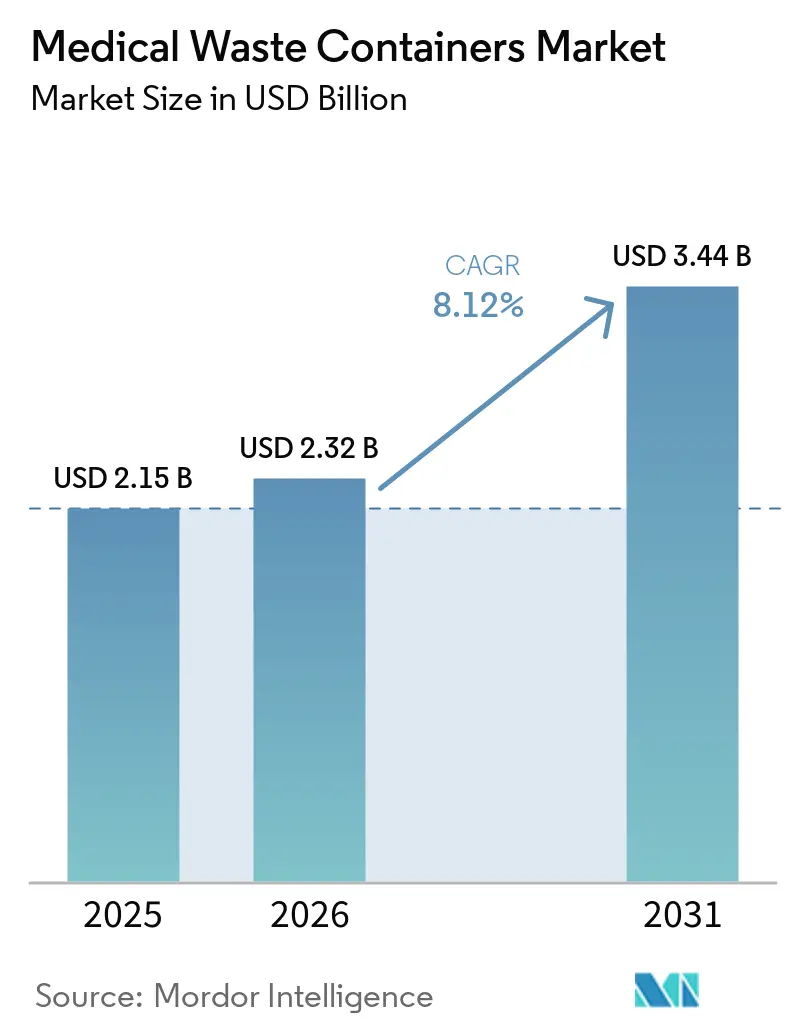
| Market Size (2026) | USD 2.32 Billion |
| Market Size (2031) | USD 3.44 Billion |
| Growth Rate (2026 - 2031) | 8.12% CAGR |
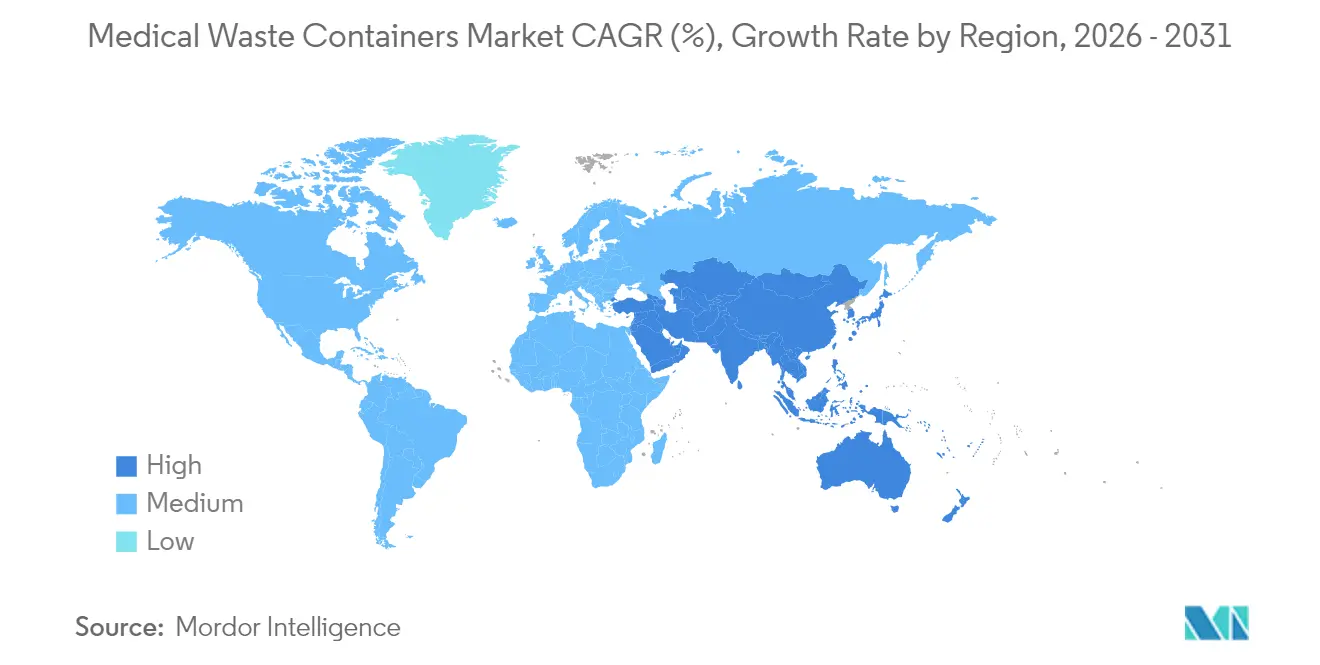
| Fastest Growing Market | Asia Pacific |
| Largest Market | North America |
| Market Concentration | Medium |
Major Players *Disclaimer: Major Players sorted in no particular order Image © Mordor Intelligence. Reuse requires attribution under CC BY 4.0. | |
Medical Waste Containers Market Analysis by Mordor Intelligence
Medical Waste Containers Market size in 2026 is estimated at USD 2.32 billion, growing from 2025 value of USD 2.15 billion with 2031 projections showing USD 3.44 billion, growing at 8.12% CAGR over 2026-2031.
Heightened post-pandemic waste volumes, stricter regulatory oversight and a shift toward reusable containment systems continue to lift demand, while the recent convergence of waste management and digital technology reshapes product portfolios. Mergers such as Waste Management’s 2024 acquisition of Stericycle are redrawing competitive boundaries, prompting regional specialists to double down on clinical performance and sustainability features. Smart, IoT-enabled vessels post double-digit growth as hospitals prioritize real-time fill-level alerts, compliance logs and predictive maintenance, whereas supply chain uncertainty around medical-grade polypropylene adds cost tension for one-time-use container lines.
Key Report Takeaways
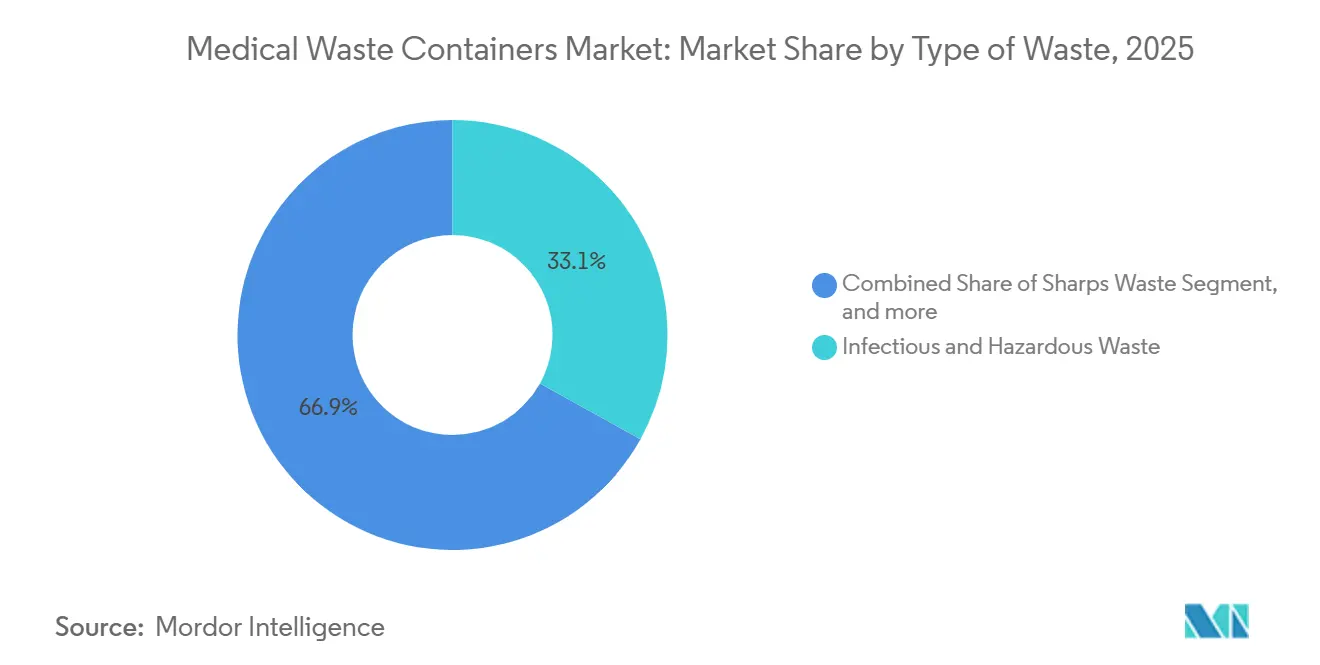
- By type of waste, infectious and hazardous waste containers held 33.05% of the medical waste containers market share in 2025, whereas cytotoxic and chemotherapy waste containers are expanding at an 8.78% CAGR through 2031.
- By product, sharps containers led with 38.67% revenue share in 2025; smart and IoT-enabled containers are projected to register an 11.09% CAGR to 2031.
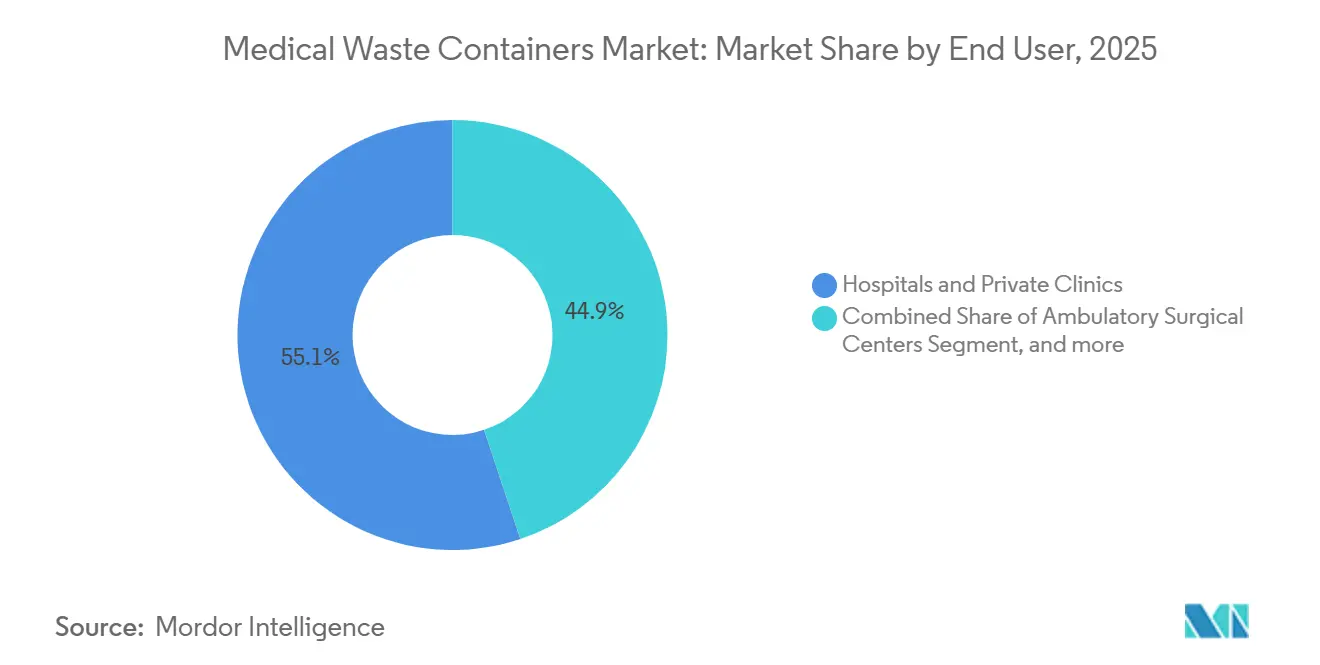
- By end user, hospitals and private clinics accounted for 55.12% share of the medical waste containers market size in 2025, while veterinary hospitals and clinics record the fastest 9.31% CAGR to 2031.
- By geography, North America commanded 40.35% of the medical waste containers market share in 2025; Asia-Pacific is forecast to post an 8.77% CAGR through 2031.
Note: Market size and forecast figures in this report are generated using Mordor Intelligence’s proprietary estimation framework, updated with the latest available data and insights as of 2026.
Global Medical Waste Containers Market Trends and Insights
Drivers Impact Analysis*
| Driver | (~) % Impact on CAGR Forecast | Geographic Relevance | Impact Timeline |
|---|---|---|---|
| Rising infectious waste post-pandemic | +1.8% | Global, concentrated in North America and Europe | Medium term (2-4 years) |
| Tightening global waste management regulations | +1.5% | Global, led by North America and EU frameworks | Long term (≥ 4 years) |
| Growth of healthcare infrastructure in emerging economies | +2.1% | APAC core, spill-over to MEA and Latin America | Long term (≥ 4 years) |
| Push toward sustainable waste solutions | +1.2% | North America and EU leading, expanding to APAC | Medium term (2-4 years) |
| Proliferation of smart waste management technologies | +0.9% | North America and Europe, extending to developed APAC | Medium term (2-4 years) |
| Hospital adoption of on-site sterilization systems | +0.7% | Global, concentrated in developed healthcare markets | Short term (≤ 2 years) |
| Source: Mordor Intelligence | |||
Rising Infectious Waste Post-Pandemic
Global hospitals generated up to 3.4 kg of hazardous waste per person per day at pandemic peaks, a level that remains above pre-2020 norms. Turkish facilities alone reported a jump from 98,729 tons in 2017 to 130,401 tons in 2022, reinforcing the structural nature of the surge. In addition, healthcare facilities produce approximately 6 million tons of regulated waste each year. Of this, roughly 15% necessitates specialized containment to ensure safe on-site segregation, transport safety, and traceability. Smart waste management systems automate segregation protocols, enable real-time waste tracking, and generate digital audit trails to ensure regulatory compliance. Continued reliance on single-use PPE, higher outpatient volumes and rigorous infection-control protocols sustain elevated waste streams in 2025. Container designs that incorporate hands-free lids and antimicrobial surfaces are gaining favor among infection-control teams.
Tightening Global Waste Management Regulations
Forty US states now enforce the Hazardous Waste Generator Improvements Rule, widening documentation and container-specification demands on healthcare providers.[1]Ohio Environmental Protection Agency, “Regulation of Chemotherapy Wastes,” ohioepa.custhelp.com Michigan’s 2024 extension for partially filled sharps boxes and China’s nationwide recycling build-out both create nuanced opportunities for manufacturers offering extended-storage vessels and standardized color-coding. Compliance complexity favors suppliers with turnkey audit support and digital traceability.
Growth of Healthcare Infrastructure in Emerging Economies
Asian governments channel rising health budgets into new hospitals, laboratories and outpatient clinics, embedding modern waste rooms and segregation stations during construction. India’s biomedical regulations mandate source segregation and bar incineration of chlorinated bags, steering buyers toward polypropylene containers compatible with autoclave cycles. Scalable, high-volume SKUs that balance cost sensitivity with safety certifications gain rapid traction across Tier 2 Chinese cities.
Push Toward Sustainable Waste Solutions
German providers generate 4.8 million tons of healthcare waste annually, spurring adoption of reusable container fleets as hospitals strive to cut landfill volumes.[2]COMPAMED, “Addressing the Healthcare Sector's Medical Waste Problem at KILMER 2025,” array.aami.org Daniels Health’s Surgismart has demonstrated a 33% plastics reduction and an 87% drop in needlestick injuries at client sites.[3]Daniels Health USA, “Surgismart,” danielshealth.com Lifecycle analyses that quantify carbon, plastic and injury avoidance increasingly guide procurement specifications.
Restraints Impact Analysis*
| Restraint | (~) % Impact on CAGR Forecast | Geographic Relevance | Impact Timeline |
|---|---|---|---|
| Disposal cost pressures on small-scale healthcare providers | -0.8% | Global, especially rural and developing areas | Short term (≤ 2 years) |
| Volatility in supply of medical-grade plastics | -0.6% | Global manufacturing hubs, centered in APAC | Medium term (2-4 years) |
| Regulatory scrutiny in industry consolidation | -0.4% | North America and Europe, influencing M&A | Short term (≤ 2 years) |
| Declining sharps volume due to drug-delivery innovation | -0.3% | Developed markets adopting pre-filled devices | Long term (≥ 4 years) |
| Source: Mordor Intelligence | |||
Disposal Cost Pressures on Small-Scale Healthcare Providers
Waste transport and treatment bills can consume up to 25% of operating budgets in rural clinics, raising resistance to premium container systems despite their safety benefits. Studies show that 90% of operating-room trash is non-infectious yet often ends up in red-bag bins, inflating disposal invoices. Demand therefore splits: high-compliance incumbents retain larger accounts, while value-tier products address cost-sensitive practices.
Volatility in Supply of Medical-Grade Plastics
Polypropylene and HDPE feedstocks face sporadic shortages linked to refinery outages and trade disputes, adding pricing uncertainty to disposable container lines. Reusable systems partly hedge resin risk, reinforcing the strategic logic for circular designs.
*Our forecasts treat driver/restraint impacts as directional, not additive. The impact forecasts reflect baseline growth, mix effects, and variable interactions.
Segment Analysis
By Type of Waste: Infectious Dominance Meets Specialized Growth
Infectious and hazardous waste vessels captured 33.05% of the medical waste containers market share in 2025. Hospitals rely on them for microbiological samples, blood-soaked materials and isolation-ward disposables, which drive consistent base demand. Cytotoxic and chemotherapy containers are a smaller but fastest-expanding niche, advancing at an 8.78% CAGR as oncology infusion volumes climb and national agencies tighten hazardous-drug rules.
Rising oncology caseloads push pharmacies to segregate bulk versus trace chemo residues, spurring orders for color-coded yellow and black vessels that withstand high-temperature incineration. Sharps bins remain indispensable but see moderate growth as some biologic injectables switch to safety-engineered pens. Non-infectious general waste containers lose share as staff training improves segregation accuracy, cutting over-classification.


By Product: Smart Technology Disrupts Traditional Sharps Leadership
Sharps containers dominated 2025 revenue with a 38.67% slice of the medical waste containers market. Federal rules stipulate puncture-resistant walls and restricted openings, cementing their status across inpatient and outpatient settings. Meanwhile, smart and IoT-enabled models clock an 11.09% CAGR by embedding sensors that flag fill thresholds, automate pick-up logs and support chain-of-custody audits.
Chemotherapy-rated units piggy-back on oncology growth and Environmental Protection Agency listings of certain antineoplastic drugs. RCRA-compliant canisters serve pharmaceutical returns and expired narcotics, buoyed by recent DEA take-back campaigns. Antimicrobial-treated surfaces gain favor in procedure suites seeking to suppress biofilm. Collectively, digital connectivity plus antimicrobial engineering recasts competitive value away from commodity polymers toward software and coating science.
By End User: Hospital Dominance Challenged by Veterinary Surge
Hospitals and private clinics generated 55.12% of 2025 revenue, underlining their complex waste portfolios that span sharps, chemo, pathology and pharmaceutical streams. Larger academic centers deploy multi-bin stations outside every OR, ICU and oncology bay, ensuring regulatory compliance and occupational safety. Veterinary hospitals post a 9.31% CAGR, benefiting from growing pet ownership and parity regulations that treat animal sharps and chemo residues under identical risk classes.
Ambulatory surgical centers, dialysis chains and diagnostic labs collectively uplift mid-volume demand. Home-health applications open micro-container opportunities for insulin users, fueled by state recycling campaigns encouraging patient return programs. Dental practices rely on compact puncture-proof jars to satisfy OSHA’s Bloodborne Pathogens Standard.
Geography Analysis
North America retained leadership with a 40.35% medical waste containers market share in 2025, underpinned by an entrenched compliance culture, advanced logistics and the Waste Management–Stericycle mega-network that services more than 3,700 healthcare facilities. State-level variations such as Michigan’s storage-time flexibility nurture innovation in extended-hold designs, while federal RCRA tracking sharpens paperwork needs that smart containers readily address.
Europe continues to emphasize circular economy mandates. Germany alone produces 4.8 million tons of healthcare refuse annually, creating fertile ground for reusable fleet rollouts and plastic reduction pilots. The Single-Use Plastics Directive and national ecomodulated fees steer provider preference toward containers with documented life-cycle savings.
Asia-Pacific delivers the fastest 8.77% CAGR, buoyed by hospital buildouts in China, India and ASEAN states. The medical waste containers market size for the region is projected to double within ten years as governments subsidize capacity to meet universal coverage goals. Vendors succeed by pairing international certifications with tiered pricing that aligns to local budgets.
The Middle East and Africa trail in absolute terms but demonstrate double-digit uptake where oil-funded hospital clusters or donor-backed clinics demand Western-grade waste segregation infrastructure. Latin America shows steady replacement cycles, particularly in outpatient clinics shifting away from improvised jars toward certified sharps receptacles.

Competitive Landscape
The global field is moderately consolidated. Waste Management’s USD 7.2 billion buyout of Stericycle in November 2024 created the single largest integrated collector, transporter and incinerator network for regulated waste in North America. The deal accelerates cross-selling of digital track-and-trace containers into Stericycle’s clinical base while leveraging WM’s landfill and logistics footprint. Competitors respond by stressing engineered safety outcomes: Daniels Health demonstrates an 87% reduction in sharps injuries with its Surgismart line, converting safety officers into brand advocates.
Clean Harbors underscores full-suite hazardous services, reporting 3.5 million metric tons of GHG avoidance in 2023 and positioning incineration upgrades as differentiators for high-toxicity waste. Becton Dickinson’s USD 2.5 billion US manufacturing expansion secures syringe output and container-adjacent supply resilience, reducing lead-time risk for sharps collectors.
Start-ups target IoT telemetry, offering retrofit sensors that transform legacy bins into connected assets, while AI vision systems pilot auto-classification of waste streams at dock entrances. The competitive field now orbits around three axes: scale economies in hauling, clinical performance metrics and digital compliance capabilities.
Medical Waste Containers Industry Leaders
Becton, Dickinson and Company
Thermo Fisher Scientific, Inc.
Bemis Manufacturing Company
Cardinal Health Inc.
Daniels Health
- *Disclaimer: Major Players sorted in no particular order


Recent Industry Developments
- May 2025: Becton Dickinson announced a USD 2.5 billion investment in U.S. manufacturing capacity over five years, enhancing its position in medical device production including sharps disposal systems. The investment supports domestic production of critical medical devices and strengthens supply chain resilience for medical waste container manufacturing.
- November 2024: Waste Management completed its USD 7.2 billion acquisition of Stericycle, creating the industry's largest medical waste management company with enhanced capabilities across North America's most extensive disposal network. The transaction combines WM's logistics infrastructure with Stericycle's specialized medical waste expertise, generating projected annual synergies exceeding USD 125 million.
- August 2024: Clean Harbors achieved over 3.5 million metric tons of greenhouse gas avoidance in 2023 through sustainable waste management practices, while reporting 5% revenue growth to USD 1.38 billion in Q1 2024. The company's Environmental Services segment showed 10% growth driven by high-value waste disposal and recycling services.
- April 2024: Veolia North America set ambitious growth targets for the U.S. environmental services market, aiming for 50% revenue increase by 2027 and doubling in size by 2030. The company plans to treat 2 million tons of hazardous waste by 2027, reinforcing its leadership in hazardous waste management including medical waste services.


Research Methodology Framework and Report Scope
Market Definitions and Key Coverage
Our study defines the medical waste containers market as every rigid, leak-proof, and puncture-resistant receptacle, whether disposable or reusable, designed to hold infectious, sharps, pharmaceutical, cytotoxic, and other regulated wastes that originate from hospitals, ambulatory centers, laboratories, home-care settings, veterinary clinics, and life-science R&D units, until the load is transferred for treatment or final disposal.
Scope Exclusions: Bulk transport drums, on-site sterilizers, and general utility trash bins fall outside Mordor Intelligence's scope.
Segmentation Overview
- By Type of Waste
- Infectious & Hazardous Waste
- Sharps Waste
- Non-Infectious / General Waste
- Cytotoxic & Chemotherapy Waste
- Pharmaceutical Waste
- Radioactive Waste
- Pathological Waste
- By Product
- Sharps Containers
- Disposable Sharps Containers
- Reusable Sharps Containers
- Chemotherapy-Rated Containers
- Bio-hazardous Red-Bag Containers
- RCRA-Compliant Hazardous-Waste Containers
- Pharmaceutical Waste Containers
- Smart / IoT-Enabled Containers
- Antimicrobial-treated Containers
- Sharps Containers
- By End User
- Hospitals & Private Clinics
- Ambulatory Surgical Centers
- Dialysis Centers
- Diagnostic & Pathology Laboratories
- Pharmaceutical & Biotechnology Companies / CROs
- Academic & Research Institutes
- Veterinary Hospitals & Clinics
- Home Healthcare Settings
- Dental Clinics
- By Geography
- North America
- United States
- Canada
- Mexico
- Europe
- Germany
- United Kingdom
- France
- Italy
- Spain
- Rest of Europe
- Asia-Pacific
- China
- Japan
- India
- Australia
- South Korea
- Rest of Asia-Pacific
- Middle East & Africa
- GCC
- South Africa
- Rest of Middle East & Africa
- South America
- Brazil
- Argentina
- Rest of South America
- North America
Detailed Research Methodology and Data Validation
Primary Research
Mordor analysts interviewed hospital infection-control officers, waste-management buyers, container OEM sales managers, and regulatory auditors across North America, Europe, Asia-Pacific, and the GCC. These conversations tested disposal-rate assumptions, confirmed container replacement cycles, and revealed region-specific compliance costs, enabling us to refine volumes and average selling prices that desk work alone could not pin down.
Desk Research
We first assembled baseline inputs from open, high-credibility sources such as the U.S. Environmental Protection Agency, Centers for Disease Control and Prevention, World Health Organization, Eurostat hazardous-waste files, and UN Comtrade shipment codes for HS 3923/7310 containers. Company 10-Ks, state regulatory libraries, and leading trade associations (Healthcare Waste Institute, International Solid Waste Association) enriched regulatory timelines and pricing ranges. Paid datasets like D&B Hoovers and Dow Jones Factiva supplied revenue splits that helped us gauge vendor penetration. The sources listed are illustrative; many other publications and databases were consulted to validate figures and clarify gray areas.
Market-Sizing & Forecasting
A top-down reconstruction started with regulated medical waste generation (kilograms per occupied hospital bed, per surgical episode, and per dialysis session), which was then aligned with facility counts and outpatient visit data to derive container demand pools. We corroborated the totals with selective bottom-up cross-checks, supplier revenue roll-ups and sampled ASP × unit volumes, before reconciling minor variances. Key model variables include procedure volumes, inpatient occupancy, container reuse ratios, OSHA fine trajectories, and RCRA enforcement upticks. Forecasts deploy multivariate regression blended with scenario analysis to reflect diverging regulatory stringency and healthcare capacity expansions, while gaps in bottom-up estimates are bridged through region-specific substitution factors vetted by industry experts.
Data Validation & Update Cycle
Model outputs pass a multi-step review: automated variance scans, senior-analyst sign-offs, and, if deviations exceed preset thresholds, re-contact of select primary respondents. Reports refresh every twelve months, and interim updates are triggered by material events such as sweeping regulatory amendments or a large M&A shift. A last-mile analyst pass ensures clients receive a current, internally consistent view.
Why Mordor's Medical Waste Containers Baseline Commands Reliability
Published values often diverge because firms treat waste categories, end-use settings, and currency conversions differently, and they refresh at uneven intervals.
Key Gap Drivers include some publishers bundling transport drums with containers, others ignoring home-healthcare uptake, and a few rolling forward historic ASPs without cross-checking inflation or polymer-price curves. Mordor's model, by contrast, captures full container life-cycle scope, aligns ASPs to resin indices, and is refreshed annually.
Benchmark comparison
| Market Size | Anonymized source | Primary gap driver |
|---|---|---|
| USD 2.15 B (2025) | Mordor Intelligence | |
| USD 2.28 B (2025) | Global Consultancy A | Excludes home-care and veterinary demand; older ASP benchmarks |
| USD 2.91 B (2025) | Research Publisher B | Combines bulk transport drums with point-of-use containers; limited primary validation |
Differences show that scope breadth, price refresh cadence, and validation depth drive sizeable swings. Mordor's disciplined mix of granular regulatory data, real-world ASP discovery, and annual re-benchmarking delivers a balanced, transparent baseline that decision-makers can rely on.


Key Questions Answered in the Report
What is the current size of the medical waste containers market?
The Medical Waste Containers Market stands at USD 2.32 billion in 2026 and is projected to climb to USD 3.44 billion by 2031.
Which region leads revenue in 2025?
North America holds 40.35% of global revenue in 2025, driven by mature compliance rules and the largest transport network.
Which product category grows fastest?
Smart and IoT-enabled containers record an 11.09% CAGR through 2031 as hospitals adopt real-time monitoring.
How significant is oncology waste to future demand?
Cytotoxic and chemotherapy containers grow at 8.78% CAGR, reflecting rising cancer treatments and tougher drug disposal laws.
What sustainability gains do reusable systems provide?
Solutions like Daniels Health’s Surgismart cut plastics usage by 33% and reduce sharps injuries by 87%.
How will industry consolidation affect buyers?
Larger integrated haulers offer nationwide pickups and digital tracking, but purchasers may face fewer vendor options and tighter contract terms.
Page last updated on:


