
Medical Vending Machines Market Size and Share
Market Overview
| Study Period | 2020 - 2031 |
|---|---|
| Market Size (2026) | USD 8.21 Billion |
| Market Size (2031) | USD 11.52 Billion |
| Growth Rate (2026 - 2031) | 7.01 % |
| Fastest Growing Market | Asia Pacific |
| Largest Market | North America |
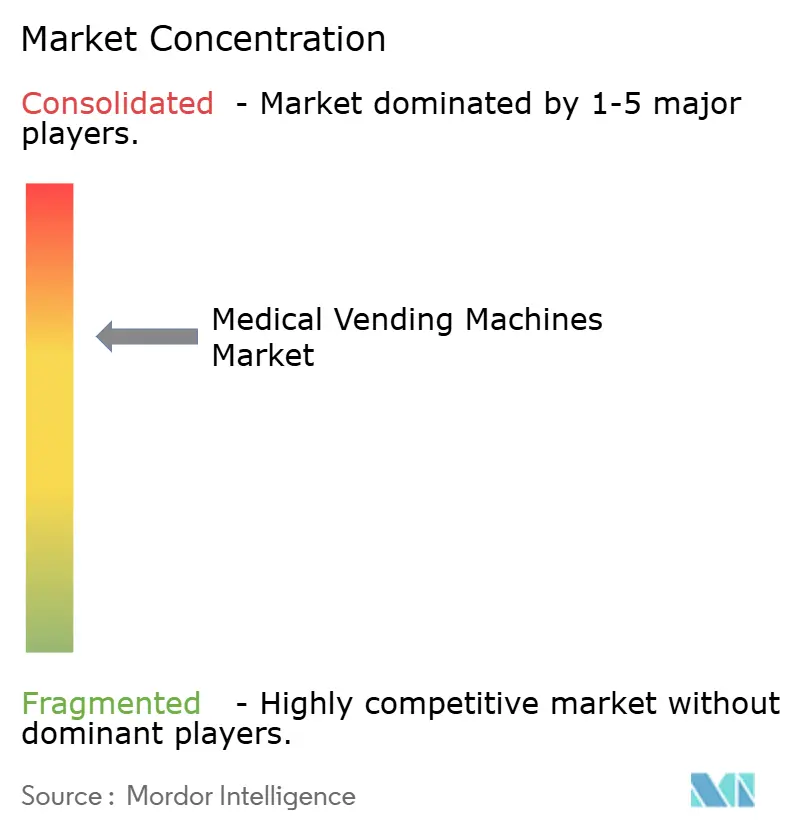
| Market Concentration | Medium |
Major Players *Disclaimer: Major Players sorted in no particular order Image © Mordor Intelligence. Reuse requires attribution under CC BY 4.0. | |
Medical Vending Machines Market Analysis by Mordor Intelligence
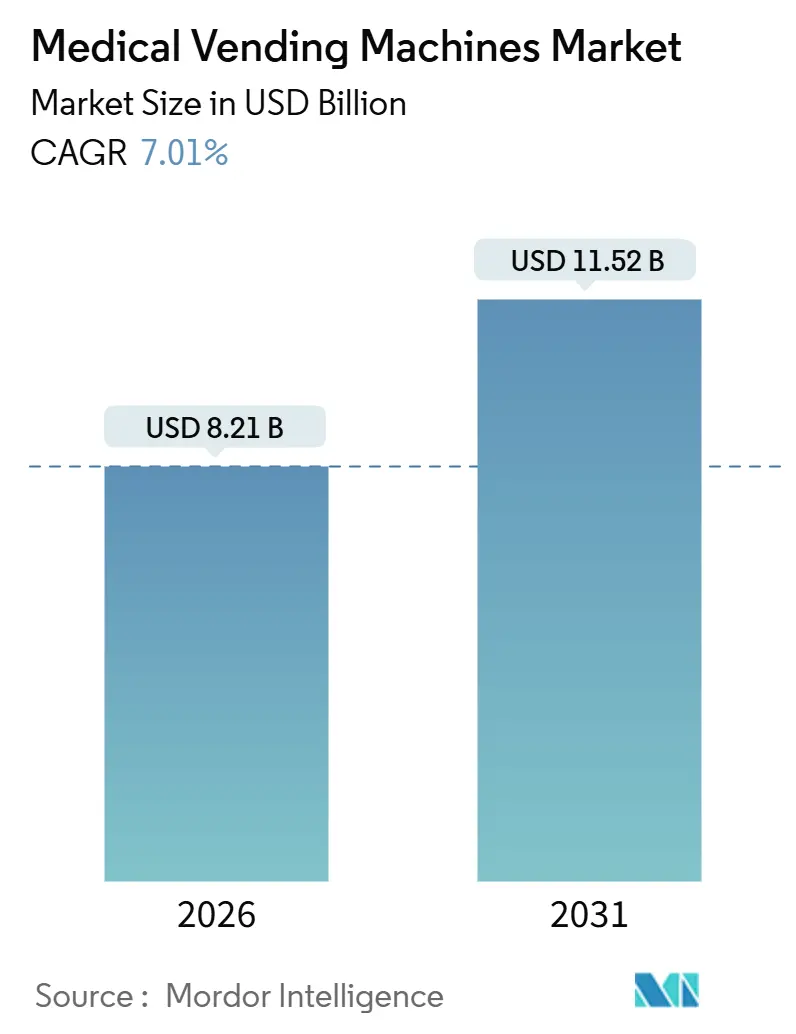
The Medical Vending Machines Market size is estimated at USD 8.21 billion in 2026, and is expected to reach USD 11.52 billion by 2031, at a CAGR of 7.01% during the forecast period (2026-2031).
Across hospitals, clinics, and public venues, automated dispensing is replacing manual pharmacy counters, lowering medication-error rates, shrinking inventory losses, and extending access after traditional hours, thus accelerating the medical vending machines market trajectory. Growing adoption of cloud-connected cabinets that feed real-time data into hospital information systems, coupled with upgrades to temperature-controlled units for vaccines, keeps demand resilient. Competitive activity centers on service contracts and interoperability, while regulatory clarity in the United States and expanding telepharmacy statutes in Asia-Pacific open fresh opportunities. Counterpressure comes from cybersecurity threats and fragmented device approvals that slow cross-border rollouts.
Key Report Takeaways
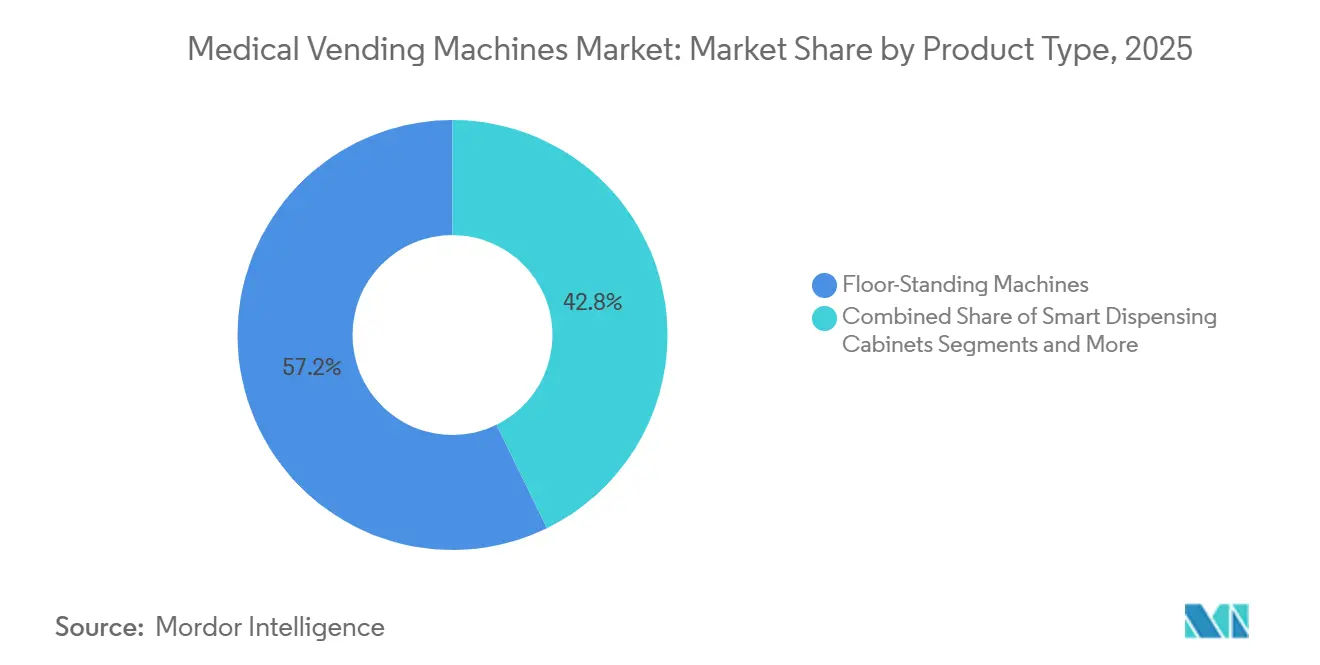
- By product type, floor-standing machines held 57.24% revenue share in 2025, while countertop and benchtop units are projected to grow at an 11.43% CAGR through 2031.
- By medication class, prescription drugs commanded 44.63% of 2025 revenue; vaccines and other cold-chain drugs are expected to advance at a 10.32% CAGR to 2031.
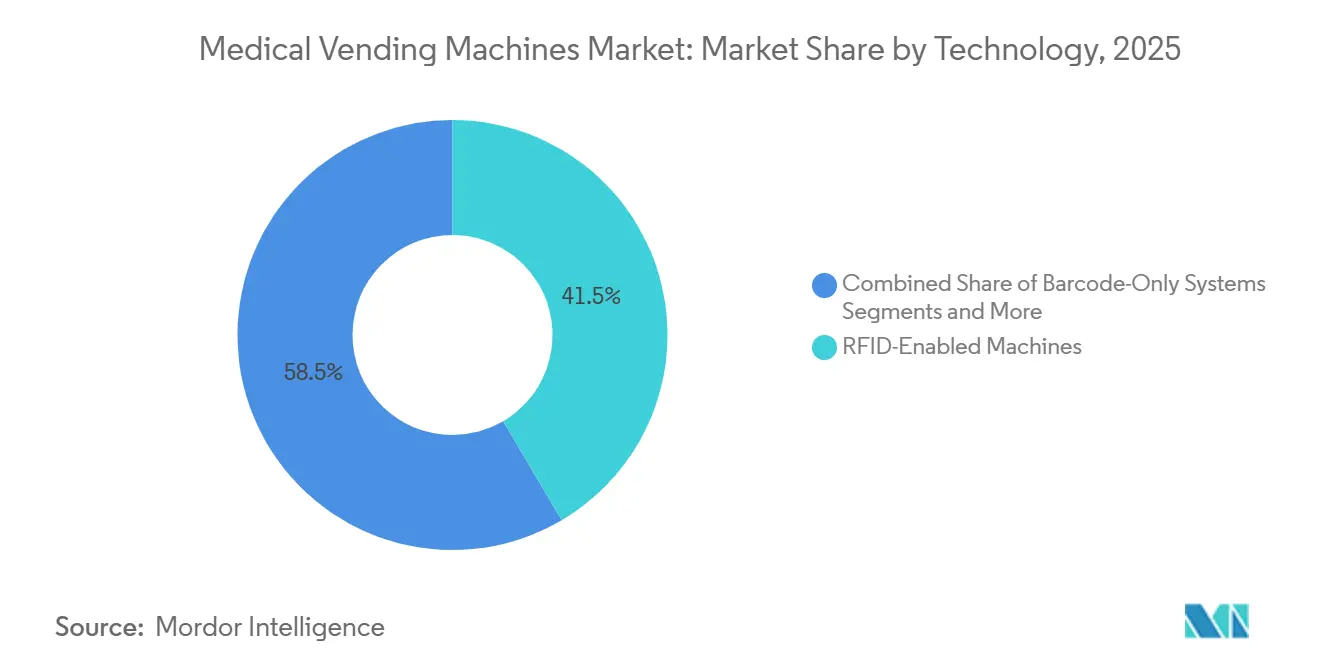
- By technology, RFID-enabled cabinets accounted for 41.52% of the medical vending machines market share in 2025, whereas AI vision-based systems are forecast to register an 11.89% CAGR through 2031.
- By end user, hospitals and specialty clinics contributed 44.61% of 2025 revenue, while workplace and corporate clinics are on track for a 9.63% CAGR through 2031.
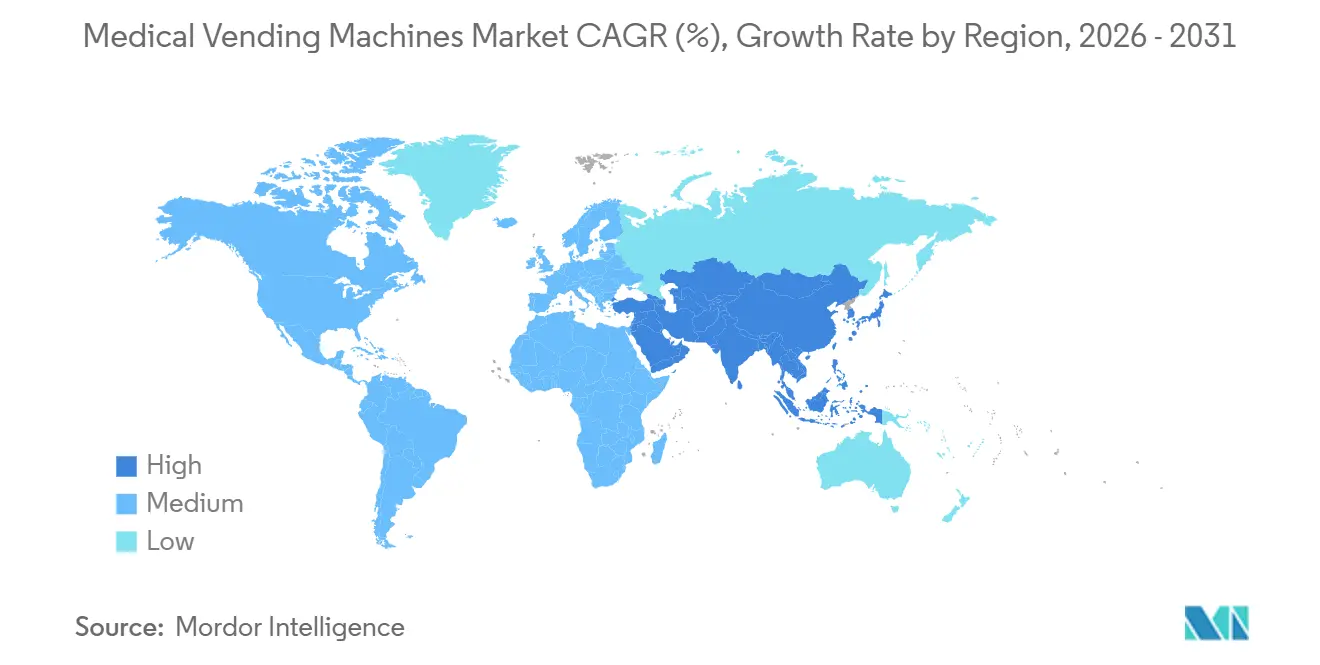
- By geography, North America led with 33.11% global revenue in 2025; Asia-Pacific is poised to expand at a 10.20% CAGR over the same forecast window.
Note: Market size and forecast figures in this report are generated using Mordor Intelligence’s proprietary estimation framework, updated with the latest available data and insights as of January 2026.
Market Trends and Insights
Drivers Impact Analysis of Medical Vending Machines Market*
| Driver | (~) % Impact on CAGR Forecast | Geographic Relevance | Impact Timeline |
|---|---|---|---|
| Growing dependency on prescription medicines in remote & rural areas | 1.2% | Global, with concentration in rural US, India, sub-Saharan Africa | Medium term (2-4 years) |
| Demand for real-time inventory visibility & shrinkage control | 1.4% | North America & EU, early adoption in urban APAC hospitals | Short term (≤ 2 years) |
| Rising chronic-disease burden driving 24/7 medication access | 1.6% | Global, acute in aging economies (Japan, Germany, US) | Long term (≥ 4 years) |
| Integration with tele-pharmacy & e-prescription platforms | 1.1% | North America, Australia, select EU markets with digital-health mandates | Medium term (2-4 years) |
| Blockchain-enabled anti-counterfeit dispensing authentication | 0.5% | APAC core (China, India), spill-over to MEA | Long term (≥ 4 years) |
| Hospital micro-fulfilment for PPE & consumables | 0.9% | Global, sustained post-pandemic in North America & EU | Short term (≤ 2 years) |
| Source: Mordor Intelligence | |||
Growing Dependency on Prescription Medicines in Remote & Rural Areas
Pharmacy deserts leave patients in rural districts traveling 30 miles or more for refills, a gap that fuels demand in the medical vending machines market. Community centers, fire stations, and convenience stores host 24/7 machines that dispense chronic-disease drugs, lowering travel costs and improving adherence. Los Angeles County’s 2025 rollout of free units stocked with naloxone and COVID-19 tests illustrates how municipalities leverage unattended cabinets to close public-health gaps.[1]Los Angeles County Department of Public Health, “Public Health Introduces Community Health Stations to Provide Lifesaving Products,” Los Angeles County, lacounty.gov In India, solar-powered dispensers piloted under the National Health Mission pair with telemedicine kiosks, helping village clinics avoid over-stocking slow-moving SKUs. Such deployments demonstrate the medical vending machines market potential when infrastructure and remote verification converge.
Demand for Real-Time Inventory Visibility & Shrinkage Control
Unaccounted inventory costs U.S. hospitals USD 4.5 billion annually, a burden magnified by opioid diversion penalties. RFID cabinets with biometric locks have cut unexplained losses by up to 77% in long-term-care settings, according to a 2024 BD study. Cloud dashboards surface anomalies—such as withdrawals outside a clinician’s shift—and trigger compliance reviews before diversion escalates. New York City Health + Hospitals unified cabinet data across 11 facilities in 2024, trimming duplicate purchase orders and freeing working capital. These gains reinforce purchasing decisions, strengthening the medical vending machines market outlook among cost-pressured providers.
Rising Chronic-Disease Burden Driving 24/7 Medication Access
Non-communicable diseases cause 41 million deaths yearly, 74% of the global total. Six in ten U.S. adults have at least one chronic condition, pushing hospitals toward vending solutions that cut after-hours refill delays.[2]Centers for Disease Control and Prevention, “About Chronic Diseases,” Centers for Disease Control and Prevention, cdc.gov Machines placed in lobbies, senior-living centers, and retail pharmacies add off-clock convenience and help reduce readmissions under value-based care contracts. Japan, where 28.6% of residents are 65-plus, installs wall units in train stations so older adults can collect pre-packed medicines without queueing. This continuous-access imperative supports sustained growth across the medical vending machines market.
Integration with Tele-Pharmacy & E-Prescription Platforms
By 2025, 28 U.S. states had legalized telepharmacy models that let remote pharmacists verify orders while the machine dispenses on-site.[3]Michael A. Dowell, “The Evolving Telepharmacy Dispensing Landscape,” U.S. Pharmacist, uspharmacist.com MedAvail’s kiosk embeds high-definition video, satisfying counseling mandates and shrinking wait times. E-prescription uptake is strong; 90% of U.S. ambulatory scripts travel electronically, yet discharge orders still rely on fax in many hospitals, limiting fully unattended dispensing. Australia’s My Health Record links scripts directly to government smart cards, letting machines identify patients and release refills autonomously. Better digital hand-offs will broaden the use cases for medical vending machines in outpatient and rural environments.
Restraints Impact Analysis of Medical Vending Machines Market*
| Restraint | (~) % Impact on CAGR Forecast | Geographic Relevance | Impact Timeline |
|---|---|---|---|
| Cyber-security & physical misuse risks | -0.8% | Global, acute in North America & EU with high digitization | Short term (≤ 2 years) |
| Complex multi-country regulatory approvals | -0.6% | Global, most severe in APAC & MEA with fragmented frameworks | Medium term (2-4 years) |
| High service, refill & calibration costs in low-volume sites | -0.5% | Rural North America, sub-Saharan Africa, remote APAC | Long term (≥ 4 years) |
| Consumer trust gap around machine-dispensed medicines | -0.4% | APAC & MEA, legacy markets with pharmacist-centric models | Medium term (2-4 years) |
| Source: Mordor Intelligence | |||
Cyber-Security & Physical Misuse Risks
Healthcare ransomware attacks spiked in 2024; the Change Healthcare breach alone imposed USD 2.3 billion to USD 2.5 billion in remediation costs. Connected cabinets inherit these vulnerabilities, exposing dose settings and access logs to hackers. Ascension Health’s May 2024 cyberattack forced 140 hospitals back to paper workflows, delaying elective surgeries for weeks. Physical tampering—such as stolen fingerprints or crowbar attacks—adds another risk layer. Vendors now promote air-gapped networks, multifactor log-ins, and tamper seals, yet rising threat vectors still temper near-term momentum in the medical vending machines market.
Complex Multi-Country Regulatory Approvals
The U.S. Food and Drug Administration treats automated cabinets as Class II devices that need 510(k) clearance, while Europe delegates oversight to each member state, creating divergent compliance checklists. China’s National Medical Products Administration adds domestic trials and plant inspections that stretch 18–24 months. Emerging markets often lack clear statutes, leaving importers uncertain which ministry to approach. These hurdles extend launch cycles and inflate legal costs, slowing cross-border scale-up within the medical vending machines market.
*Our forecasts treat driver/restraint impacts as directional, not additive. The impact forecasts reflect baseline growth, mix effects, and variable interactions.
Medical Vending Machines Market Segment Analysis
By Product Type:
Floor-Standing Units Dominate, Countertop Solutions ScaleFloor-standing machines captured 57.24% revenue in 2025, reflecting hospitals’ need for 200-plus SKU capacity and integration with pneumatic tubes that cut nurse walk-time. Their footprint anchors the medical vending machines market size in high-acuity settings. Countertop and benchtop models, forecast to post an 11.43% CAGR to 2031, appeal to ambulatory centers, urgent-care clinics, and workplace health rooms that face tight real-estate budgets. Wall-mounted and compact units address EMS vehicles and offshore rigs where mobility trumps inventory depth. Smart dispensing cabinets, while pricey, deliver rapid payback by reducing shrinkage and labor.
Countertop machines are edging out traditional pharmacy counters in drugstores as remote pharmacists verify scripts while the drawer dispenses, freeing staff for counseling. Wall-mounted units in emergency departments provide immediate naloxone or emergency contraception access during overnight shifts. AI vision sensors identify pill shape and color, flagging errors before they reach patients. These evolutions keep the medical vending machines market vibrant across facility types.



By Medication Class:
Prescription Drugs Lead, Vaccines Gain SpeedPrescription drugs held 44.63% value share in 2025, spanning maintenance therapies and controlled substances that demand audit trails. Over-the-counter items grow steadily in transport hubs and campuses. PPE and supplies stabilized at higher baselines post-pandemic as hospitals maintain surge stockpiles. Vaccines and cold-chain drugs, expected to grow 10.32% annually to 2031, require refrigerated cabinets fitted with backup power and continuous logging, expanding the medical vending machines market size in immunization programs.
Cold-chain units cost 40%–60% more than ambient models yet enable rural clinics to administer shots on-site, boosting revenues and coverage. Prescription-drug vending faces stricter oversight; several U.S. states still mandate live pharmacist review before dispensing narcotics. OTC kiosks operate under retail statutes, opening placement in hotels and airports. PPE cabinets in corridors cut manual checks and automate orders, underscoring the medical vending machines market efficiency benefits.
By Technology:
RFID Holds Lead, AI Vision AcceleratesRFID machines controlled 41.52% share in 2025, offering touchless package tracking that updates electronic records without barcode scans. Barcode-only systems remain in budget-constrained facilities but slow workflows. IoT connectivity unlocks predictive analytics, spotting seasonal spikes and optimizing par levels. AI vision dispensing, forecast to expand 11.89% per year to 2031, verifies pill imprint codes, catching errors RFID tags miss. However, regulatory guidance on computer vision remains sparse, requiring hybrid RFID-vision workflows for high-risk drugs, a nuance shaping technology decisions in the medical vending machines market.
Cloud platforms let technicians troubleshoot remotely, slashing downtime. Yet vision algorithms struggle with look-alike generics, prompting ongoing refinement. Hospitals weigh capital outlays against long-term safety and labor savings, a dynamic that fuels iterative innovation across the medical vending machines market.
By End User:
Hospitals Command Spend, Workplace Clinics ClimbHospitals and specialty clinics represented 44.61% of demand in 2025, driven by Joint Commission standards and malpractice-avoidance imperatives. Retail pharmacies place kiosks in lobbies for after-hours pickups, blocking mail-order leakage. Workplace clinics are rising at a 9.63% CAGR as employers deploy machines that dispense diabetes and hypertension refills on site, cutting absenteeism. Transport hubs stock OTC units for travelers seeking quick relief, diversifying venue mix in the medical vending machines market.
Rural centers face capital and connectivity hurdles; solar-powered machines with satellite links soften the blow but still incur elevated service costs. Retail chains benefit from extended hours without hiring night staff, yet some states bar unattended controlled-substance dispensing. Workplace clinics serve predictable populations, enabling tight inventory optimization. Cashless and biometric payments in airports and stadiums streamline turnover, keeping the medical vending machines market aligned with consumer convenience trends.
Geography Analysis
North America Medical Vending Machines Market
North America held 33.11% revenue share in 2025, anchored by 86.1% U.S. hospital penetration of automated cabinets. Mature EHR integration lets machines verify allergies and log doses automatically. NYC Health + Hospitals’ 2024 rollout across 11 facilities underscores public-sector momentum. Regulatory clarity via the FDA’s 510(k) pathway sustains investment, reinforcing the medical vending machines market foothold.
Europe Medical Vending Machines Market
Europe sits second, with Germany, France, and the U.K. leading. Fragmented oversight—some states ban unattended prescription vending—creates uneven uptake. Spain and Italy push telepharmacy to serve aging rural areas, installing compact units in village posts. GDPR compliance adds encryption and consent requirements, influencing vendor design choices in the regional medical vending machines market.
APAC Medical Vending Machines Market
Asia-Pacific is the growth engine, forecast at 10.20% CAGR to 2031. China’s 2026 blockchain traceability mandate drives cabinet upgrades. Japan installs wall units in train stations for elderly convenience, while India pilots solar-powered dispensers tied to telemedicine in Uttar Pradesh and Bihar. Australia links scripts to smart cards via My Health Record, enabling unattended refills. South Korea’s digital infrastructure supports IoT dashboards that optimize par levels across multi-hospital systems, collectively propelling the medical vending machines market forward.
MEA and South America Medical Vending Machines Market
Middle East & Africa and South America remain smaller yet active. GCC smart-hospital projects include automated dispensing as a pillar. Brazil’s 2024 rule change allowed cabinets in pharmacies under pharmacist oversight, opening new lanes for vendors. Argentina’s pilots in Buenos Aires and Córdoba test viability despite patchy broadband and electronics tariffs, signaling incremental room for the medical vending machines market to expand.

Regulatory Landscape
Regulation for medical vending machines spans medical-device controls, pharmacy practice rules, and, for OTC-only units in public venues, consumer labeling requirements. In the United States, automated dispensing cabinets and related automated drug distribution devices typically fall under U.S. Food and Drug Administration oversight as Class II devices using the 510(k) pathway. FDA-recognized consensus standards such as IEC 60601-1 (Edition 3.2) are used as safety anchors for medical electrical equipment. State Boards of Pharmacy also regulate how and where automated systems may dispense medications, with requirements focused on access security, audit trails, and pharmacist supervision.
At the operational level, state rules commonly require written procedures, routine inspections and accuracy testing, and strict inventory accountability (expiration dating, controlled access, discrepancy resolution). Ohio Administrative Code 4729:5-3-17, for example, outlines automated pharmacy system expectations, including accuracy and inspection controls. Pennsylvania and Minnesota provide frameworks for automated medication and automated drug distribution systems that emphasize security and recordkeeping. In Europe, practice guidance such as EDQM automated dose dispensing guidelines supports harmonization in pharmacy automation, but deployment still varies by country and setting. This fragmentation continues to shape cross-border rollout plans and validation burdens for vendors and provider networks.
Value Chain Analysis
The value chain starts with component and subsystem suppliers (refrigeration and temperature monitoring for cold-chain units, locks and biometrics, RFID or barcode readers, cameras for vision systems, and industrial PCs). It then moves to machine OEMs and software providers that deliver the cabinet or kiosk, along with cloud management, analytics, and interfaces to hospital information systems and pharmacy platforms. Distribution and fulfillment commonly involve healthcare distributors and channel partners that already serve hospitals and pharmacies, complemented by systems integrators handling EHR and pharmacy connectivity, onsite commissioning, cybersecurity hardening, and validation documentation. Day-to-day operations are service-led, with preventive maintenance, calibration (including temperature logging), replenishment workflows, and 24/7 break-fix support feeding into total cost of ownership.
Downstream, healthcare providers and pharmacy operators manage formulary selection, clinical governance, and compliance processes, while regulators and accrediting bodies shape auditability and diversion controls, including Joint Commission-aligned medication management practices in hospitals. Channel activity also shows how distribution partnerships can expand reach for specialized configurations. In June 2026, TempraMed expanded a strategic partnership with McKesson Medical-Surgical to broaden North American distribution for temperature-controlled medication solutions, supporting cold-chain vending and cabinet use cases where monitoring and handling are decisive. Provider-facing software and stewardship layers increasingly sit inside the chain as well, as shown by InStockRx partnering with Tanner Health in June 2026 to integrate medication visibility and waste-reduction workflows with automated dispensing cabinet environments and link dispensing endpoints to enterprise supply chain decisions.
Competitive Landscape
The medical vending machines market is moderately concentrated. Becton Dickinson, Omnicell, and Capsa Healthcare together control roughly half global revenue through entrenched service contracts and deep EHR integration. BD’s Pyxis line scored 84.6 in KLAS 2025 rankings, reflecting uptime and workflow fit. Omnicell posted USD 1.14 billion sales in 2024 across 40 countries, pitching cloud cabinets that sync with enterprise resource planning suites.
Niche entrants chase white-space. InstyMeds offers retail kiosks that dispense prescriptions in under a minute. MedAvail, now part of Tabula Rasa HealthCare, embeds video consults for underserved neighborhoods. Disruptors emphasize AI vision and blockchain verification, though regulatory ambiguity slows broad uptake. Patent filings show BD focusing on biometric locks, while Omnicell invests in demand-forecast algorithms.
Service depth is a key differentiator; hospitals favor 24-hour technical support and regional parts depots. Vendors versed in 510(k), CE, and NMPA clearances enjoy multiyear leads. Total cost of ownership, not sticker price, steers decisions—maintenance, software upgrades, and integration complexity weigh heavily. Together, these factors shape competitive dynamics and sustain innovation across the medical vending machines market.
Medical Vending Machines Industry Leaders
Becton, Dickinson and Company
Omnicell Inc.
Capsa Healthcare
InstyMeds Corporation
ScriptPro LLC
- *Disclaimer: Major Players sorted in no particular order
Medical Vending Machines Market Companies Covered in this Report
- Advantage Vending & Distribution
- Asteres Inc.
- Beckton Dickinson
- Capsa Healthcare
- CVS Health
- Evoca Group
- InstyMeds Corporation
- Magex LLC
- MedAvail Holdings Inc.
- Omnicell
- Parata Systems
- Pharmashop24
- RXAutomated Solutions
- ScriptPro
- Shanghai Tongsan Vending
- SuZhou Ruiling Medical
- Tabula Rasa HealthCare (DosePak)
- Talyst Systems LLC
- Xenco Medical
- Yuyama Co., Ltd.

Market Opportunities and Future Outlook
Opportunities cluster around three visible whitespace areas: (1) extending secure, governed access beyond inpatient pharmacy windows into emergency departments, outpatient sites, and community locations where after-hours availability is a recurring constraint; (2) upgrading installed bases toward connected, auditable workflows that address diversion risk and shrinkage; and (3) expanding cold-chain capable dispensing for vaccines and other temperature-sensitive therapies that require continuous logging and backup power. Provider pain points support these use cases. The market context notes that U.S. hospitals face large unaccounted inventory costs, and connected cabinets increasingly feed real-time data into hospital information systems to reduce losses and improve compliance monitoring.
A second opportunity is shifting automation from a labor-saving device into a measurable safety and throughput lever, strengthening procurement justification and refresh cycles. Evidence from a 2026 systematic review covering hospital pharmacy automation across G20 countries reports large standardized mean differences for reduced medication administration time (SMD -4.35) and error rates (SMD -3.89), supporting broader adoption of integrated dispensing workflows when aligned with clinical governance. Regulatory and operating models also affect where vendors can scale: U.S. state-level automated system rules, including Nevada NAC 639.718 and Maryland automated medication system regulations, push designs toward pharmacist oversight, inspection-ready audit logs, and patient verification. Programs such as Los Angeles County's 2025 municipal public-health deployments, which stocked naloxone and test kits, also show a pathway for OTC and harm-reduction-oriented units in public venues under defined governance.
Recent Industry Developments in Medical Vending Machines Market
- May 2026: Omnicell announced the Titan XT, a next-generation automated dispensing system integrated with the Omnisphere cloud platform, during its May 22, 2026 Q1 2026 earnings call. The launch connects new cabinet hardware to centralized cloud management, reinforcing interoperability and enterprise-standardization strategies that support multi-site deployments.
- May 2025: Cape Cod Healthcare launched an InstyMeds automated prescription dispensing system at Cape Cod Hospital in Hyannis, Massachusetts, described as the first such system in the Northeast. The installation expands after-hours prescription access directly from a hospital setting, supporting ED and discharge workflows where immediate pickup reduces gaps in therapy initiation.
- May 2025: Los Angeles County deployed free health vending machines across transit hubs and libraries to dispense naloxone, COVID-19 tests, and condoms. This public-sector rollout highlights how municipalities use unattended dispensing to widen access to time-sensitive public-health products in high-footfall locations.


Medical Vending Machines Market Report Scope and Research Methodology
Market Definition and Coverage
This market covers vending and automated cabinet style machines that dispense medical products and supplies, along with the attached software and services needed to operate, stock, and control access in healthcare and community settings.
Scope exclusions: We do not count general snack and beverage vending, or non-medical retail kiosks that are not used to dispense medical items.
Segments Covered in This Report
- By Product Type
- Floor-Standing Machines
- Countertop / Benchtop Machines
- Wall-Mounted / Compact Units
- Smart Dispensing Cabinets
- By Medication Class
- Prescription Drugs
- Over-the-Counter (OTC) Medicines
- PPE & Medical Supplies
- Vaccines & Cold-Chain Drugs
- By Technology
- RFID-Enabled Machines
- Barcode-Only Systems
- IoT / Cloud-Connected Units
- AI Vision-Based Dispensing
- By End User
- Hospitals & Specialty Clinics
- Retail Pharmacies & Drugstores
- Workplace & Corporate Clinics
- Transportation & Public Venues
- Remote & Rural Health Centres
- By Geography
- North America
- United States
- Canada
- Mexico
- Europe
- Germany
- France
- United Kingdom
- Italy
- Spain
- Rest of Europe
- Asia-Pacific
- China
- Japan
- India
- South Korea
- Australia
- Rest of Asia-Pacific
- Middle East & Africa
- GCC
- South Africa
- Rest of Middle East & Africa
- South America
- Brazil
- Argentina
- Rest of South America
- North America
Data Sources, Market Sizing, and Validation
Desk Research
Desk research is used to set the base facts and keep the model aligned with real world healthcare and vending patterns. We use public health and utilization statistics to understand where demand can sit, then map that demand to equipment adoption signals and procurement activity.
Typical inputs come from non-paywalled sources such as the US FDA (device and safety context), the US CDC and similar public health bodies (care settings and utilization trends), the World Health Organization (health system indicators), OECD health statistics, and UN Comtrade (trade flows for relevant equipment categories, where applicable). We also use company annual reports, earnings call transcripts, investor decks, and reputable press releases to anchor product scope and go-to-market narratives. In addition, a paid subscription for company financials and intelligence, plus an import and export shipment level dataset when it is relevant, supports cross checks on revenue exposure and trade direction. These sources are illustrative only, and we also use other public materials to collect, validate, and clarify the data.
Primary Interviews and Surveys
Primary work is used to pressure test assumptions that are hard to confirm from public sources, especially stocking behavior, machine utilization, and pricing and service bundles. We speak with a mix of manufacturers, distributors, hospital supply and pharmacy operations teams, and facility managers across APAC, EMEA, and the Americas, so the final view reflects different buying cycles and use cases.
Distribution of primary research fieldwork respondents
| Company type | Respondent position | Region |
|---|---|---|
| Top tier: 32% | CXOs: 19% | APAC: 43% |
| Mid tier: 46% | Functional/Unit leaders: 37% | EMEA: 30% |
| Smaller Players: 22% | Managers: 44% | Americas: 27% |
Market-Sizing & Forecasting
Sizing starts with a top-down build where healthcare site counts and demand pools are reconstructed by care setting, then translated into machine opportunity using adoption rates and replenishment intensity. Once the demand pool is shaped, value is derived using typical installed base behavior and a pricing structure that separates hardware from recurring software and service where it is billed.
To keep the totals realistic, results are corroborated using selective bottom-up approximations such as sampled average selling prices times expected unit volumes, distributor channel checks, and supplier level revenue sanity checks from public disclosures. Inputs that matter most include the number of hospitals and clinics, the pharmacy and retail dispensing footprint, the share of controlled versus non-controlled items handled through automated dispensing, average restock frequency, and the mix of floor-standing versus benchtop placements. When a variable is missing for a smaller country, we bridge the gap using a peer market proxy based on healthcare spend and facility density, then review the impact before it is kept.
For forecasting, we typically rely on scenario analysis supported by a light multivariate regression on healthcare facility growth, staffing pressure indicators, and automation adoption signals captured in interviews. The forward view is then adjusted where regulations, procurement cycles, or supply chain constraints are expected to change the pace year to year.
Data Validation & Update Cycle
Validation is done in steps so unusual swings are caught early and explained clearly. We compare modeled outputs against independent signals like trade movement direction, procurement activity, and the implied installed base per facility, then check for variances that look too high for the local healthcare footprint.
Before sign-off, the work is reviewed by another analyst, and any large deltas trigger a re-check of key assumptions and, when needed, a follow-up with respondents to confirm the most sensitive variables. The report is refreshed annually, and interim updates are made when material events shift demand, pricing, or supply. Right before delivery, a final analyst pass is completed so clients receive the most current view.
Mordor Intelligence's Medical Vending Machines Report Market Sizing Compared With Other Published Estimates
Published market values for medical vending machines can vary a lot because firms do not always count the same things, and they also pick different base years and forecasting windows. Differences in what is treated as medical vending versus adjacent automated dispensing, and how software and service revenue is handled, tend to create the biggest spread.
Another common gap comes from geography coverage and how prices are converted and normalized across regions, especially when the product mix is shifting toward connected machines with recurring fees. Some estimates lean more aggressive by assuming a faster replacement cycle and higher utilization per machine, while others stay conservative by focusing only on a narrower set of end users. In our work, the scope is kept consistent across regions by separating hardware from recurring components and tying adoption rates to facility counts and restock behavior that are rechecked on refresh, which is a key reason the 2026 value lands higher here than narrower counts used by some sources, including Mordor Intelligence.
Benchmark comparison
| Source | Market Size | Gaps in Research Methodology |
|---|---|---|
| Mordor Intelligence | USD 8.21 B (2026) | |
| Global Consultancy A | USD 1.71 B (2025) | Uses an earlier base year and a narrower definition that appears closer to medicine vending only, which can exclude broader medical supplies and parts of recurring software and service revenue. |
| Industry Publisher B | USD 1.40 B (2023) | Anchors sizing on a smaller demand pool and shorter historical window, and may mix only select product categories with limited treatment of installed base utilization and regional price normalization. |
The comparison shows that most of the spread can be traced back to what is included in the product scope and whether recurring software and services are treated as part of the market. When inputs like facility counts, adoption rates, and restocking intensity are made explicit, the model becomes easier to audit, and the final number is easier to replicate over time.


Key Questions Answered in the Report
What is the forecast size of the medical vending machines market by 2031?
The market is expected to reach USD 11.52 billion by 2031.
Which product configuration leads current deployments?
Floor-standing cabinets account for 57.24% of 2025 revenue.
Which technology segment is growing fastest?
AI vision-based dispensing is set to expand at an 11.89% CAGR through 2031.
Which region shows the highest growth momentum?
Asia-Pacific is projected to grow at a 10.20% CAGR to 2031.
Page last updated on:





