Medical Holographic Display Market Size and Share
Market Overview
| Study Period | 2020 - 2031 |
|---|---|
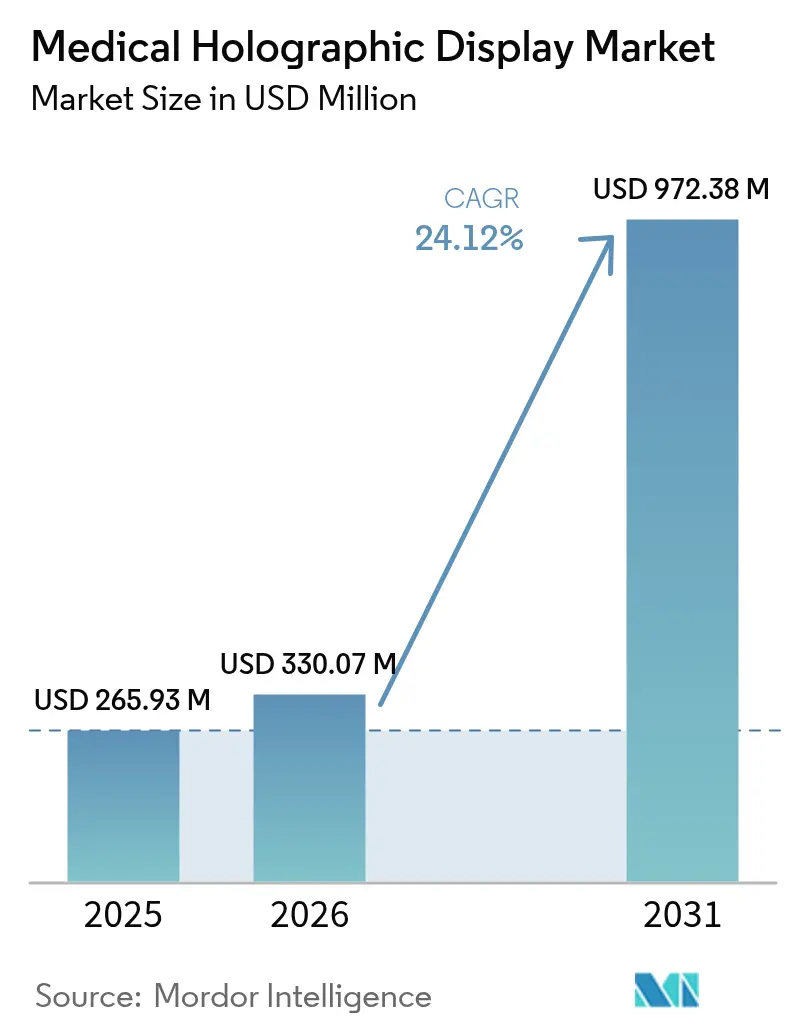
| Market Size (2026) | USD 330.07 Million |
| Market Size (2031) | USD 972.38 Million |
| Growth Rate (2026 - 2031) | 24.12% CAGR |
| Fastest Growing Market | Asia Pacific |
| Largest Market | North America |
| Market Concentration | Medium |
Major Players *Disclaimer: Major Players sorted in no particular order Image © Mordor Intelligence. Reuse requires attribution under CC BY 4.0. | |
Medical Holographic Display Market Analysis by Mordor Intelligence
The medical holographic display market size is expected to grow from USD 265.93 million in 2025 to USD 330.07 million in 2026 and is forecast to reach USD 972.38 million by 2031 at 24.12% CAGR over 2026-2031. Hospitals are embedding real-time 3-D workstations into operating rooms to lower conversion rates from minimally invasive to open surgery, while falling GPU–photonics costs shorten system payback periods. Regulatory momentum under the FDA 510(k) pathway, combined with Japan’s Sakigake fast-track designation, is accelerating clearances for mixed-reality surgical navigation [1]Intuitive Surgical, “da Vinci 5 Surgical System,” intuitive.com. Large imaging OEMs now position holographic visualization as a sustaining innovation that protects installed bases, whereas start-ups focus on algorithmic rendering that differentiates beyond display hardware. Strategic partnerships between display vendors and robotic surgery platform providers signal that holography is migrating from experimental pilots to standard-of-care for image-guided procedures.
Key Report Takeaways
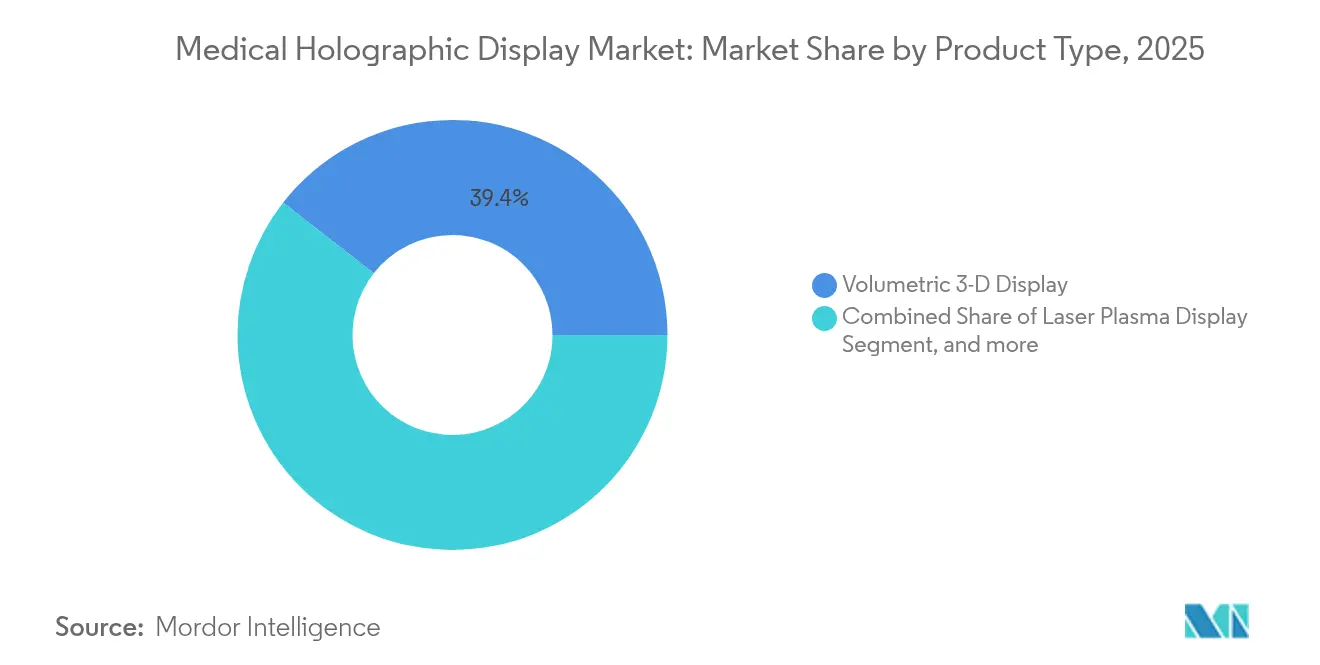
- By product type, volumetric 3-D displays led with 39.43% revenue share in 2025, whereas laser plasma displays are forecast to expand at a 25.10% CAGR through 2031.
- By application, medical imaging and radiology accounted for 43.83% of the medical holographic display market share in 2025, while medical education and training is projected to record the highest 24.87% CAGR to 2031.
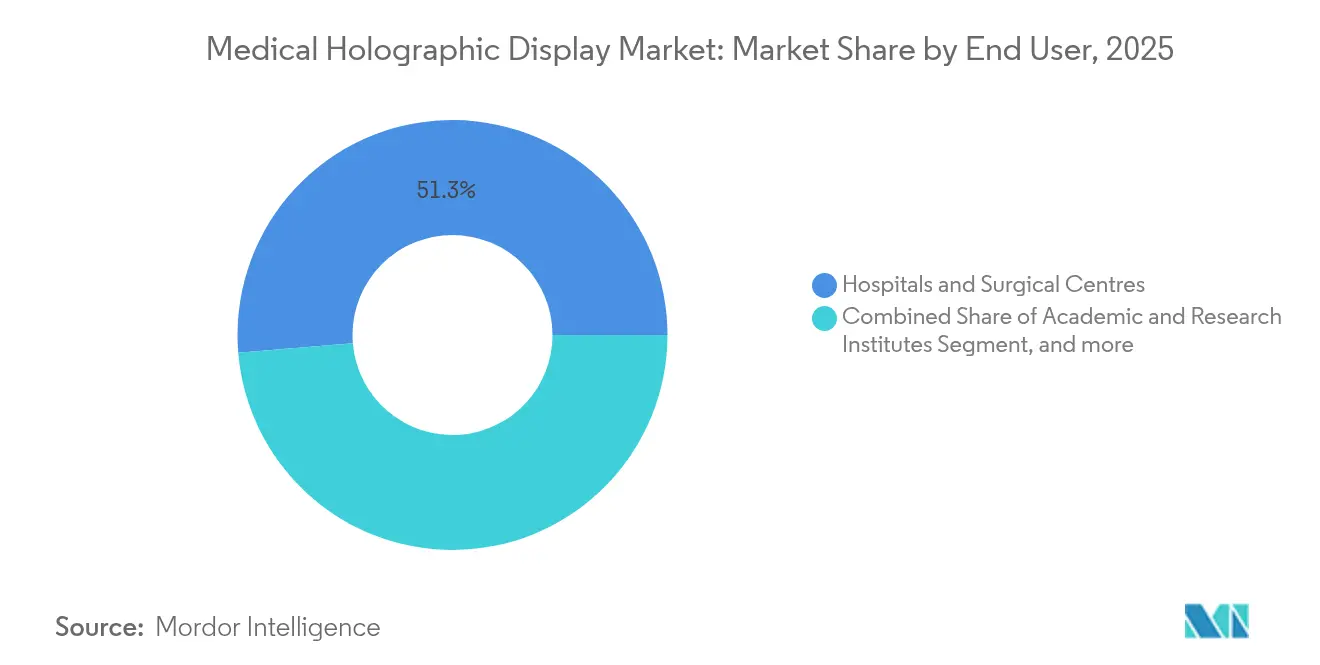
- By end user, hospitals and surgical centers held 51.32% of revenue in 2025; academic and research institutes are poised to grow fastest at a 25.00% CAGR through 2031.
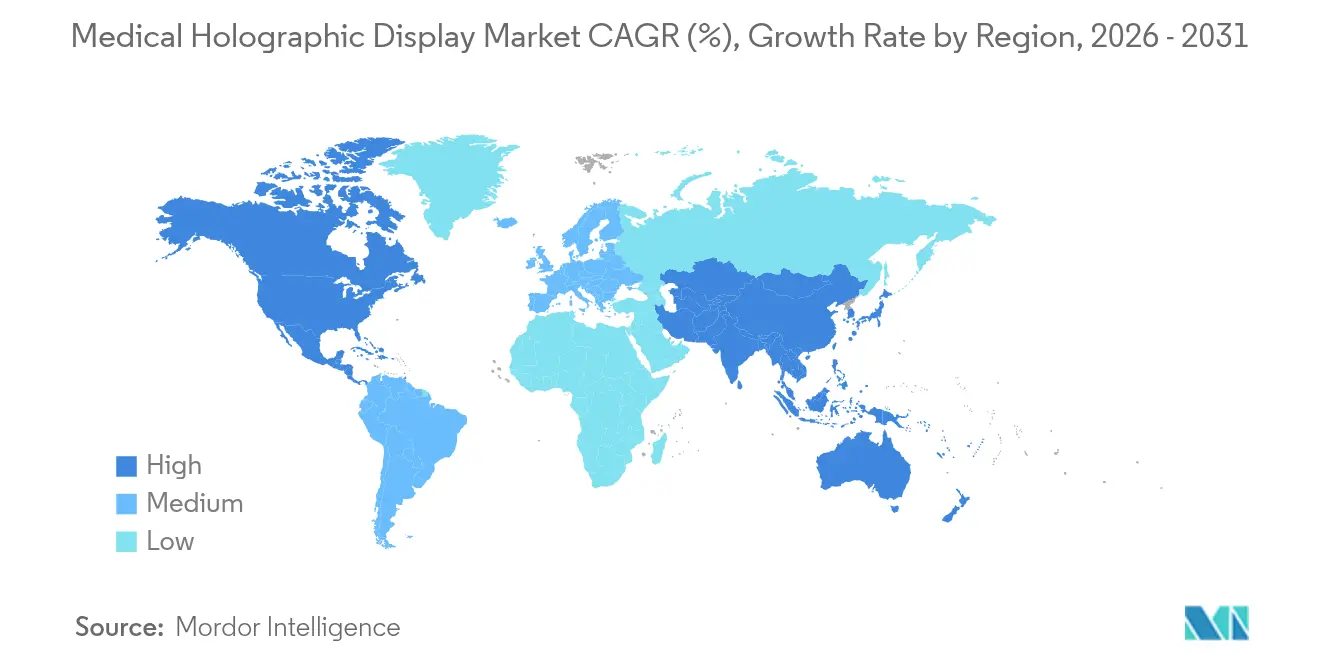
- By geography, North America dominated with 45.15% of the medical holographic display market size in 2025; Asia-Pacific is set to register the strongest 25.19% CAGR during the outlook period.
Note: Market size and forecast figures in this report are generated using Mordor Intelligence’s proprietary estimation framework, updated with the latest available data and insights as of 2026.
Global Medical Holographic Display Market Trends and Insights
Drivers Impact Analysis*
| Driver | (~) % Impact on CAGR Forecast | Geographic Relevance | Impact Timeline |
|---|---|---|---|
| Growing adoption of minimally invasive & image-guided surgery | 6.2% | Global, with North America and Europe leading in robotic surgery penetration | Medium term (2-4 years) |
| Increasing prevalence of chronic diseases requiring advanced 3-D visualisation | 5.8% | Global, with APAC experiencing fastest growth in cancer and cardiovascular disease burden | Long term (≥ 4 years) |
| Rapid advances in light-field & volumetric display components | 4.9% | North America and APAC core, driven by semiconductor innovation hubs | Short term (≤ 2 years) |
| Integration with MR-guided robotic surgery platforms | 3.7% | North America and Europe, with spillover to APAC surgical centers | Medium term (2-4 years) |
| Falling cost of GPU-photonics enabling point-of-care holography | 2.8% | Global, with early adoption in North America and Europe, rapid APAC uptake | Medium term (2-4 years) |
| Surge in medical-metaverse R&D funding by pharma OEMs | 2.3% | North America and Europe, with emerging activity in China and Japan | Long term (≥ 4 years) |
| Source: Mordor Intelligence | |||
Growing Adoption of Minimally Invasive & Image-Guided Surgery
Minimally invasive surgery volumes are expanding at 16.8% CAGR, yet conversion to open procedures persists when 2-D monitors obscure depth cues. Robot-assisted systems now achieve up to 99.7% pedicle-screw accuracy, greatly surpassing conventional fluoroscopy. GE Healthcare’s OmnifyXR overlay, deployed in Minneapolis in June 2024, lets interventional radiologists view catheter trajectories in native 3-D without switching workstations. The da Vinci 5 platform integrates holographic guidance as a built-in feature, illustrating how OEMs perceive immersive visualization as a competitive moat. HoloCare’s roll-out in U.K. and Norwegian university hospitals cut alignment time by 74%, translating into shorter anesthesia exposure and higher operating-room throughput. [2]HoloCare, “Holographic Surgical Planning Platform,” holocare.com
Increasing Prevalence of Chronic Diseases Requiring Advanced 3-D Visualization
The WHO recorded 20 million new cancer diagnoses in 2024, with a rise to 35 million expected by 2050. [3]World Health Organization, “Global Cancer Statistics 2024,” who.int Oncology and cardiology now depend on volumetric imaging modalities whose depth complexity overwhelms flat-panel displays. Holography reduces radiation-therapy contouring errors by up to 20%, improving organ-at-risk sparing. In a laparoscopic ablation study, Apple Vision Pro integration lifted procedural success from 42.5% to 90%. Pharmaceutical researchers visualize molecular binding pockets in full 3-D, accelerating lead-compound identification relative to 2-D modeling workflows.
Rapid Advances in Light-Field & Volumetric Display Components
Leia Inc.’s acquisition of Dimenco and patents from Philips consolidated more than 2,000 light-field assets that now enable glasses-free 3-D displays free of the accommodation-convergence conflict. Mini-LED backlights coupled with micro-LCD panels doubled angular resolution while halving power draw, addressing two historic barriers to operating-room use. Voxon Photonics’ swept-volume system offers 360-degree collaboration yet remains capped at 30 Hz, limiting real-time instrument tracking. Neural rendering on NVIDIA RTX 6000 Ada GPUs now generates holographic frames in milliseconds, making intraoperative refresh practical.
Integration with MR-Guided Robotic Surgery Platforms
Intuitive Surgical’s da Vinci 5 combines force-feedback telemetry with holographic overlays that fuse live endoscopy with preoperative CT or MRI data, allowing surgeons to “see through” tissue layers. Competing robots such as Hugo, Hinotori, and Enos embed similar visualization, suggesting that MR guidance will become table stakes. HoloSurge’s Horizon Europe grant funds a vendor-agnostic navigator compatible with multiple robotic brands, signaling a move toward interoperability standards. DICOM Supplement 166 adoption will decide whether displays become commoditized peripherals or remain proprietary.
Restraints Impact Analysis*
| Restraint | (~) % Impact on CAGR Forecast | Geographic Relevance | Impact Timeline |
|---|---|---|---|
| High capital & maintenance cost of holographic workstations | -3.4% | Global, with acute impact in cost-sensitive ambulatory surgical centers and emerging markets | Short term (≤ 2 years) |
| Regulatory & data-governance hurdles for 3-D patient data | -2.1% | North America and Europe, driven by HIPAA, GDPR, and FDA software-validation requirements | Medium term (2-4 years) |
| Visual-fatigue and cybersickness limiting continuous clinical use | -1.6% | Global, with higher impact in extended surgical procedures and medical education sessions | Short term (≤ 2 years) |
| Lack of DICOM extensions for holographic datasets | -1.2% | Global, with North America and Europe leading standardization efforts | Medium term (2-4 years) |
| Source: Mordor Intelligence | |||
High Capital & Maintenance Cost of Holographic Workstations
Systems priced between USD 80,000 and USD 250,000 eclipse budgets of ambulatory centers whose operating margins trail hospital averages by 20-30%. Annual maintenance contracts add 12-15%, covering calibration and GPU upgrades. Absence of CPT codes for holography-assisted surgery prevents fee recoupment. Academic hospitals often leverage grants rather than operating cash, a path impractical for 6,000-plus U.S. facilities. Vendors must prove that cutting 10 minutes of OR time (valued at USD 15-30 per minute) yields credible ROI before widespread procurement.
Regulatory & Data-Governance Hurdles for 3-D Patient Data
FDA 510(k) submissions demand clinical validation and cybersecurity assessments that extend clearance timelines up to 18 months. European MDR requires post-market surveillance, stretching compliance costs for start-ups. HIPAA and GDPR complicate off-site GPU rendering, mandating encryption and audit trails that add latency. DICOM Supplement extensions defining voxel density and refresh rates remain in draft, delaying seamless PACS integration.
*Our forecasts treat driver/restraint impacts as directional, not additive. The impact forecasts reflect baseline growth, mix effects, and variable interactions.
Segment Analysis
By Product Type: Laser Plasma Gains Traction Despite Volumetric Dominance
Volumetric 3-D displays held 39.43% of 2025 revenue, reflecting maturity in multi-viewer collaboration. Laser plasma displays, though second in adoption, are forecast for 25.10% CAGR, making them the fastest-growing component of the medical holographic display market. Their screen-less mid-air voxels prevent sterile-field breaches, a decisive benefit for operating rooms. Light-field systems, powered by Leia Inc.’s diffractive backlighting, offer a cost-efficient path using consumer LCD supply chains. The “Others” cluster—digital holographic microscopy and AR headsets—serves pathology and ophthalmology niches.
Thermal dissipation and IEC 60825 eye-safety hurdles cloud laser plasma’s outlook, yet vendors push refresh rates toward 60 Hz to meet surgical tracking demands. Light-field platforms slash component prices 20% per year, but angular resolution still lags volumetric peers. Because FDA clearances hinge on application rather than optics, suppliers iterate hardware without new submissions, accelerating cycle times. Continuous innovation ensures that the medical holographic display market remains product-type agnostic in regulatory eyes while clinical buyers weigh image fidelity and sterility as decisive factors.


By Application: Medical Education Outpaces Radiology Growth
Medical imaging and radiology dominated with 43.83% market share in 2025, underlining radiologists’ need for depth-rich CT angiography and PET-CT fusion views. Medical education and training is slated for a 24.87% CAGR, the fastest within applications, as universities phase out cadaver labs in favor of infinite-repeat holographic simulators. The VR/AR education segment hit USD 3.1 billion in 2024 and is climbing at 20.6% CAGR, a tide lifting premium holographic platforms. Biomedical research, spanning drug discovery to protein-structure analysis, gains traction as pharmaceutical companies deploy holographic workstations, further diversifying revenue.
Stanford and Imperial College embedded holographic anatomy tables into first-year curricula, with 85% of students reporting superior spatial comprehension over atlases. Simulation centers at Cleveland Clinic and Mayo Clinic use mixed-reality mannequins for rehearsal of complex procedures. Pharmaceutical interest surged alongside the broader medical metaverse, driving collaborative virtual labs that compress discovery timelines. Accreditation bodies have yet to mandate holography, yet program directors tout immersive curricula as recruitment differentiators, further propelling the medical holographic display market.
By End User: Academic Institutes Drive Fastest Adoption
Hospitals and surgical centers retained 51.32% revenue share in 2025, reflecting their capital intensity and focus on differentiating service lines. Academic and research institutes are on track for a 25.00% CAGR, supported by NIH and Horizon Europe grants financing platform purchases for translational research. Diagnostic imaging centers remain cautious, hampered by reimbursement uncertainty, while pharmaceutical and biotech firms are the newest entrants, leveraging holography for molecular visualization in drug design.
HoloSurge’s €8.9 million Horizon Europe grant epitomizes the public-funding path academic hospitals follow. Schneider Children’s Medical Center combines RealView Imaging and Philips technologies to study reductions in fluoroscopy dose, demonstrating academia’s role as a proving ground before commercial diffusion. Corporate hospital chains in emerging markets plan phased rollouts contingent on reimbursement code approval, linking end-user diversification directly to payer policy evolution.
Geography Analysis
North America controlled 45.15% of 2025 revenue, propelled by the United States’ dense network of academic medical centers and a mature 510(k) approval pathway. The da Vinci 5 and GE OmnifyXR launches illustrate entrenched OEM dominance in the region. Canada trails, demanding rigorous cost-effectiveness evidence prior to procurement, while Mexico’s private chains pilot holography in oncology centers amid reimbursement gaps.
Asia-Pacific is projected to log the highest 25.19% CAGR, expanding the medical holographic display market size most rapidly through 2031. China’s AI-in-healthcare mandates, Japan’s accelerated Sakigake pathway, and India’s corporate-hospital expansion fuel momentum. Domestic Chinese vendors undercut Western peers by 30-40%, democratizing access. Japan’s Holoeyes platform enjoys PMDA backing and broad university deployment, whereas India’s Apollo and Fortis chains test systems in neurosurgery suites. South Korea and Australia advance through academic pilots, pending insurer reimbursement decisions.
Europe captures mid-tier share, led by Germany, the United Kingdom, and France, where public research funds catalyze adoption. HoloCare’s CE-marked deployments in Leeds and Oslo cut alignment time by 74%, directly answering DRG incentives that reward length-of-stay reductions. The stringent European MDR elongates approvals but ensures safety rigor. Rest-of-World regions—including Latin America, the Middle East, and Africa—remain niche, with uptake in private medical-tourism hospitals and grant-funded academic centers.

Competitive Landscape
The medical holographic display market remains moderately fragmented, with the top five vendors controlling under 35% of global revenue. RealView Imaging and EchoPixel garnered FDA clearances yet have not disclosed shipment volumes, suggesting early-stage adoption concentrated in research hospitals. Leia Inc. plans to transport consumer supply-chain efficiencies into operating rooms, aiming to cut hardware costs by up to 40%. GE Healthcare and Philips treat holography as a sustaining overlay that preserves PACS stickiness, integrating seamlessly with existing workstations rather than selling standalone units.
Start-ups such as Voxon Photonics and Holoxica target biomedical research and education, segments with lower regulatory overhead. Patent filings by Looking Glass Factory and VividQ in computational holography underscore the strategic shift from hardware to software algorithms. White-space opportunities include sub-USD 40,000 point-of-care carts for emergency rooms and tele-consult platforms where remote specialists annotate 3-D reconstructions live. Vendors able to show measurable cuts in procedure time or complication rates will gain reimbursement advocacy, a crucial lever in expanding the medical holographic display market.
Medical Holographic Display Industry Leaders
EON Reality Inc
RealView Imaging Ltd
zSpace, Inc
VividQ Ltd.
Holoxica Limited
- *Disclaimer: Major Players sorted in no particular order

Recent Industry Developments
- March 2025: Korean researchers at Electronics and Telecommunications Research Institute unveiled a breakthrough digital holography processor capable of converting 2D videos into real-time 3D holograms at 4K resolution with 30-millisecond latency, utilizing Field Programmable Gate Array technology and high-bandwidth memory to significantly outperform conventional software-based methods in speed and power efficiency. This development positions Korea as a leader in holographic processing technology with applications across medical imaging and telepresence healthcare delivery.
- January 2025: Swave Photonics, spun off from imec, secured EUR 27.0 (USD 31.1) million in Series A funding and won a CES Innovation Award for its breakthrough holographic chip technology featuring pixels half the wavelength of light, enabling retina-resolution holographic displays for augmented reality and medical applications. The company plans to unveil the first dynamic holographic display systems targeting medical visualization markets.
- July 2024: ImmersiveTouch received FDA clearance for its ImmersiveAR holographic surgical navigation system, enabling 3-D fusion of preoperative imaging with live video for neurosurgery and orthopedics.
- July 2024: HoloCare launched 3D surgical holograms across five hospitals in the UK and Europe with UKCA and CE certification, focusing on complex liver surgeries and enhancing surgeons' spatial understanding through mixed reality and AI-powered platforms. Clinical research conducted with Oslo University Hospital supports the technology's efficacy in improving surgical outcomes.


Research Methodology Framework and Report Scope
Market Definitions and Key Coverage
Our study defines the medical holographic display market as all commercially sold hardware and associated software modules that generate true three-dimensional, glasses-free images from medical imaging or live patient data to aid diagnosis, surgical planning, training, or patient engagement.
Scope Exclusion: Non-medical holographic signage, AR/VR headsets, and 2D digital visualization tools lie outside this assessment.
Segmentation Overview
- By Product Type
- Volumetric 3-D Display
- Light-Field Display
- Laser Plasma Display
- Others
- By Application
- Medical Imaging & Radiology
- Biomedical Research
- Medical Education & Training
- Others
- By End User
- Hospitals & Surgical Centres
- Diagnostic Imaging Centres
- Academic & Research Institutes
- Pharmaceutical & Biotechnology Companies
- By Geography
- North America
- United States
- Canada
- Mexico
- Europe
- Germany
- United Kingdom
- France
- Italy
- Spain
- Rest of Europe
- Asia-Pacific
- China
- Japan
- India
- South Korea
- Australia
- Rest of Asia-Pacific
- Rest of the World
- North America
Detailed Research Methodology and Data Validation
Primary Research
Findings are stress-tested through interviews and short surveys with OR technologists, radiology department heads, med-tech product managers, and procurement leads across North America, Europe, and key Asia-Pacific teaching hospitals. Their insights clarify achievable selling prices, learning-curve driven utilization rates, and regional reimbursement shifts that do not surface in documents alone.
Desk Research
Mordor analysts begin with structured desk work, reviewing open datasets from agencies such as the US FDA (device 510(k) clearances), Eurostat trade codes for display components, NIH and Horizon-EU grant databases that signal installed research capacity, and academic literature indexed on PubMed for adoption metrics. Company 10-Ks, investor decks, and patent families logged on Questel complement these public sources, while D&B Hoovers offers financial breakouts for private innovators. Customs shipment panels and surgical procedure registers help approximate unit flows. The sources listed illustrate the breadth consulted; many additional publications are referenced during data compilation and validation.
Market-Sizing & Forecasting
A top-down reconstruction from production and trade data builds the 2025 demand pool, which is then checked by selective bottom-up roll-ups of supplier shipments and sampled average selling price × volume calculations. Key model variables include (1) annual neurosurgical and cardiac procedure volumes where depth cues matter, (2) worldwide installed base of CT/MRI scanners able to feed 3D data, (3) average ASP progression for 15-32-inch light-field panels, (4) count of new 510(k) holography clearances, (5) biopharma R&D outlay on 3D cell imaging, and (6) first-year adoption rates in medical schools. Multivariate regression links these drivers to market value, while scenario analysis frames upside from faster regulatory approvals. Data gaps in supplier estimates are bridged by midpoint interpolation between confirmed contract sizes and customs declarations.
Data Validation & Update Cycle
Outputs pass a three-layer review: algorithmic variance checks, senior-analyst peer audit, and a final sign-off before release. Models refresh annually; mid-cycle events such as landmark FDA approvals trigger targeted revisions so clients receive an up-to-date baseline.
Why Our Medical Holography Baseline Earns Trust
Published estimates frequently diverge because firms choose different product scopes, currency bases, and refresh cadences. By anchoring on clinical use cases only, aligning FX to IMF averages, and blending expert opinion with transparent datasets, Mordor Intelligence delivers a balanced figure decision-makers can defend.
Benchmark comparison
| Market Size | Anonymized source | Primary gap driver |
|---|---|---|
| USD 2.08 B (2025) | Mordor Intelligence | - |
| USD 1.40 B (2024) | Global Consultancy A | Excludes holography software and educational kits; limited primary validation |
| USD 2.42 B (2024) | Industry Publisher B | Adds digital holography hardware and AR headsets; older FX rates and shorter historic window |
The comparison shows how varying inclusion rules and data refresh practices drive spread. By selecting only clinically deployed holographic displays, validating prices with end users, and updating every twelve months, our baseline remains the most reliable starting point for strategic planning.


Key Questions Answered in the Report
How fast will Asia-Pacific revenue grow for medical holographic displays?
Asia-Pacific revenue is projected to expand at 25.19% CAGR between 2026 and 2031, the fastest rate among regions.
Which application will outpace others in adoption?
Medical education and training will post the strongest 24.87% CAGR as universities switch from cadaver labs to reusable holographic simulators.
What capital budget should a hospital expect for a surgical-grade holographic workstation?
Current systems range from USD 80,000 to USD 250,000, with annual maintenance adding 12.15% of purchase price.
How large is the medical holographic display market expected to become by 2031?
The market is forecast to reach USD 972.38 million by 2031, up from USD 330.07 million in 2026.
Which product type is poised for the highest growth?
Laser plasma displays are forecast to grow at 25.10% CAGR, the fastest among product categories through 2031.
Does any vendor hold a dominant position?
No supplier controls more than 15% of global revenue, keeping competition fragmented and innovation-driven.
Page last updated on:


