Market Overview
| Study Period | 2020 - 2031 |
|---|---|
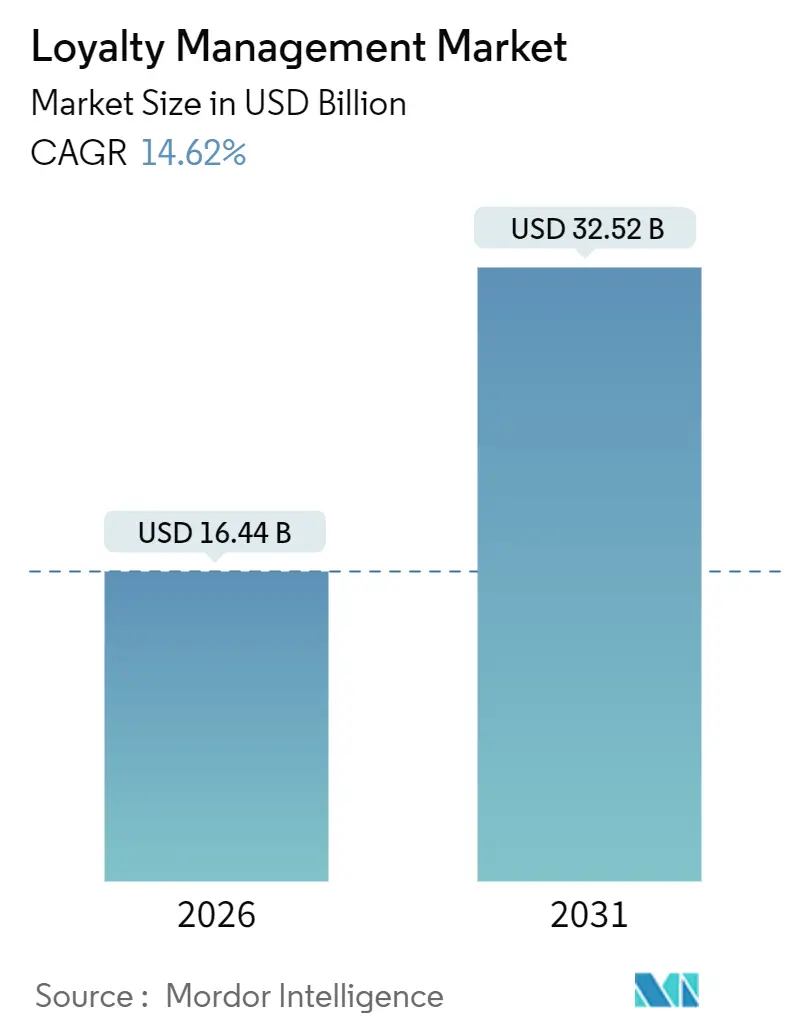
| Market Size (2026) | USD 16.44 Billion |
| Market Size (2031) | USD 32.52 Billion |
| Growth Rate (2026 - 2031) | 14.62% CAGR |
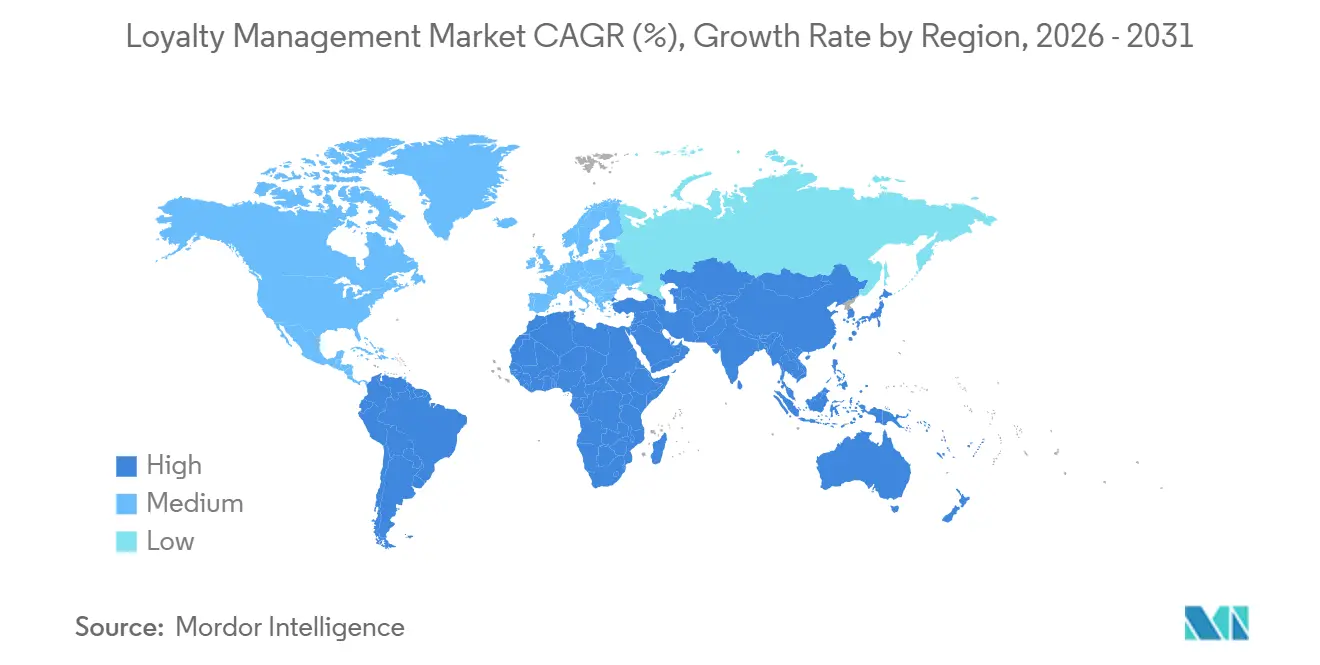
| Fastest Growing Market | Asia Pacific |
| Largest Market | North America |
| Market Concentration | Low |
Major Players *Disclaimer: Major Players sorted in no particular order Image © Mordor Intelligence. Reuse requires attribution under CC BY 4.0. | |
Loyalty Management Market Analysis by Mordor Intelligence
The loyalty management market size stands at USD 16.44 billion in 2026 and is projected to reach USD 32.52 billion by 2031, reflecting a 14.62% CAGR. Heightened customer-acquisition costs, rapid advances in AI-driven personalization, and privacy regulations that elevate the value of first-party data jointly propel this expansion. Adoption is broadening beyond consumer programs as manufacturers and distributors turn loyalty mechanics into a core channel-partner retention tool, while cloud-based API architectures unlock real-time reward and redemption that legacy on-premise stacks cannot match. Competitive pressure is intensifying because hyperscalers embed loyalty modules into wider customer-data platforms, forcing pure-play vendors to differentiate through vertical expertise or ownership of zero-party data touchpoints. Regional momentum favors Asia Pacific, where mobile wallets and QR-code interoperability leapfrog card-based models, signaling that the loyalty management market will increasingly be architected around real-time payment rails rather than post-transaction card statements.
Key Report Takeaways
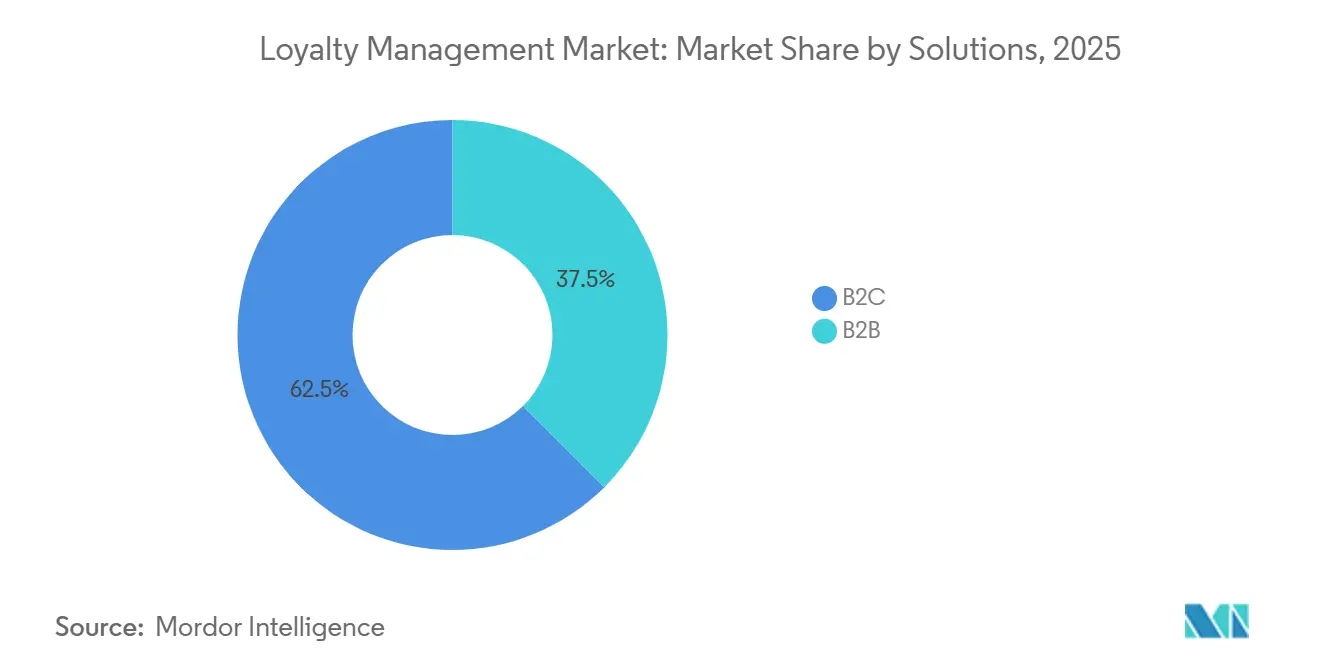
- By solution, B2C programs accounted for 62.46% of the loyalty management market share in 2025, while B2B platforms are advancing at a 17.52% CAGR through 2031.
- By deployment, on-premise systems held 74.74% of the loyalty management market size in 2025, yet cloud services are expanding at a 16.44% CAGR between 2026-2031.
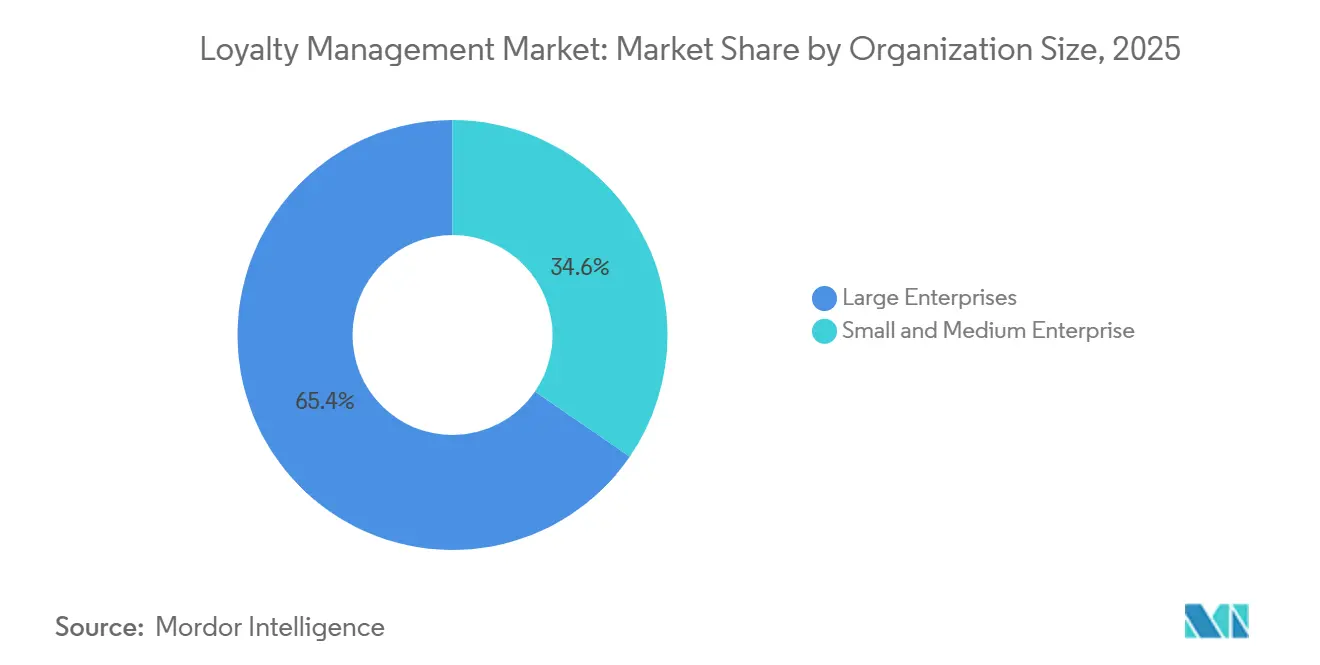
- By organization size, large enterprises commanded 65.42% revenue in 2025, whereas small and medium enterprises record the fastest CAGR at 17.26% through 2031.
- By industry vertical, retail and consumer goods led with 29.96% of 2025 spending, and healthcare is projected to grow at a 15.92% CAGR to 2031.
- By geography, North America represented 38.34% of 2025 revenue, but Asia Pacific is forecast to rise at a 14.88% CAGR over the same horizon.
Note: Market size and forecast figures in this report are generated using Mordor Intelligence’s proprietary estimation framework, updated with the latest available data and insights as of January 2026.
Global Loyalty Management Market Trends and Insights
Drivers Impact Analysis*
| Driver | (~) % Impact on CAGR Forecast | Geographic Relevance | Impact Timeline |
|---|---|---|---|
| Omnichannel Digital Transformation Elevates Retention Economics | +3.2% | Global, early adoption in North America and Western Europe | Medium term (2-4 years) |
| AI-Driven Personalization Engines Boost Program Stickiness and ROI | +2.8% | Global, concentrated in North America, Europe, Asia Pacific urban centers | Short term (≤ 2 years) |
| Escalating Customer-Acquisition Costs in Saturated E-Commerce | +2.5% | North America, Europe, mature Asia Pacific markets | Short term (≤ 2 years) |
| Mobile-First Reward Apps Drive Frequency and Ticket Size | +2.1% | Asia Pacific core, spill-over to Middle East and Africa | Medium term (2-4 years) |
| Zero-Party Data Strategies Strengthen First-Party Insight Advantage | +1.9% | Global, strongest in Europe and North America | Long term (≥ 4 years) |
| ESG-Linked Incentives Influence Gen-Z Brand Choices | +1.5% | Europe, North America, urban Asia Pacific | Long term (≥ 4 years) |
| Source: Mordor Intelligence | |||


Omnichannel Digital Transformation Elevates Retention Economics
Retailers are stitching together point-of-sale, e-commerce, call-center, and mobile-app data so that customers earn and redeem rewards seamlessly, no matter where they transact. Brands that eliminated channel silos captured 3-5% incremental revenue because shoppers no longer abandoned carts when loyalty points failed to appear in real time. Deloitte’s 2024 holiday audit reported USD 12 billion in lost sales from fragmented accrual rules; merchants that fixed the issue lifted repeat-purchase rates by 22% within 90 days. Cloud-native engines ingest event streams from payment terminals, IoT sensors, and social-commerce APIs, enabling personalized offers as the customer moves between devices. The ability to respond within milliseconds converts dormant rewards into behavioral nudges that keep high-value customers inside the brand’s ecosystem. Consequently, omnichannel transformation commands the single largest uplift on the loyalty management market CAGR.
AI-Driven Personalization Engines Boost Program Stickiness and ROI
Generative AI now tailors incentives to weather, inventory, and individual propensity instead of static tiers. Antavo found that 37% of programs used AI in 2024 and 50% plan adoption by 2026, with early movers gaining a 5.2× return on loyalty spend. BCG projects USD 2 trillion in value by 2030 from such predictive engagement, making loyalty the data-collection linchpin for AI-driven customer strategy. Adobe’s 2024 consumer poll showed that 71% expect personalization but only 38% receive it, creating a gap AI-ready vendors can monetize.[1]Adobe Inc., “Personalization in Business: The Basics,” adobe.com Programs that predict churn 60-90 days ahead can intervene with micro-incentives that cost less than reacquisition campaigns, turning loyalty departments from cost centers into revenue generators. This dynamic materially lifts the loyalty management market growth trajectory.
Escalating Customer-Acquisition Costs in Saturated E-Commerce
Shopify benchmarks recorded an 18% year-over-year jump in blended digital advertising costs during 2024, while organic traffic declined 12% as algorithms favored short-form video.[2]Shopify Inc., “Customer Acquisition Cost: The Complete Guide,” shopify.com Retaining a customer costs one-seventh of acquiring one, and loyal shoppers transacted at 2.6× the revenue per visit, per Bain. Brands shifted 31% of 2025 marketing budgets to loyalty initiatives, up from 22% in 2023, because lifetime value soared 18% when retention spend rose 10 points. Direct-to-consumer subscription boxes, meal kits, and consumables lead the pivot, illustrating that loyalty management market investments now offer superior ROI relative to top-of-funnel ads. Higher acquisition costs therefore amplify demand for loyalty platforms.
Mobile-First Reward Apps Drive Frequency and Ticket Size
Smartphone penetration above 85% in Asia Pacific fuels app-based engagement, with consumers using 3.4 loyalty apps weekly. EY’s 2025 study noted that 80% will download a brand app for exclusive benefits, and 75% prefer multi-merchant redemption in one wallet. Mastercard research found that ecosystem partnerships top the strategic agenda for 35% of regional loyalty leaders. Boba Guys’ Solana-based app delivered a 67% visit lift and 65% higher spend within six months, proving that mobile push notifications influence purchase frequency. As payment, geolocation, and gamified tasks converge inside mobile interfaces, the loyalty management market pivots toward always-on engagement rather than episodic campaigns.
Restraints Impact Analysis*
| Restraint | (~) % Impact on CAGR Forecast | Geographic Relevance | Impact Timeline |
|---|---|---|---|
| Data-Privacy and Cross-Border Compliance Complexity | -1.8% | Europe and North America; emerging Asia Pacific regulations | Short term (≤ 2 years) |
| Integration Burden with Legacy POS and CRM Stacks | -1.5% | Global, acute in North America and Europe | Medium term (2-4 years) |
| Loyalty-Program Fatigue among Digital Natives | -1.2% | North America, Europe, urban Asia Pacific | Medium term (2-4 years) |
| Inflation-Driven Reward-Fulfillment Cost Spikes | -1.0% | Global, severe in Europe and emerging markets | Short term (≤ 2 years) |
| Source: Mordor Intelligence | |||
Data-Privacy and Cross-Border Compliance Complexity
GDPR grants European consumers deletion rights, while California’s CCPA adds opt-out requirements, forcing multinational programs to reconcile conflicting consent regimes. Gartner estimates USD 1.2 million annual compliance spend per enterprise, with an extra 30-40% overhead for multi-region loyalty operations. The CFPB’s December 2024 circular warns card issuers that unilateral reward devaluations may violate the Truth in Lending Act, expanding legal exposure to co-branded programs. The new EU-US Data Privacy Framework faces legal challenges, prompting many vendors to localize storage and lose cloud-scale efficiencies.[3]European Commission, “EU-US Data Transfers,” europa.eu Smaller suppliers lacking regional data centers exit cross-border markets, narrowing buyer choice and tempering loyalty management market growth.
Integration Burden with Legacy POS and CRM Stacks
Retailers running on-premise POS hardware from before 2020 confront 12-18 month projects and costs exceeding USD 500,000 to integrate loyalty APIs because proprietary protocols lack REST interfaces. CIO surveys in 2024 ranked integration complexity above budget as the chief barrier to adoption. SAP’s Commerce Cloud integration cuts timelines to eight weeks for users already on its stack, while Salesforce customers benefit from pre-built links between Loyalty Management, Commerce Cloud, and Service Cloud. Brands on alternative systems, however, must fund middleware while competitors accelerate rollouts, delaying time-to-value. The persistence of legacy infrastructure therefore subtracts from the loyalty management market CAGR.
*Our forecasts treat driver/restraint impacts as directional, not additive. The impact forecasts reflect baseline growth, mix effects, and variable interactions.
Segment Analysis
By Solution: B2B Outpaces Consumer Programs
B2C offerings dominated the loyalty management market in 2025, yet B2B platforms are on track for the highest CAGR at 17.52%, underscoring a shift toward channel-partner engagement. Manufacturers deploy tiered incentives that reward distributors for volume, co-marketing, and data sharing, moving beyond simple rebate schemes. These programs embed directly into procurement portals and enterprise-resource-planning workflows, so partners earn benefits as soon as purchase orders are logged. By contrast, consumer programs face saturation; digital natives belong to an average 16.7 schemes but engage with fewer than half, making incremental enrollment less potent. Paid memberships and coalition models are the next frontier for consumer brands, yet they require ecosystem orchestration that many retailers still lack. With higher deal sizes and multiyear contracts, B2B platforms capture outsized loyalty management market revenue per account, reinforcing their growth premium. Over the forecast period, vendors that pre-integrate with configurator and quoting tools are poised to gain loyalty management market share among industrial buyers.
B2C solutions remain essential for brand equity but will lean on gamification and experiential rewards rather than pure discounts to combat fatigue. Deloitte’s November 2024 consumer pulse shows 70% participation in fee-based programs, indicating willingness to pay for exclusivity when benefits are clear. Growth will therefore depend on seamless cross-brand redemption and real-time data feedback loops that deliver individualized motivation. Pure-play consumer vendors that fail to extend into partner, employee, or influencer segments risk ceding wallet share to multipurpose platforms. Consequently, the loyalty management industry must balance consumer breadth with channel depth to sustain broad-based expansion.

By Deployment: Cloud Erodes On-Premise Dominance
On-premise installations delivered almost three-quarters of 2025 revenue, yet cloud offerings are expanding at 16.44% annually, propelled by lower upfront costs and elastic scale. SAP’s 2025 launch embeds loyalty inside Commerce Cloud, Emarsys, and Service Cloud, enabling rule changes without code and real-time point issuance at checkout. Open Loyalty reports deployment cycles shrinking from 18 months to eight weeks because API-first microservices plug directly into web and mobile front ends. For small businesses, subscription fees under USD 500 make enterprise-grade capabilities affordable, collapsing integration barriers that once confined loyalty programs to big brands. Regulated sectors such as banking and healthcare still retain on-premise databases to satisfy data-sovereignty laws, but even they offload analytics to public clouds to tap AI toolkits. Hybrid topologies that keep identity stores on-site while running campaign logic in SaaS form are becoming standard, and they will gradually erode the legacy share of the loyalty management market size.
The durability of on-premise stems from sunk investments and custom integrations tied to older POS and CRM stacks. Migrating to cloud can disrupt operations, so some retailers adopt a phased approach that mirrors data to SaaS engines before switching off legacy apps. Over the forecast window, hyperscaler bundling will accelerate cloud share gains as Salesforce, SAP, Oracle, and IBM cross-sell loyalty to existing CX clients. Vendors unable to offer low-code connectors and regional data residency will lose competitiveness, leading to consolidation or niche specialization. Consequently, cloud deployment serves as a leading indicator of vendor resilience in the loyalty management market.
By Organization Size: SMEs Close the Adoption Gap
Large enterprises accounted for 65.42% of 2025 spend, but SMB uptake is racing ahead at a 17.26% CAGR, reflecting democratization of enterprise features. Platforms like Yotpo bundle loyalty, reviews, SMS marketing, and zero-party data surveys into one dashboard, allowing 3-person e-commerce teams to run sophisticated lifecycle campaigns. Yotpo clients observed a 22% lift in repeat purchases within 90 days, confirming that small budgets can secure big results. SMEs benefit from pre-trained AI models that recommend rewards without data-science staffing, narrowing the personalization gap versus multinationals. However, escalator pricing means monthly fees can climb from USD 500 to USD 5,000 as order volume scales, creating potential vendor lock-in. Open APIs, self-service data exports, and pay-as-you-grow tiers act as safeguards that savvy SMEs now prioritize during vendor selection.
Enterprises maintain leverage through volume discounts and in-house analytics teams that fine-tune segmentation granularity. They exploit loyalty to cross-sell across multiple brands or geographic subsidiaries, achieving scale synergies absent in fragmented SMB portfolios. Nonetheless, as mobile-first SaaS penetrates micro-merchants, aggregate SMB contribution to the loyalty management market will increase. Vendors must therefore accommodate lightweight onboarding while still offering enterprise-grade compliance to capture both ends of the spectrum.
By Industry Vertical: Healthcare Disrupts Traditional Leaders
Retail and consumer goods led 2025 spending at 29.96%, buoyed by grocery, convenience, and fashion chains that attach points to every transaction. Yet healthcare posts the highest CAGR at 15.92% as telehealth providers weaponize loyalty to curb patient churn in chronic-care pathways. McKinsey observes that adherence incentives medication reminders rewarded with credits toward wearable devices deliver measurable outcomes and qualify for insurance reimbursement in some jurisdictions. Hospitals integrate loyalty APIs with electronic health records so patients accrue benefits for attending check-ups, boosting preventive-care compliance. Banking, card, and insurer programs face regulatory warning shots from the CFPB, nudging issuers toward cashback formats that carry lower legal exposure. Travel and hospitality rebuild post-pandemic networks, exemplified by IHG’s unification of loyalty across 6,000 properties via Salesforce in 2024, which shrank point-credit lag to near-zero.
Manufacturing and telecom verticals focus on B2B and subscriber retention respectively, creating space for specialized vendors that understand channel incentives or network-usage triggers. Over the forecast period, vertical-specific compliance and workflow integrations will command premium pricing. Platforms embedding prior-authorization checks in healthcare or baggage-tracking APIs in travel will outpace generic solutions, adding further stratification within the loyalty management industry.
Geography Analysis
Asia Pacific led absolute growth in 2025 thanks to rising digital-payment volumes and government-backed real-time rails. Unified systems like India’s UPI allow points to credit instantly when payments clear, which improves perceived reward value and raises program engagement metrics. The loyalty management market size attributable to Asia Pacific is slated to surpass North America’s by the early 2030s if current trajectories hold, making the region a strategic priority for vendors willing to build language, currency, and compliance variants. Multinational retailers launching in Southeast Asia now prefer cloud-native platforms that can localize to rupiah, baht, ringgit, and dong without redeployment. Mastercard sees open-loop interoperability as the dominant redemption model, enabling travelers to port points across airlines, hotels, and quick-service restaurants seamlessly.
North America retains the deepest revenue pool given entrenched card-linked programs and high average transaction values. Yet program economics face margin compression because rising interchange fees, inflationary fulfillment costs, and CFPB oversight make points schemes more expensive to sustain. Brands offset the squeeze by integrating zero-party surveys that generate richer attributes for cross-sell algorithms, improving ROI per point dispensed. Hyperscaler ecosystems, notably Salesforce and Oracle, accelerate migration from legacy coalition platforms to real-time CDP-led architectures. Consequently, loyalty management market share in North America will tilt toward suppliers that pre-bundle data-privacy compliance to mitigate legal risk.
Europe’s loyalty scene revolves around GDPR and the emerging Digital Markets Act, adding legal complexity that hampers cross-border coalitions. Retailers satisfy data-sovereignty requirements through regional cloud zones or in-country hosting, raising operating costs relative to North America. However, heightened privacy expectations also elevate the value of explicit consent data, allowing compliant brands to command premium advertising yields. Scandinavia and the Benelux countries pioneer sustainability-linked rewards, aligning with ESG-minded Gen-Z consumers. Eastern European markets, meanwhile, lag on adoption but exhibit faster uplift curves once payment infrastructure modernizes.
Latin America and the Middle East and Africa remain under-penetrated in absolute dollars but deliver double-digit user growth because smartphone adoption outpaces bank account ownership. Telcos package airtime and data-bundle rewards, creating alternative currencies that bypass card networks. Super-apps in Brazil, Mexico, and the Gulf states embed loyalty micro-services, flattening previously steep onboarding friction. Lack of legacy systems acts as an advantage, letting these regions adopt best-in-class cloud platforms without migration baggage. As a result, loyalty management market vendors that offer lightweight SDKs and offline-capable features will capture outsized share in these high-growth geographies.

Competitive Landscape
The loyalty management market remains moderately fragmented, the top 10 vendors controlled about 55% of 2025 revenue, leaving space for vertical specialists and regional disruptors. Hyperscalers bundle loyalty with customer-data platforms, applying price pressure on pure-plays. Salesforce fused B2B and B2C modules inside Customer 360 in 2024, shrinking deployment timelines for existing clients from 18 months to eight weeks and deepening platform lock-in. SAP’s 2025 rollout plugs loyalty directly into Commerce Cloud and Emarsys, removing the middleware layer that formerly added months of integration. Oracle’s Unity CDP now ingests reward events in real time, letting marketers push offers within milliseconds of purchase rather than via overnight batches.
Regional champions differentiate through local compliance and language support. Annex Cloud scales zero-party data capture that sidesteps third-party cookie bans, while Open Loyalty’s open-source stack attracts developers seeking customization freedom. Web3 entrants tokenizing points on public blockchains introduce portable, composable rewards. Visa’s January 2024 NFT-based program slashed transaction fees by 60% compared with card networks, illustrating cost-of-goods advantages when settlement shifts onto decentralized rails. Yet most enterprise buyers still prioritize mature feature sets, SOC 2 attestation, and 24×7 support, tempering near-term displacement of incumbent SaaS leaders.
Mergers and acquisitions accelerate as standalone vendors seek scale to compete against bundled suites. Early 2026 rumors indicate that Shopify may buy a mid-tier loyalty engine to shore up its merchant value proposition, while PayPal eyes Web3 specialists to revive engagement in its consumer wallet. Over the forecast horizon, suppliers that aggregate omnichannel analytics, consent management, and loyalty orchestration into a single subscription will win procurement contests, pushing the loyalty management industry toward platform consolidation punctuated by specialized niche carve-outs.
Loyalty Management Industry Leaders
Oracle Corporation
Salesforce Inc.
IBM Corporation
SAP SE
Epsilon Data Management LLC (Publicis)
- *Disclaimer: Major Players sorted in no particular order

Recent Industry Developments
- November 2025: Capillary Technologies completed its acquisition of Kognitiv Corporation, adding 20-country reach and clients including Petsmart and Hallmark.
- May 2025: Salesforce confirmed talks to buy Informatica for around USD 8 billion, aiming to augment CRM with advanced data-management for AI-driven loyalty programs.
- March 2025: RBC and Canadian Tire Corporation formed a strategic loyalty alliance spanning retail and financial services touchpoints.
- January 2025: Ascenda partnered with Uber to let bank customers redeem points for rides and food delivery worldwide.


Research Methodology Framework and Report Scope
Market Definitions and Key Coverage
Our study defines the loyalty management market as all software platforms and associated services that help consumer-facing and business-to-business brands design, operate, and analyze formal reward or incentive programs that track identifiable customer interactions across physical and digital channels. These platforms include rules engines, reward catalogs, campaign management, analytics, and integration APIs that connect with POS, e-commerce, CRM, and mobile apps.
Scope exclusion: standalone gift-card processors and generic marketing automation tools that do not manage points, tiers, or member wallets are kept outside the model.
Segmentation Overview
- By Solution
- B2C
- B2B
- By Deployment
- On-Premise
- Cloud
- By Organization Size
- Small and Medium-sized Enterprises (SMEs)
- Large Enterprises
- By Industry Vertical
- BFSI
- Retail and Consumer Goods
- Travel and Hospitality
- IT and Telecom
- Healthcare
- Manufacturing
- Other Industry Verticals
- By Geography
- North America
- United States
- Canada
- Mexico
- South America
- Brazil
- Argentina
- Rest of South America
- Europe
- Germany
- United Kingdom
- France
- Italy
- Spain
- Rest of Europe
- Asia Pacific
- China
- India
- Japan
- South Korea
- Australia and New Zealand
- Rest of Asia Pacific
- Middle East
- Saudi Arabia
- United Arab Emirates
- Turkey
- Rest of Middle East
- Africa
- South Africa
- Nigeria
- Egypt
- Rest of Africa
- North America
Detailed Research Methodology and Data Validation
Primary Research
Mordor analysts spoke with software vendors, payment processors, and brand managers across North America, Europe, Asia-Pacific, and the Middle East. Interviews explored program enrollment ratios, cloud migration timelines, average reward redemption costs, and regional budget outlooks, which then verified desk findings and filled data gaps before we locked assumptions.
Desk Research
We began by mapping the universe of vendors, program operators, and user industries through open data from sources such as SEC 10-Ks, European Central Bank card statistics, U.S. Census Annual Retail Trade, and trade bodies like the National Retail Federation and Airlines Reporting Corporation. News and patent feeds on Dow Jones Factiva, along with shipment records from Volza, helped our team see technology adoption rates country by country. White papers from organizations such as GSMA and the World Bank's Global Findex supplied smartphone penetration and digital payment variables that influence loyalty platform demand. The sources cited above are illustrative; many additional public documents were reviewed to cross-check figures and clarify trends.
Market-Sizing & Forecasting
A combined top-down demand pool (built from retail, travel, and credit-card purchase volumes, consumer loyalty participation rates, and average spend on program technology) is reconciled with selective bottom-up snapshots such as leading vendor revenues and sampled average selling price times active account estimates. Key model drivers include smartphone subscription density, e-commerce share of total retail, average reward cost per active member, card transaction volume, and cloud infrastructure spend. Annual forecasts rely on multivariate regression linked to these indicators, followed by ARIMA smoothing to capture short-term shocks. Any gaps in bottom-up inputs are bridged using regional benchmarking and conservative elasticity ranges agreed upon with senior interviewees.
Data Validation & Update Cycle
Outputs pass variance tests against historical sales disclosures and macro-signals. Senior analysts review anomalies, and findings are updated each year or sooner if material events, such as regulatory changes in data privacy, shift assumptions. Clients receive a last-mile refresh before delivery.
Why Our Loyalty Management Baseline Stands Reliable
Published estimates often diverge because firms apply different solution scopes, price stacks, and refresh cadences.
Key gap drivers include whether professional services are counted, how aggressively future cloud adoption is baked in, and the currency conversion year used. Mordor keeps a consistent scope, reports a mid-case scenario, and revisits assumptions annually, which limits drift.
Benchmark comparison
| Market Size | Anonymized source | Primary gap driver |
|---|---|---|
| USD 14.28 B (2025) | Mordor Intelligence | - |
| USD 12.07 B (2024) | Global Consultancy A | Excludes loyalty-linked professional services and uses 2024 exchange rates |
| USD 12.89 B (2025) | Industry Association B | Counts only license fees, assumes flat cloud shift rate |
| USD 15.19 B (2025) | Regional Consultancy C | Includes gift-card processors, projects aggressive mobile wallet uptake |
These comparisons show that once scope alignment and variable selection are standardized, Mordor's disciplined blend of verified usage metrics, consistent currency treatment, and annual refresh cadence delivers a balanced, transparent baseline that decision-makers can trust.


Key Questions Answered in the Report
How large is the loyalty management market in 2026 and how fast is it growing?
The market stands at USD 16.44 billion in 2026 and is forecast to expand at a 14.62% CAGR, reaching USD 32.52 billion by 2031.
Which region shows the fastest growth potential for loyalty platforms?
Asia Pacific posts the highest CAGR at 14.88% because unified payments interfaces and QR interoperability let consumers redeem points instantly at checkout.
Why are B2B loyalty programs gaining momentum?
Manufacturers and distributors see higher lifetime value in channel-partner retention, driving a 17.52% CAGR for B2B solutions through 2031.
What deployment model is overtaking on-premise loyalty systems?
Cloud-based API platforms are growing at 16.44% annually, eroding the 74.74% share held by on-premise deployments in 2025.
How do data-privacy regulations affect loyalty strategies?
GDPR, CCPA, and similar laws compel vendors to localize storage and secure explicit consent, adding 30-40% compliance overhead and favoring providers with regional data centers.
What technological trend most enhances reward program ROI?
AI-driven personalization engines that tailor incentives in real time generate a 5.2× return on loyalty spend among early adopters, markedly improving program economics.
Page last updated on:


