
Algeria Fruits And Vegetables Market Analysis by Mordor Intelligence
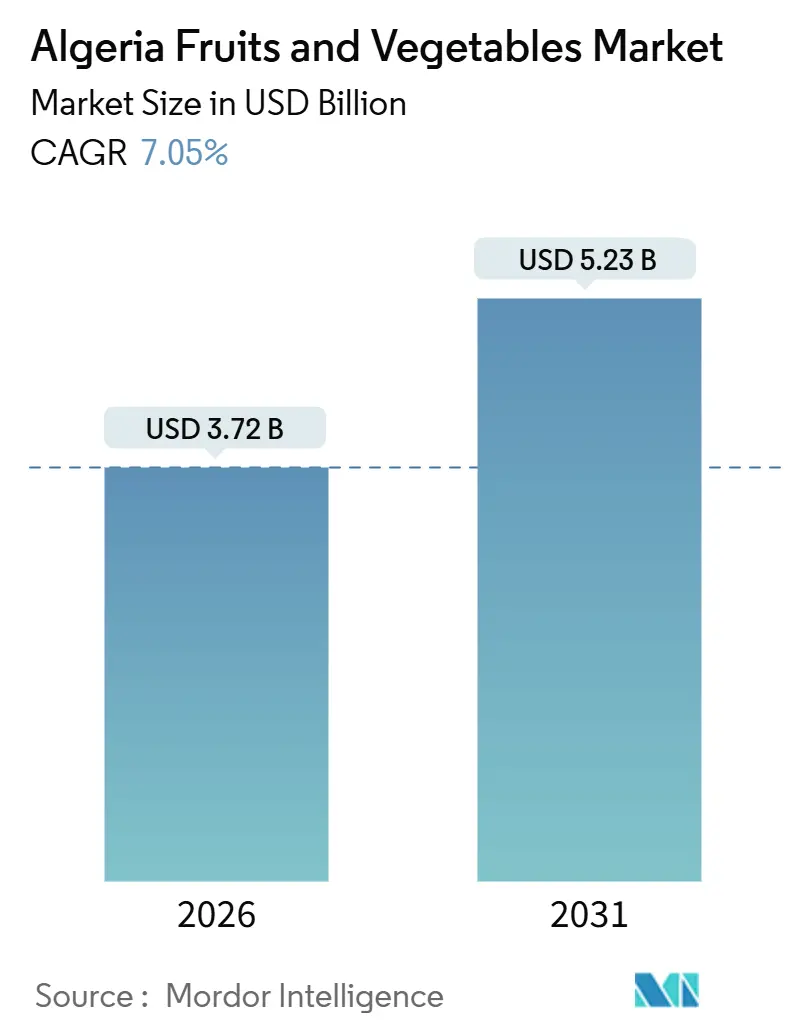
The Algeria fruits and vegetables market size is valued at USD 3.72 billion in 2026 and is projected to reach USD 5.23 billion by 2031, advancing at a 7.05% CAGR during 2026-2031. Rising tomato-processing capacity, expanding greenhouse acreage, and a decisive pivot toward Saharan agripoles are the dominant forces behind this outlook. Export earnings, led by Deglet Nour dates and triple-concentrated tomato paste, are cushioning the fiscal balance while reducing long-standing import dependence. Government irrigation subsidies and foreign direct investment from Qatar and Italy are accelerating technology transfer into desert zones, improving water productivity and raising output per hectare. Meanwhile, cold-chain modernization and health-conscious urban diets are strengthening domestic demand for fresh and minimally processed produce, setting a virtuous cycle of scale that favors downstream processors.
Key Report Takeaways
- By type, vegetables accounted for 54% of the Algeria fruits and vegetables market size in 2025, while fruits recorded the fastest growth at a 9.8% CAGR through 2031.
Note: Market size and forecast figures in this report are generated using Mordor Intelligence’s proprietary estimation framework, updated with the latest available data and insights as of January 2026.
Algeria Fruits And Vegetables Market Trends and Insights
Drivers Impact Analysis*
| Driver | (~) % Impact on CAGR Forecast | Geographic Relevance | Impact Timeline |
|---|---|---|---|
| Government push for Sahara agripoles | +1.2% | Sahara Agro-Hubs (Biskra, El Oued, Ouargla, Ghardaïa) | Medium term (2-4 years) |
| Expansion of greenhouse acreage and mid-tech tunnels | +0.9% | National, with concentration in Sahara Agro-Hubs and High Plateaus | Short term (≤ 2 years) |
| Surge in tomato-processing capacity reducing import needs | +0.7% | Northern Coastal Belt (Guelma, Skikda) and Sahara Agro-Hubs | Medium term (2-4 years) |
| European Union demand for organic Deglet Nour dates | +0.8% | Sahara Agro-Hubs (Biskra, El Oued, Tolga) | Long term (≥ 4 years) |
| Climate-smart irrigation subsidies | +0.6% | National, with early gains in El Oued and Biskra | Medium term (2-4 years) |
| Growing domestic health awareness boosting fresh-produce intake | +0.5% | Northern Coastal Belt and High Plateaus urban centers | Long term (≥ 4 years) |
| Source: Mordor Intelligence | |||
Government Push for Sahara Agripoles
Algeria aims to convert more than 1 million hectares of Saharan land for agriculture by 2028, with the Office for Saharan Agriculture Development already allocating about 460,000 hectares[1]. In 2024, Qatar-based Baladna pledged USD 3.5 billion, and Italy’s Bonifiche Ferraresi set aside USD 455 million for mixed farming complexes that integrate center pivots, underground drip systems, and renewable-powered desalination. These ventures diversify production away from crowded coastal farmland, lower exposure to rain-fed yield swings, and anchor the Algeria fruits and vegetables commodity market in export-oriented hubs. Policy incentives such as zero-duty machinery imports and discounted desert power tariffs further reduce capital costs, quickening payback periods for investors. Over time, the new acreage eases pressure on urban fringes and redirects logistics corridors toward southern rail links and dry ports.
Expansion of Greenhouse Acreage and Mid-Tech Tunnels
Greenhouse surface reached roughly 21,000 hectares in 2024, almost doubling since 2013[2]. Low-cost polyethylene tunnels allow smallholders to harvest potatoes twice a year, lifting yields from 20 metric tons per hectare under pivot irrigation to 30 metric tons with subsurface drip lines. Tomato growers benefit from extended production windows, creating a steadier feedstock for processors and trimming reliance on imports of Chinese paste. The greenhouse boom also feeds upstream demand for Dutch seed potatoes, plastic film, and localized fertigation consulting, expanding the ancillary supply chain of the Algeria fruits and vegetables commodity market. As extension services replicate Biskra’s success across the High Plateaus, national vegetable output gains resiliency against erratic spring frosts and summer heatwaves.
Surge in Tomato-Processing Capacity Reducing Import Needs
Groupe Amor Benamor expanded daily throughput from 200 metric tons in 1984 to 3,000 metric tons in 2025, underpinning a 60% fall in paste imports since 2018. Additional lines from CARAJUS and La Belle Group have unlocked economies of scale that lower unit costs, stimulate contract farming, and stabilize farm-gate prices during peak harvests. Processors are now trialing high-brix hybrid cultivars to improve dry-matter ratios, which would further compress conversion costs. The downstream shift adds value in rural Guelma and Skikda, supports ancillary can manufacturing, and deepens the Algeria fruits and vegetables commodity market’s footprint in institutional catering segments such as school meals.
European Union Demand for Organic Deglet Nour Dates
Algerian date exports have experienced a consistent increase in both volume and value over the past decade, with organic-certified shipments to the European Union rising year-on-year. Tolga Palms and Ziban Agro Fruits secured Naturland and Ecocert seals that lift average selling prices by more than 30%. Algeria now targets USD 250 million in date exports by 2028, broadening its reach from 57 to 150 countries. Premium positioning encourages vertical integration into sorting, pitting, and consumer-ready packaging, improving margins and reinforcing brand equity for the Algeria fruits and vegetables commodity market in high-income import destinations.
Restraints Impact Analysis*
| Restraint | (~) % Impact on CAGR Forecast | Geographic Relevance | Impact Timeline |
|---|---|---|---|
| Groundwater depletion in key oases | -0.9% | Sahara Agro-Hubs (El Oued, Biskra, Ouargla) | Long term (≥ 4 years) |
| Post-harvest cold-chain gaps raising losses | -0.7% | National, with acute deficits in High Plateaus and Sahara | Short term (≤ 2 years) |
| Price volatility for potatoes and onions | -0.5% | National, with spillover to urban retail markets | Short term (≤ 2 years) |
| Small-farm access to affordable finance | -0.4% | National, particularly affecting smallholders in High Plateaus | Medium term (2-4 years) |
| Source: Mordor Intelligence | |||
Groundwater Depletion in Key Oases
Withdrawals from the Northwestern Sahara Aquifer exceed natural recharge by nearly 1.8 billion cubic meters annually, causing water tables to drop up to 1 meter each year in El Oued. The decline threatens UNESCO-listed ghout oases whose shallow-rooted palms produce premium fruit fetching triple the market rate. Pivot-irrigated potato expansion accounts for a major portion of extraction, creating tension between staple supply goals and aquifer preservation. If pumping caps are enforced, Saharan acreage gains that currently power the Algeria fruits and vegetables commodity market could stall, forcing a pivot toward desalination or treated wastewater, where technologies remain costlier than fossil groundwater.
Post-Harvest Cold-Chain Gaps Raising Losses
Up to 15% of farm earnings vanish each year because produce lacks refrigerated storage during the 48-to-72-hour window between harvest and retail. The government responded in July 2025 with interest-free loans of up to DZD 150 million (USD 1.15 million) for warehouses sized 300-5,000 square meters. While helpful, fewer than 20% of date exporters yet comply with unbroken cold-chain protocols demanded by European Union buyers, curbing Algeria’s ability to exploit premium niches. Accelerated roll-out of solar-powered pack-houses and IoT temperature tracking is vital for the Algeria fruits and vegetables commodity market to minimize waste and uphold export contracts.
*Our forecasts treat driver/restraint impacts as directional, not additive. The impact forecasts reflect baseline growth, mix effects, and variable interactions.
Geography Analysis
The Northern Coastal Belt held a significant share of market value in 2025 owing to established port access, mature citrus orchards, and cooler Mediterranean microclimates that favor horticultural diversity. Coastal processors like Fruital rely on a dense cold-chain to serve national supermarkets, ensuring that the Algeria fruits and vegetables commodity market maintains a strategic base close to high-income urban consumers[3].
The High Plateaus supply cereals and storage crops and act as a transit hub for imported apples and bananas. Although semi-arid winters restrict horticulture, greenhouse pilots promise to extend the range of off-season tomatoes and peppers. Market modernization plans that add eight wholesale centers by MAGROS are designed to shorten supply chains, reduce spoilage, and stabilize prices, according to Dzair Tube (Media Group), as mentioned in 2024. Should financing constraints ease, the region could claim a larger slice of the Algeria fruits and vegetables commodity market by tapping unmet demand in inland cities where purchasing power is rising.
Sahara Agro-Hubs, led by Biskra and El Oued, commanded 55% of export value in 2025. Pivot irrigation and underground drip have turned desert sands into prolific potato and date belts, yet aquifer drawdown remains the Achilles heel. Large-scale FDI projects integrate solar power and potentially desalination to offset groundwater limits, positioning the Sahara as both frontier and flashpoint for the Algeria fruits and vegetables commodity market. If regulatory enforcement of pumping caps tightens, capital will shift toward recycled wastewater, pushing up production costs but ensuring long-term viability.
Regulatory Landscape
Algeria’s fruits and vegetables regulatory framework covers plant health and quality controls led by the Ministry of Agriculture and Rural Development, notably through the Direction de la Protection des Vegetaux et des Controles Techniques (DPVCT), with market and trade oversight under the Ministry of Commerce. Imports of plants and plant products require a phytosanitary certificate and inspection at authorized border control posts, so documentation, pre-clearance, and compliance procedures directly shape import timelines for fresh produce and planting materials.
On the product quality and trade side, Executive Decree 13-260 (2013) underpins a quality system for agricultural products, while trade-policy tools such as Temporary Additional Safeguard Duties (DAPs) are used to influence import flows across food-product lines. In 2026, the Mandatory Import Forecast Program (PPI) increases the administrative burden for importers and raises government visibility into planned supply, reinforcing the policy preference for domestic availability and price stability alongside tighter controls on inbound volumes.
Value Chain Analysis
The value chain starts with inputs such as seeds (including imported vegetable seed and seed potatoes), fertilizers, crop protection, greenhouse films and structures, and irrigation equipment that support intensive production across the Northern Coastal Belt, High Plateaus, and the Sahara agro-hubs (Biskra, El Oued, Ouargla, Ghardaia). Production splits between open-field staples such as potato and onion, and protected cultivation such as tomato and peppers. Desert pivot and subsurface drip systems expand output but increase exposure to groundwater constraints. Producer organizations and inter-branch bodies help coordinate supply for key crops, including the National Interbranch Council of the Tomato Industry (CNIFT), while larger investors and agripole projects integrate farming, water systems, and energy solutions in Saharan zones.
Aggregation and marketing depend on traders, wholesale markets, and state-linked stabilization mechanisms. The Algerian Company for the Regulation of Agricultural Products (SARPA), operating under the AGROLOG industrial group, intervenes to regulate flows and reduce supply-demand gaps for items such as potatoes, onions, garlic, dates, apples, and citrus. Downstream processing and packaging add value through tomato paste and cannery lines, and through date sorting, pitting, and export packing, while distribution runs across wet markets, modern retail, and institutional channels, with some processors operating fleets to maintain service levels. The main friction points remain post-harvest handling and cold chain coverage, reflected in the 48-72 hour vulnerability window between harvest and retail, and in policy support for financed refrigerated warehouses to reduce losses and protect realized farm income.
Competitive Landscape
The Algeria fruits and vegetables commodity market is not concentrated, with many regional growers, traders, and processors contributing to revenue in 2025. Groupe Amor Benamor leads, driven by vertically integrated tomato contracts, large-scale processing in Guelma, and a nationwide distribution fleet that buffers margins against raw-material volatility. CEVITAL’s Fruital subsidiary uses an extensive refrigerated network and its parent’s trucking arm to dominate citrus juice retail across coastal supermarkets. Izdihar SpA reported DZD 106 billion (USD 815 million) in 2023, supported by its frozen mixed-vegetable range securing freezer doors in modern grocery outlets.
Strategic investments over 2024-2025 illustrate how incumbents are scaling output and tightening supply chains. Groupe Amor Benamor boosted daily tomato-processing throughput from 200 metric tons in 1984 to 3,000 metric tons in 2025 after commissioning high-brix evaporation lines that cut unit energy costs and lift paste solids. La Belle Group’s Grande Conserverie Dahmani opened its ninth cannery in northwest Algeria in 2024 to capture regional vegetable harvests and shorten transport time to ports. Together, these moves strengthen downstream bargaining power and embed quality benchmarks that smaller packers must now meet.
Technology adoption is the next competitive frontier, as fewer than 10% of Algerian farms use soil sensors, satellite imagery, or automatic climate controls despite pilot yield gains of up to 25%. Capital-rich processors are testing underground drip fertigation and solar-powered cold rooms to hedge groundwater depletion and post-harvest losses, while startup service firms offer leasing models that lower upfront costs for smallholders. Foreign direct investors such as Qatar’s Baladna and Italy’s Bonifiche Ferraresi are integrating fodder crops, greenhouse tomatoes, and desalinated water in desert megafarms, accelerating scale advantages that local cooperatives cannot yet match. As consumer demand shifts toward traceable produce, competitive positioning will increasingly hinge on data-driven irrigation, refrigerated logistics, and certifications that unlock premium shelf space in the European Union.
Market Opportunities and Future Outlook
Opportunities are concentrated where Algeria is committing capital and policy bandwidth to raise output per hectare and reduce import dependence, especially in Saharan agripoles and controlled-environment production. Large, integrated desert projects create demand for irrigation hardware, greenhouse and fertigation systems, agronomy services, and renewable-linked water solutions, supported by phase expansions in Adrar linked to Qatar-backed Baladna’s multi-year program and by new large-scale farm plans announced for inland provinces. Alongside primary production, the cold chain and pack-house layer remains underbuilt versus export and modern retail requirements, and the July 2025 interest-free loan program for refrigerated warehouses (300-5,000 square meters) provides a funding pathway for third-party logistics, storage operators, and packers to expand compliant handling.
Digitization and formalization also open near- and mid-term demand for farm and logistics data services, traceability workflows, and compliance-driven quality management. The Ministry of Agriculture’s June 2026 launch of the National Agricultural Information System (SNIA) creates a national platform for centralizing farm data used for planning and decision-making, improving the structure of forecasting and resource allocation across horticultural regions. On the export side, organic-certified Deglet Nour dates and processed tomato products support higher-value channels, while the gap between certification requirements and current cold-chain compliance among exporters leaves room for investments in temperature-controlled handling, laboratory testing coordination, and consumer-ready packaging to lift unit realizations and reduce spoilage.
Recent Industry Developments
- June 2026: Numidia began commercial trials of Algerian yellow melons in the French market to validate demand, quality specs, and end-to-end logistics, with continuity targeted through October 2026. The initiative tests export readiness for fresh produce beyond dates and provides a reference route for compliant handling, packing, and transport into the European market.
- July 2025: Algeria rolled out interest-free loans of up to DZD 150 million (USD 1.15 million) for cold storage facilities sized 300-5,000 square meters. The financing supports rapid additions of refrigerated capacity that reduce post-harvest losses and helps exporters and domestic distributors meet tighter temperature-control expectations.
- September 2024: Algeria’s National Agricultural Land Office (ONTA) granted Al Rayyan Agricultural a qualification certificate for a 1,811-hectare concession in Hassi Fehal, alongside operational setup in El Meniaa. The concession strengthens the pipeline of large-scale vegetable-oriented farming in the Sahara corridor, expanding commercial supply sources that can feed processors and wholesale channels.
Research Methodology Framework and Report Scope
Market Definition and Coverage
This market is sized as the annual value of fruits and vegetables consumed in Algeria, combining domestically produced supply and imported supply, net of exports, and valued at prevailing prices across the period.
Scope exclusions: Meat, seafood, grains, oils, packaged meals, and non-edible crop uses are excluded from this market definition.
Segmentation Overview
- By Type
- Fruits
- Citrus
- Production Analysis
- Production Volume
- Area Harvested and Yield
- Consumption Analysis (Value and Volume)
- Trade Analysis (Value and Volume)
- Import Market Analysis
- Import Value and Volume
- Key Supplying Markets
- Export Market Analysis
- Export Value and Volume
- Key Destination Markets
- Import Market Analysis
- Wholesale Price Trend Analysis and Forecast
- Seasonality Analysis
- Production Analysis
- Dates
- Production Analysis
- Production Volume
- Area Harvested and Yield
- Consumption Analysis (Value and Volume)
- Trade Analysis (Value and Volume)
- Import Market Analysis
- Import Value and Volume
- Key Supplying Markets
- Export Market Analysis
- Export Value and Volume
- Key Destination Markets
- Import Market Analysis
- Wholesale Price Trend Analysis and Forecast
- Seasonality Analysis
- Production Analysis
- Grapes
- Production Analysis
- Production Volume
- Area Harvested and Yield
- Consumption Analysis (Value and Volume)
- Trade Analysis (Value and Volume)
- Import Market Analysis
- Import Value and Volume
- Key Supplying Markets
- Export Market Analysis
- Export Value and Volume
- Key Destination Markets
- Import Market Analysis
- Wholesale Price Trend Analysis and Forecast
- Seasonality Analysis
- Production Analysis
- Apples
- Production Analysis
- Production Volume
- Area Harvested and Yield
- Consumption Analysis (Value and Volume)
- Trade Analysis (Value and Volume)
- Import Market Analysis
- Import Value and Volume
- Key Supplying Markets
- Export Market Analysis
- Export Value and Volume
- Key Destination Markets
- Import Market Analysis
- Wholesale Price Trend Analysis and Forecast
- Seasonality Analysis
- Production Analysis
- Watermelon
- Production Analysis
- Production Volume
- Area Harvested and Yield
- Consumption Analysis (Value and Volume)
- Trade Analysis (Value and Volume)
- Import Market Analysis
- Import Value and Volume
- Key Supplying Markets
- Export Market Analysis
- Export Value and Volume
- Key Destination Markets
- Import Market Analysis
- Wholesale Price Trend Analysis and Forecast
- Seasonality Analysis
- Production Analysis
- Strawberries
- Production Analysis
- Production Volume
- Area Harvested and Yield
- Consumption Analysis (Value and Volume)
- Trade Analysis (Value and Volume)
- Import Market Analysis
- Import Value and Volume
- Key Supplying Markets
- Export Market Analysis
- Export Value and Volume
- Key Destination Markets
- Import Market Analysis
- Wholesale Price Trend Analysis and Forecast
- Seasonality Analysis
- Production Analysis
- Citrus
- Vegetables
- Potatoes
- Production Analysis
- Production Volume
- Area Harvested and Yield
- Consumption Analysis (Value and Volume)
- Trade Analysis (Value and Volume)
- Import Market Analysis
- Import Value and Volume
- Key Supplying Markets
- Export Market Analysis
- Export Value and Volume
- Key Destination Markets
- Import Market Analysis
- Wholesale Price Trend Analysis and Forecast
- Seasonality Analysis
- Production Analysis
- Tomatoes
- Production Analysis
- Production Volume
- Area Harvested and Yield
- Consumption Analysis (Value and Volume)
- Trade Analysis (Value and Volume)
- Import Market Analysis
- Import Value and Volume
- Key Supplying Markets
- Export Market Analysis
- Export Value and Volume
- Key Destination Markets
- Import Market Analysis
- Wholesale Price Trend Analysis and Forecast
- Seasonality Analysis
- Production Analysis
- Onions
- Production Analysis
- Production Volume
- Area Harvested and Yield
- Consumption Analysis (Value and Volume)
- Trade Analysis (Value and Volume)
- Import Market Analysis
- Import Value and Volume
- Key Supplying Markets
- Export Market Analysis
- Export Value and Volume
- Key Destination Markets
- Import Market Analysis
- Wholesale Price Trend Analysis and Forecast
- Seasonality Analysis
- Production Analysis
- Garlic
- Production Analysis
- Production Volume
- Area Harvested and Yield
- Consumption Analysis (Value and Volume)
- Trade Analysis (Value and Volume)
- Import Market Analysis
- Import Value and Volume
- Key Supplying Markets
- Export Market Analysis
- Export Value and Volume
- Key Destination Markets
- Import Market Analysis
- Wholesale Price Trend Analysis and Forecast
- Seasonality Analysis
- Production Analysis
- Beans
- Production Analysis
- Production Volume
- Area Harvested and Yield
- Consumption Analysis (Value and Volume)
- Trade Analysis (Value and Volume)
- Import Market Analysis
- Import Value and Volume
- Key Supplying Markets
- Export Market Analysis
- Export Value and Volume
- Key Destination Markets
- Import Market Analysis
- Wholesale Price Trend Analysis and Forecast
- Seasonality Analysis
- Production Analysis
- Eggplant
- Production Analysis
- Production Volume
- Area Harvested and Yield
- Consumption Analysis (Value and Volume)
- Trade Analysis (Value and Volume)
- Import Market Analysis
- Import Value and Volume
- Key Supplying Markets
- Export Market Analysis
- Export Value and Volume
- Key Destination Markets
- Import Market Analysis
- Wholesale Price Trend Analysis and Forecast
- Seasonality Analysis
- Production Analysis
- Cauliflower
- Production Analysis
- Production Volume
- Area Harvested and Yield
- Consumption Analysis (Value and Volume)
- Trade Analysis (Value and Volume)
- Import Market Analysis
- Import Value and Volume
- Key Supplying Markets
- Export Market Analysis
- Export Value and Volume
- Key Destination Markets
- Import Market Analysis
- Wholesale Price Trend Analysis and Forecast
- Seasonality Analysis
- Production Analysis
- Potatoes
- Fruits
Data Sources, Market Sizing, and Validation
Desk Research
Desk research starts by mapping Algeria production and trade flows so the demand pool is anchored in measurable volumes. Public datasets, such as FAOSTAT, ITC Trade Map, UN Comtrade, World Bank macro series, and national statistical releases and agriculture ministry publications, are used to build time series for output, imports, exports, and crop seasonality.
Next, price signals are organized using official wholesale and consumer price releases where available, alongside customs values to infer unit values for key items moving through trade. We also review company filings, investor presentations, reputable press, and association websites to track cold chain expansion, greenhouse area additions, and processing capacity changes that can shift supply availability. For company financials, patents, and shipment-level trade checks, a paid subscription database is used selectively to confirm entity activity and to cross-check directional movements. These examples are not exhaustive, and many other public and paid sources were also consulted for data collection, validation, and research clarification.
Primary Interviews and Surveys
We use interviews and surveys with growers, wholesalers, processors, importers, retailers, and agricultural specialists in Algeria to test output, channel volumes, realized prices, storage losses, and seasonal supply. Responses validate secondary data, fill gaps around informal trade and regional availability, and challenge assumptions before final reconciliation.
Distribution of primary research fieldwork respondents
| Company type | Respondent position |
|---|---|
| Top tier: 30% | CXOs: 18% |
| Mid tier: 45% | Functional/Unit leaders: 32% |
| Smaller Players: 25% | Managers: 50% |
Market-Sizing & Forecasting
Sizing is built from a top-down consumption reconstruction, where production volumes, import and export balances, and post-harvest loss assumptions are used to arrive at available supply for domestic use, then valued using observed price series. The model is run by major fruit and vegetable groups, and totals are consolidated after unit and currency checks so the final number is in comparable USD.
To keep totals realistic, we corroborate the outcome with selective bottom-up approximations, such as sampled wholesale prices multiplied by traded volume at key markets, and channel checks on modern retail and foodservice shares. We then adjust where the implied per capita intake is inconsistent with the broader crop group pattern. Key inputs used include harvested area and yield trends, import unit values versus local prices, seasonal price swings, processing throughput indicators (for items like tomato derivatives), and changes in cold chain capacity that affect losses and availability.
For forecasting, scenario analysis is applied around weather variability and import reliance, and then a multivariate regression is used to link demand value to population growth, income trends, and price inflation. When a bottom-up data point is missing for a crop group, we fill the gap using proxy ratios from nearby years and validate it with primary feedback before it is accepted.
Data Validation & Update Cycle
Validation is done through repeated cross-checks between value outputs and independent signals like trade values, inflation series, and production benchmarks, and then reviewed again for outliers at the crop group level. If an unusual jump is seen, respondents are re-contacted to confirm whether it was driven by price spikes, short supply, or a reporting change.
Before sign-off, the model and assumptions go through multi-step analyst review so calculation logic, units, and currency conversions remain consistent. The report is refreshed annually, with interim updates when major events occur, such as policy shifts on imports, extreme weather impacts, or sharp price movements. Right before delivery, we rerun the latest data release updates so clients receive an updated view.
Mordor Intelligence's Algerian Fruit Vegetable Market Estimate Compared With Other Published Estimates
Published market sizes for Algeria fruits and vegetables can differ because each publisher may value the market at a different price point, treat trade flows differently, or mix fresh produce with adjacent packaged categories. Timing also matters, since inflation and seasonal pricing can move the USD value quickly even if volumes are steady.
Dried fruits and nuts often get counted inside some estimates, but they sit outside Mordor Intelligence's scope here, which keeps the total tied to fresh and typical processed fruit and vegetable items tracked through production and trade balances. Other gaps come from using farm-gate prices instead of wholesale or retail prices, applying a single average price across the year, or not reconciling import unit values with local pricing, which can either inflate or understate the final value.
Benchmark comparison
| Source | Market Size | Gaps in Research Methodology |
|---|---|---|
| Mordor Intelligence | USD 3.72 B (2026) | |
| Industry Data Publisher A | USD 3.65 B (2023) | Uses a different base year and a broader category list that explicitly includes dried and preserved items, and it does not clearly show how domestic production, imports, and exports are reconciled into a single consumption pool. |
| Advisory Publisher B | USD 3.60 B (2024) | Appears to include dried fruits and nuts and greenhouse produce as separate counted categories, and the value reference is presented without a transparent price basis, which makes cross-year comparison sensitive to inflation and FX timing. |
The benchmark shows that year selection and category inclusion are the biggest drivers of the spread, followed by how prices are applied across seasons. By keeping the model traceable to production, net trade, and observable price series, the result stays practical to re-check and update when new official data is released.
Key Questions Answered in the Report
How big is Algeria’s fruits and vegetables commodity market in 2026?
Algeria's fruits and vegetables market stands at USD 3.72 billion in 2026.
Why are Sahara agripoles important?
They unlock more than 1 million hectares for irrigated farming, diversify geography, and attract over USD 4 billion in foreign investment.
Which commodity delivers the highest export value?
Organic Deglet Nour dates drive premium export earnings and command 30% price premiums in European Union markets.
What is the key bottleneck in post-harvest logistics?
Inadequate cold storage causes up to 15% income loss, prompting a new interest-free loan program for refrigerated warehouses.