
Managed Vulnerability and Patch Management Services Market Size and Share
Market Overview
| Study Period | 2021 - 2032 |
|---|---|
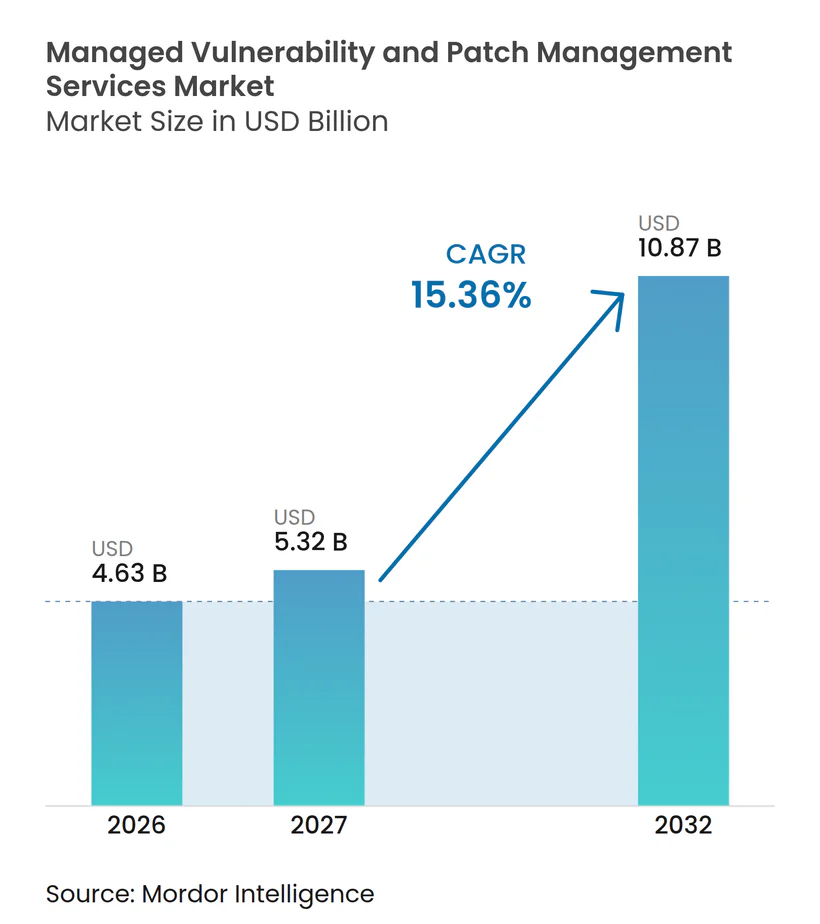
| Market Size (2027) | USD 5.32 Billion |
| Market Size (2032) | USD 10.87 Billion |
| Growth Rate (2027 - 2032) | 15.36 % |
| Fastest Growing Market | Asia-Pacific |
| Largest Market | North America |
| Market Concentration | Medium |
Major Players *Disclaimer: Major Players sorted in no particular order Image © Mordor Intelligence. Reuse requires attribution under CC BY 4.0. | |
Managed Vulnerability and Patch Management Services Market Analysis by Mordor Intelligence
The managed vulnerability and patch management services market size is projected to expand from USD 4.63 billion in 2026 and USD 5.32 billion in 2027 to USD 10.87 billion by 2032, registering a CAGR of 15.36% between 2027 to 2032. Demand is rising because organizations must assess, prioritize, deploy, and verify patches across larger and more varied technology estates. Exploitation activity is reducing the time available for manual review, which increases the value of continuous monitoring and managed remediation. Compliance requirements are also making patch records, approval evidence, and remediation reporting central parts of service contracts. Providers are widening their offerings from scanning into orchestration, verification, and support for cloud, operational technology, and unmanaged assets. The managed vulnerability and patch management services market is therefore moving toward service models that link technical findings to accountable closure.
Key Report Takeaways
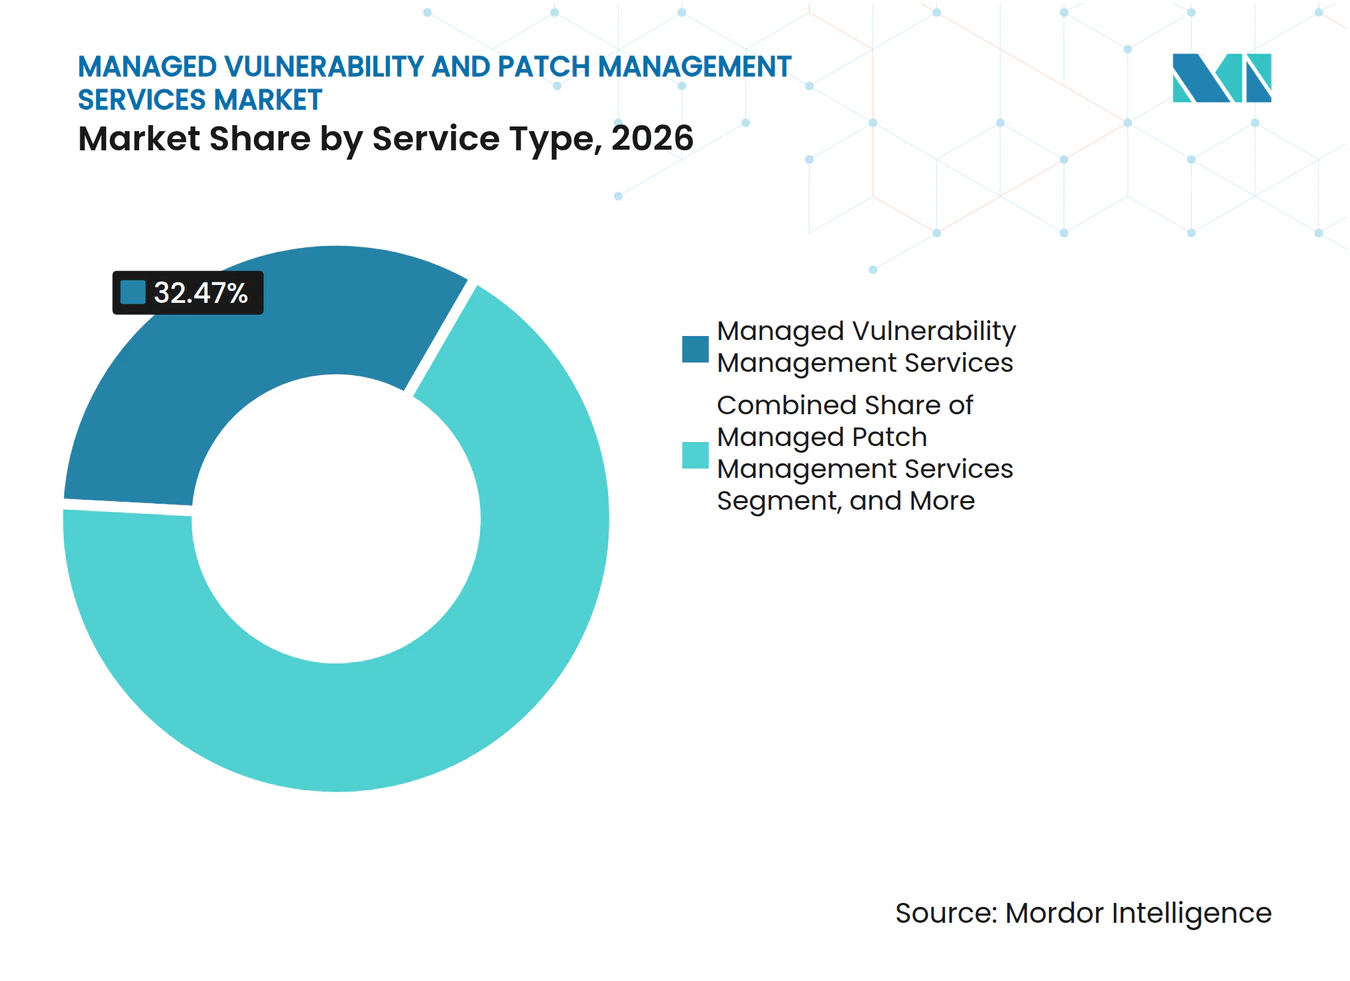
- By service type, Managed Vulnerability Management Services held 32.47% of the managed vulnerability and patch management services market share in 2026, while Remediation Orchestration and Verification Services are projected to expand at a 15.73% CAGR through 2032.
- By service delivery model, Fully Managed services held 39.83% share in 2026, while Co-Managed services are projected to expand at a 16.17% CAGR through 2032.
- By asset coverage, Endpoints and Servers held 34.27% share in 2026, while Cloud Workloads and Containers are projected to expand at a 16.63% CAGR through 2032.
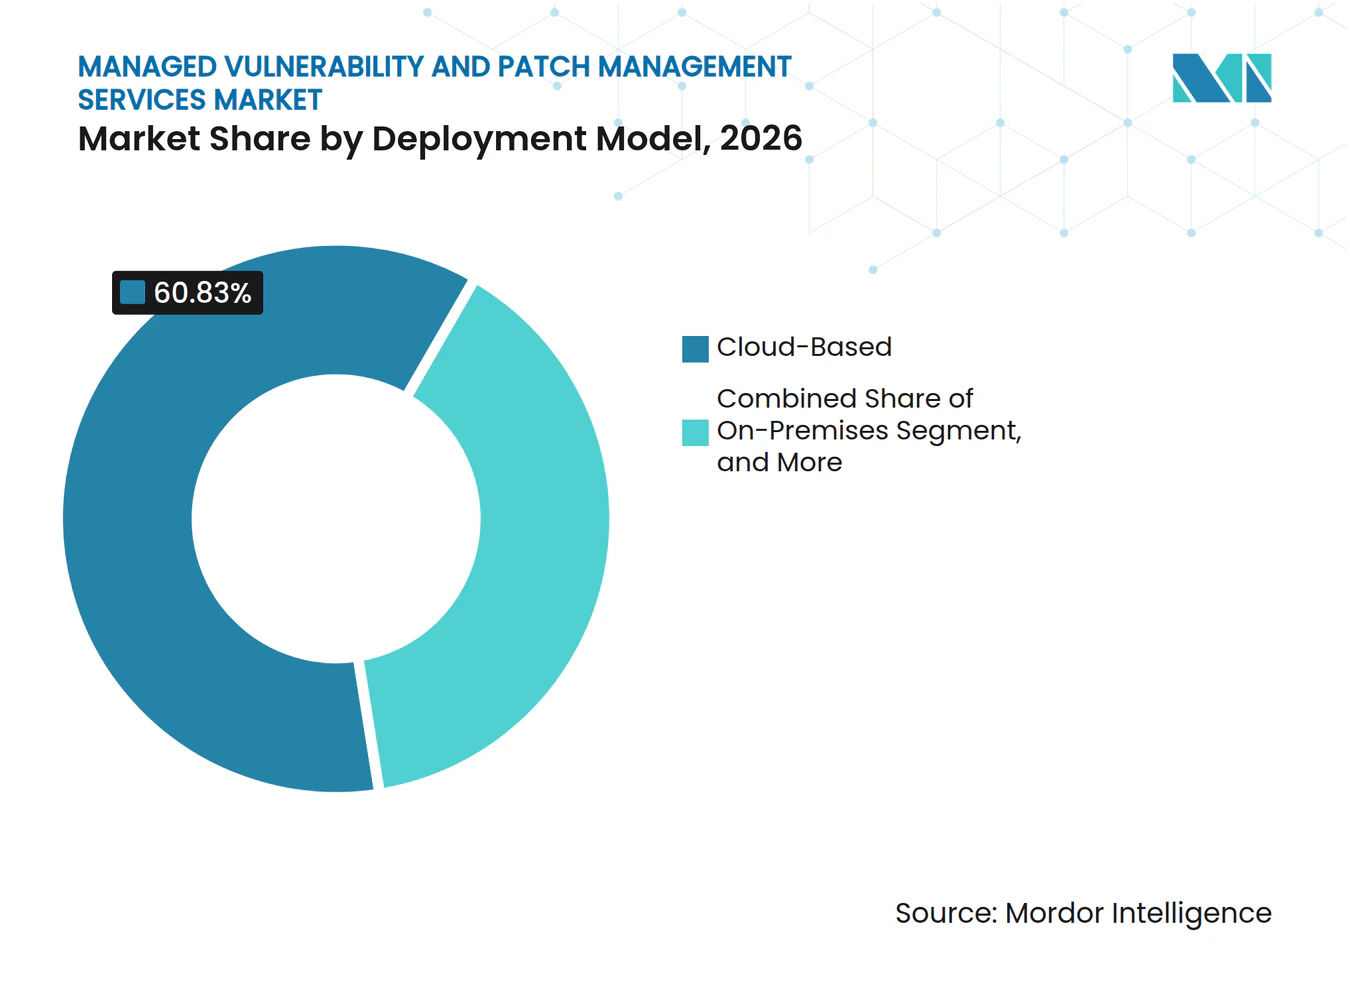
- By deployment model, Cloud-Based deployments held 60.83% share in 2026, while Hybrid deployments are projected to expand at a 16.44% CAGR through 2032.
- By end-user industry, BFSI held 24.37% share in 2026, while Healthcare is projected to expand at a 16.51% CAGR through 2032.
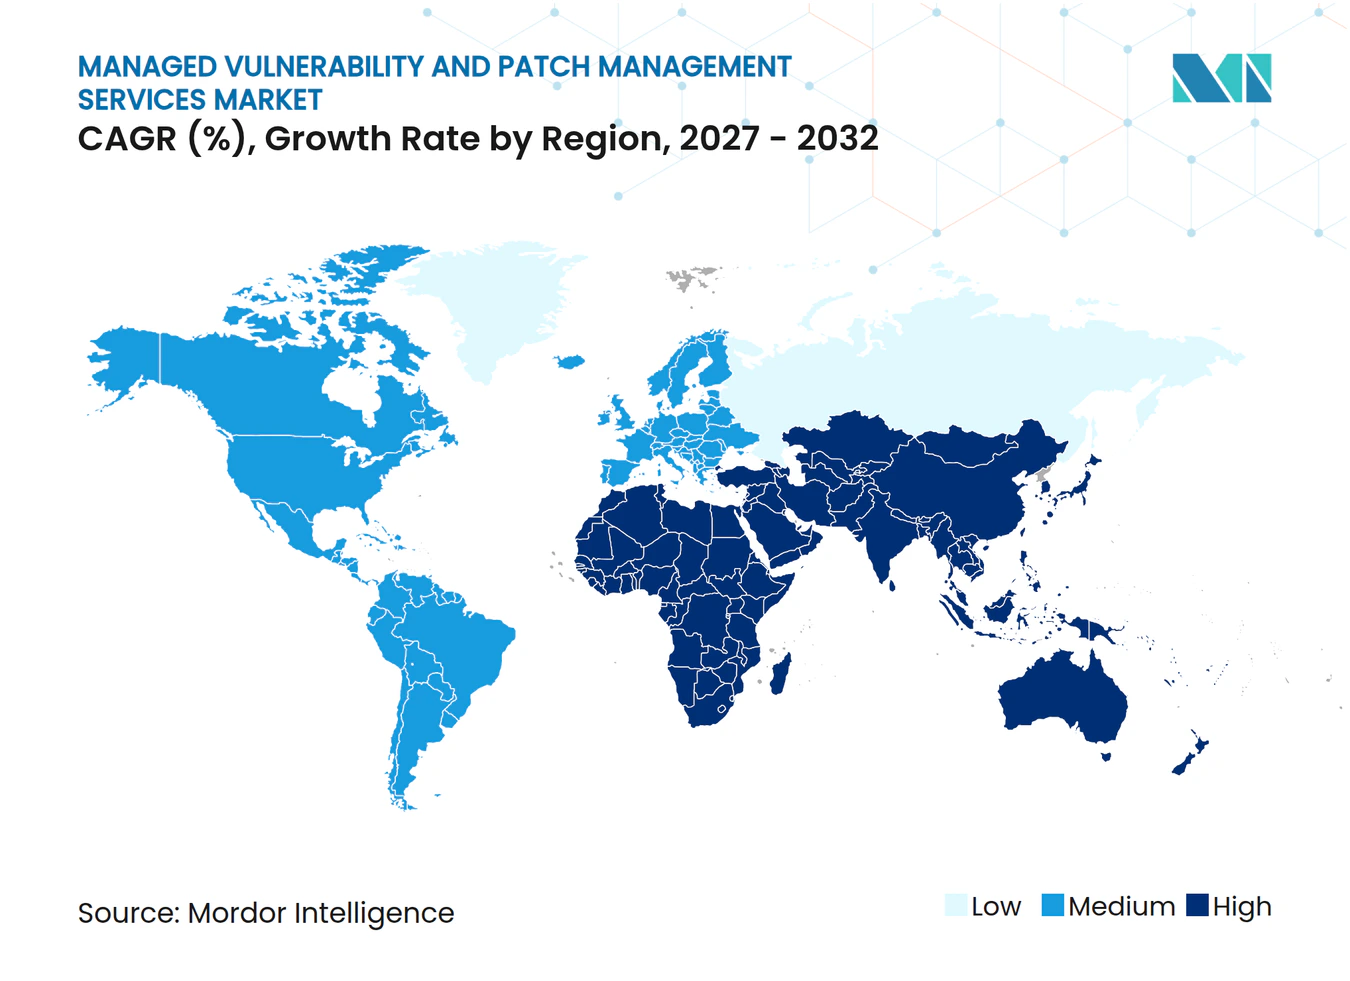
- By geography, North America held 39.63% share in 2026, while Asia-Pacific is projected to expand at a 16.36% CAGR through 2032.
Note: Market numbers in this report are based on Mordor Intelligence's proprietary estimation framework, which combines nine months of actuals with Q4 projections for base year 2026.
Global Managed Vulnerability and Patch Management Services Market Trends and Insights
Drivers Impact Analysis*
| Driver | (~) % Impact on CAGR Forecast | Geographic Relevance | Impact Timeline |
|---|---|---|---|
| Escalating Exploitation of Known Vulnerabilities | +3.5% | Global, most urgent in North America and Europe | Short term (≤ 2 years) |
| Regulatory Evidence and Patch-SLA Requirements | +2.8% | North America and EU core, spill-over to Asia-Pacific | Medium term (2-4 years) |
| Cloud, Hybrid Work, and Distributed Endpoint Expansion | +2.4% | Global, fastest uptake in Asia-Pacific and Europe | Medium term (2-4 years) |
| Cybersecurity Talent Shortages and Outsourcing Demand | +2.0% | Global, most acute in Asia-Pacific and Middle East | Long term (≥ 4 years) |
| Exposure Debt From AI-Accelerated Discovery | +1.7% | North America and Europe early, Asia-Pacific catching up | Medium term (2-4 years) |
| Third-Party Application and Browser Patch Sprawl | +1.2% | Global | Short term (≤ 2 years) |
| Source: Mordor Intelligence | |||
Escalating Exploitation of Known Vulnerabilities Drives Immediate Remediation Urgency
The managed vulnerability and patch management services market benefits when the interval between disclosure and exploitation becomes shorter. Cisco Talos reported 48,196 published CVEs in 2025, equal to 132 per day.[1] CISA added 241 entries to its Known Exploited Vulnerabilities catalog in 2025, compared with 186 entries in 2024. Google Threat Intelligence Group tracked 90 zero-day vulnerabilities exploited in the wild during 2025. Older weaknesses are also creating a continuing remediation burden for enterprise teams. Cisco Talos found that 39% of 2025 KEV entries came from vulnerabilities disclosed in 2024 or earlier.
Regulatory Evidence and Patch-SLA Requirements Create Mandatory Remediation Floors
Regulatory requirements are making documented patch governance a more consistent buying requirement. The NIS2 framework requires essential and important entities to address vulnerabilities without delay. Its guidance also places importance on policies, traceable implementation, and records of cybersecurity risk management. These requirements make remediation evidence more important for service buyers. The managed vulnerability and patch management services market is gaining from this need for repeatable and auditable operations. In the United States, public company disclosure requirements increase management attention to cybersecurity governance. SEC guidance requires registrants to disclose material cybersecurity incidents and describe relevant risk-management processes.
Cloud, Hybrid Work, and Distributed Endpoint Expansion Widen the Addressable Attack Surface
Enterprise estates now include local servers, employee endpoints, cloud workloads, application interfaces, and containerized services. Each asset group can have different operating systems, maintenance schedules, and responsible owners. This creates a broader need for coordinated discovery and remediation. Google Cloud has integrated container image vulnerability scanning into Security Command Center capabilities. The integration shows that vulnerability management is being incorporated into cloud operating environments. The managed vulnerability and patch management services market can address organizations that need support across these separate environments.
Cybersecurity Talent Shortages and Outsourcing Demand Expand Managed Service Use
Security staffing constraints are increasing interest in outside operating support. ISC2 reported that 20% of organizations use outsourcing to address cybersecurity skills gaps. The same study found that 19% use third-party service providers as part of their workforce strategy. This demand extends beyond one-time advisory work into continuing coverage for detection, prioritization, and remediation. It also supports co-managed arrangements where internal teams retain oversight. The managed vulnerability and patch management services market is well placed to serve these mixed operating models. Healthcare illustrates the broader effect of skills shortages on managed security adoption. LevelBlue reported that 44% of healthcare organizations planned to use managed security service providers within 2 years.
Restraints Impact Analysis*
| Restraint | (~) % Impact on CAGR Forecast | Geographic Relevance | Impact Timeline |
|---|---|---|---|
| Patch Compatibility and Business Downtime Risk | -2.4% | Global, most severe in manufacturing and energy OT sectors | Short term (≤ 2 years) |
| Legacy Systems and Fragmented Endpoint Estates | -1.8% | Global, most pronounced in Asia-Pacific and South America | Long term (≥ 4 years) |
| Patch Exception Backlogs in OT and Unsupported Estates | -1.4% | North America, Europe, Asia-Pacific industrial sectors | Medium term (2-4 years) |
| Weak Asset Ownership and Remediation Accountability | -0.9% | Global | Medium term (2-4 years) |
| Source: Mordor Intelligence | |||
Patch Compatibility and Business Downtime Risk Slow Deployment Velocity
A technically valid patch cannot always be deployed when security teams identify it. Industrial and energy operators may need to perform device shutdowns and obtain operator approvals before changing firmware. Automation.com noted that approval to patch some power infrastructure devices can take months. During that period, additional vulnerabilities can arise on the same systems. This limitation affects providers' ability to meet aggressive remediation targets. It also raises the value of careful testing and controlled deployment plans. Qualys introduced AI Patch Reliability scoring in February 2026 to assess stability risk and known issues before deployment. The capability reflects demand for better decision support before an update reaches production systems. Service providers must balance exposure reduction with operational continuity.
Legacy Systems and Fragmented Endpoint Estates Create Chronic Coverage Gaps
Some assets cannot be remediated through conventional patch deployment. They may run unsupported operating systems, lack vendor updates, or sit in environments where agents cannot operate. A 2025 arXiv study found that 13% of OT-related KEV entries included vendor workarounds or mitigations. The study found no such practical non-patch guidance for 87% of the related entries. These limits can leave organizations with continuing exposure even after they adopt a managed service. Providers must therefore use compensating controls alongside patch deployment. Network segmentation, configuration changes, virtual patching, and better asset ownership can reduce risk where direct updates are unavailable. These services require deeper knowledge of the customer environment and can take longer to implement.
*Our forecasts treat driver/restraint impacts as directional, not additive. The impact forecasts reflect baseline growth, mix effects, and variable interactions.
Segment Analysis
By Service Type: Remediation Accountability Reshapes the Value Chain
Managed Vulnerability Management Services held 32.47% market share in the managed vulnerability and patch management services market in 2026. This service provides continuous discovery, scanning, risk scoring, prioritization, and ongoing program management. It is the most established category because many organizations first need a complete view of their assets and weaknesses. Vulnerability Scanning and Assessment Services remain necessary, but scanning alone is becoming less differentiated when similar functions are built into cloud and endpoint platforms. Managed Patch Management Services provides the execution layer that converts findings into device updates. Compliance, Reporting, and Advisory Services adds evidence and guidance for organizations with formal reporting duties.
Remediation Orchestration and Verification Services is projected to grow at a 15.73% CAGR through 2032. Buyers are asking providers to show that an identified weakness has been assigned, addressed, and verified. Tenable completed the acquisition of Vulcan Cyber in February 2025 for USD 150 million.[2] The transaction added automated remediation workflows, risk prioritization, and more than 100 third-party integrations to Tenable One. This supports a service model that connects vulnerability findings with ticketing, ownership, deployment, and proof of closure. The managed vulnerability and patch management services industry is increasingly organized around this broader accountability model.



By Service Delivery Model: Co-Managed Architectures Gain Ground Against Full Outsourcing
Fully managed services held 39.83% of the market in 2026. This model is suited to organizations that need a provider to operate most of the vulnerability and patch management process. It can include asset discovery, prioritization, change coordination, reporting, and verification. Small and mid-sized organizations often choose this structure when they cannot maintain specialist teams around the clock. Larger organizations also use it for selected environments or regional operations. The model remains important where an internal security team has limited capacity for remediation follow-through.
Co-Managed services are projected to grow at a 16.17% CAGR through 2032. This model allows organizations to keep internal ownership of selected stages while adding provider capacity where it is most needed. Internal teams may retain policy setting, prioritization, or governance responsibilities. External teams can support patch execution, exception management, reporting, and workflow coordination. This arrangement is useful in regulated settings where management accountability cannot be fully delegated. It also responds to skills shortages without requiring an organization to replace its existing security team. Monitoring-Only, Advisory, Staff Augmentation, and Incident-Triggered services continue to serve clients with more limited or episodic requirements.
By Asset Coverage: Container Security Becomes the High-Growth Frontier
Endpoints and Servers held 34.27% of the managed vulnerability and patch management services market in 2026. Organizations have long invested in endpoint agents, device inventories, and server management tools. These assets fit established scanning and patching methods because ownership and operating schedules are usually clearer. Network and Infrastructure coverage remains important for firewalls, VPNs, switches, and routers. Cisco Talos reported that network and infrastructure products accounted for 54 of the 241 KEV additions in 2025. Applications, APIs, and Databases also need attention as organizations add more externally connected services.
Cloud Workloads and Containers are projected to grow at a 16.63% CAGR through 2032. Containerized architectures can be created and removed quickly, making fixed patch schedules less suitable. Microsoft described gaps in EDR visibility across many cloud workloads and edge environments. Providers need cloud-native discovery, image assessment, runtime monitoring, and integration with development workflows. Operational Technology, Internet of Things, and Mobile Devices remain difficult categories because vendors, operating conditions, and patch options vary widely. The managed vulnerability and patch management services industry must support these assets without applying a uniform desktop patching approach.
By Deployment Model: Hybrid Closes the Gap on Pure-Cloud Deployments
Cloud-Based deployment held 60.83% share in 2026. SaaS-delivered platforms reduce the need for local infrastructure and can support continuous analysis across many locations. They can also simplify updates to scanning logic and management interfaces. These benefits are useful for distributed organizations with multiple device groups. Cloud delivery supports centralized reporting for teams managing large, evolving technology estates. It remains the leading model because many buyers want faster implementation and lower administrative overhead.
Hybrid deployment is projected to grow at a 16.44% CAGR through 2032. Large enterprises and regulated organizations are unlikely to migrate all workloads to a cloud environment within the forecast period. Hybrid models combine centralized orchestration with separate handling for local, air-gapped, or data-sensitive systems. Action1 announced India data residency, effective April 1, 2026, demonstrating how vendors are adapting cloud delivery to meet local compliance expectations.

By End-User Industry: Healthcare's Structural Vulnerability Creates a High-Growth Vertical
BFSI held 24.37% share in 2026. Financial institutions operate under extensive security, resilience, and reporting requirements. They also manage many customer-facing systems, third-party links, and sensitive data repositories. This combination raises the operational importance of disciplined remediation and clear evidence. ABI reported that Italian banks were expected to allocate EUR 500 million (USD 540 million) to information security in 2026. The report identified vulnerability management and compliance reporting as investment priorities.
Healthcare is projected to grow at a 16.51% CAGR through 2032. Clinical devices, connected systems, and sensitive records create a demanding operating environment for remediation teams. Northeastern University announced a hospital cybersecurity project, supported by ARPA-H UPGRADE, with up to USD 19 million in 2025. The work treats hospital vulnerability management as a critical operational concern. IT and Telecommunications, Manufacturing, Government and Defense, and Energy and Utilities also have complex requirements. Retail and E-Commerce, Education, Hospitality and Travel, and other sectors are expanding their managed security programs as ransomware risks spread across a wider set of targets.
Geography Analysis
North America held 39.63% of regional revenue in 2026. The United States is the main demand center because federal remediation practices, public company disclosure obligations, and regulated enterprise requirements support spending. CISA’s KEV catalog gives many organizations a practical list for prioritizing exploited vulnerabilities. SEC disclosure guidance also places cybersecurity risk processes under closer senior management attention. Canada is developing demand through financial-sector security expectations. Mexico is gaining relevance as manufacturing and energy organizations address cross-border supply-chain security requirements.
Europe was the second-largest regional market in 2026. NIS2, DORA, and national requirements are shaping service demand across financial services and essential infrastructure. Germany and the United Kingdom remain leading sources of regional revenue. France, Italy, and Spain are also increasing managed security investment. ENISA published a managed security services market analysis in 2026 that provides supply-side and demand-side information for the European Union. The publication supports clearer expectations for service definitions and buyer requirements.
Asia-Pacific is projected to expand at a 16.36% CAGR through 2032, the fastest regional rate in the managed vulnerability and patch management services market. The region combines growing digital infrastructure with tight cybersecurity staffing conditions. Japan has a clear automation need, with Trend Micro reporting a 36.4-day mean time to patch in March 2025. This was 1.2 times the global average reported in the input research. South Korea is increasing attention to security after 2025 data breaches affected connected institutions. South America is an emerging opportunity as enterprises adopt managed security for the first time. Middle East investment is supported by national digitization programs and financial-sector requirements, while Africa remains earlier in adoption.
Competitive Landscape
Market Concentration
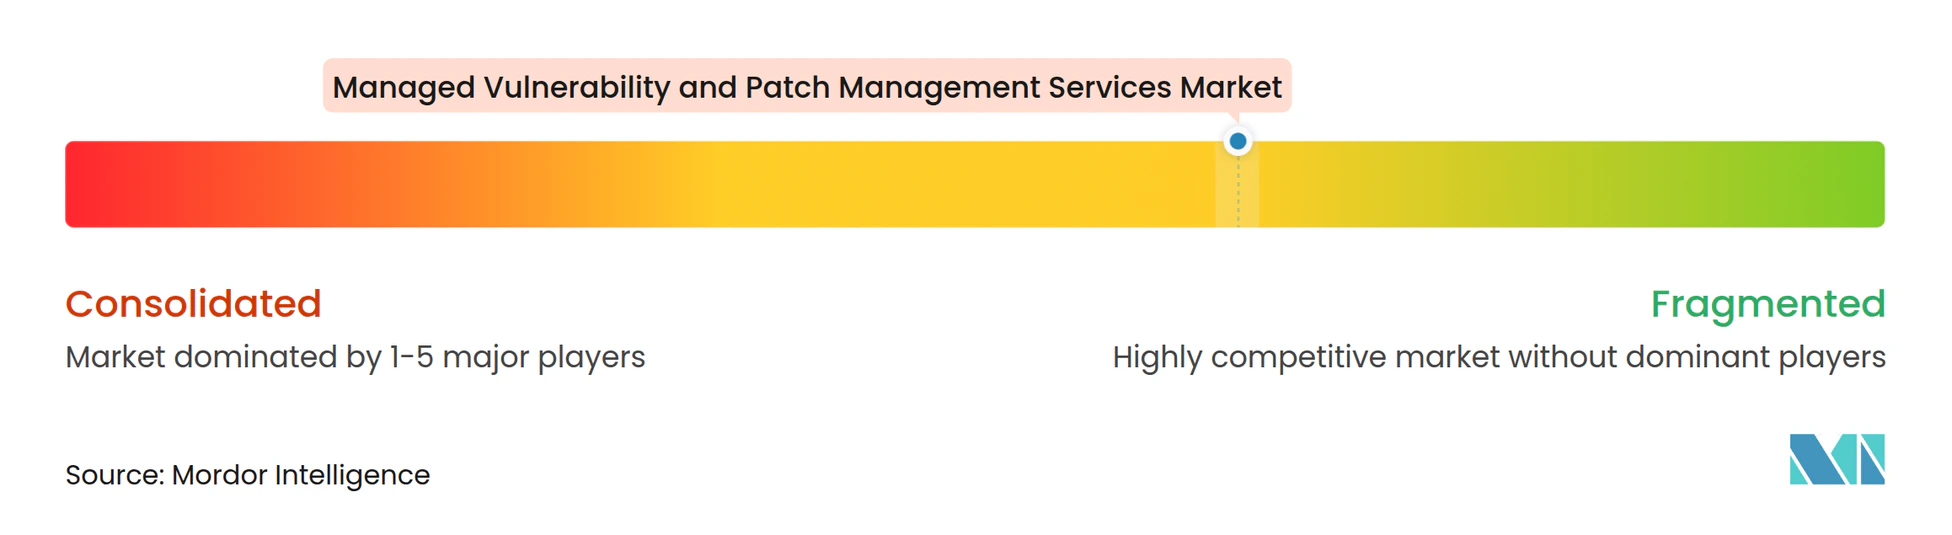
The managed vulnerability and patch management services market is moderately fragmented among service providers, with increasing consolidation among platform vendors. Tenable, Qualys, and CrowdStrike are building more integrated offerings across discovery, prioritization, and remediation. CrowdStrike introduced risk-based patching for IT through Falcon in 2025. Tenable’s acquisition of Vulcan Cyber also expanded its remediation workflow capabilities. These actions reduce the space available to narrowly focused tools. They also place greater pressure on managed providers to show operational results rather than only technical detection.
Service firms such as Kyndryl, Accenture, and Optiv compete through global delivery, compliance support, and experience with multi-vendor customer estates. Kyndryl and Microsoft launched the Kyndryl Microsoft Acceleration Hub in July 2025.[3] The collaboration combines Kyndryl Consult services with Microsoft Azure AI Foundry and Security Copilot to enable industry-specific automation. Arctic Wolf introduced Aurora Exposure Management in May 2026, bringing vulnerability management, attack surface management, and native patch management together. The managed vulnerability and patch management services market is thus becoming more competitive across both software platforms and service delivery.
Operational technology and Internet of Things environments remain an important competitive opening. Few vendors offer pre-certified services that align vulnerability work with industrial change controls. Providers must combine asset visibility with knowledge of safety, downtime, and vendor approval requirements. This favors firms that can work across information technology and operational technology environments. Microsoft also introduced Security Copilot agents in March 2025, including a Vulnerability Remediation Agent for Microsoft Intune. Such product moves are increasing the role of automation in established endpoint management ecosystems.
Managed Vulnerability and Patch Management Services Industry Leaders
-
Accenture plc
-
Arctic Wolf Networks, Inc.
-
Cisco Systems, Inc.
-
CrowdStrike Holdings, Inc.
-
International Business Machines Corporation
- *Disclaimer: Major Players sorted in no particular order
Recent Industry Developments
- October 2026: Qualys released TruRisk Eliminate 4.2.1, introducing Agent Sara, an AI system that groups vulnerability findings into operational impact waves and generates ring-based patch deployment jobs, Lab, Staging, and Production, that halt faulty patches before they reach production environments. The release marked a significant step toward autonomous remediation orchestration within the Qualys managed vulnerability platform.
- September 2026: Qualys launched TruRisk Eliminate 4.1, consolidating Patch, Mitigate, and Isolate capabilities into a single unified application and introducing new Overview and Operational Status dashboards. The release enabled security teams to track remediation velocity and exposure status in a single interface rather than across separate product modules.
- May 2026: Arctic Wolf introduced Aurora Exposure Management, a new product family combining Aurora Vulnerability Management and Aurora Attack Surface Management with a native patch management add-on called Resolve. The launch positioned Arctic Wolf as a full-cycle exposure management provider extending its SOC platform from detection into proactive vulnerability remediation for more than 10,000 customers.
- July 2025: Kyndryl and Microsoft launched the Kyndryl Microsoft Acceleration Hub, a co-innovation facility integrating Kyndryl Consult services with Microsoft Azure AI Foundry and Security Copilot to build industry-specific security automation solutions, including vulnerability and patch management orchestration for complex enterprise environments.
Global Managed Vulnerability and Patch Management Services Market Report Scope
The managed vulnerability and patch management services market encompasses outsourced services for identifying, assessing, prioritizing, remediating, and monitoring security vulnerabilities across an organization's IT infrastructure, including endpoints, networks, servers, applications, cloud environments, and mobile devices. These services help organizations deploy software patches, updates, and security configurations to reduce cyber risks and maintain regulatory compliance.
The Managed Vulnerability and Patch Management Services Market Report is Segmented by Service Type (Managed Vulnerability Management Services, Managed Patch Management Services, Vulnerability Scanning and Assessment Services, Remediation Orchestration and Verification Services, and Compliance, Reporting, and Advisory Services), Service Delivery Model (Fully Managed, Co-Managed, Monitoring-Only, and Advisory, Staff Augmentation, and Incident-Triggered), Asset Coverage (Network and Infrastructure, Endpoints and Servers, Cloud Workloads and Containers, Applications, APIs, and Databases, and Operational Technology, Internet of Things, and Mobile Devices), Deployment Model (On-Premises, Cloud-Based, and Hybrid), End-User Industry (Information Technology and Telecommunications, BFSI, Healthcare, Retail and E-Commerce, Manufacturing, Government and Defense, Education, Energy and Utilities, Transportation and Logistics, Hospitality and Travel, and Other End-User Industries), and Geography (North America, South America, Europe, Asia-Pacific, Middle East, and Africa). The Market Forecasts are Provided in Terms of Value (USD).
| Managed Vulnerability Management Services |
| Managed Patch Management Services |
| Vulnerability Scanning and Assessment Services |
| Remediation Orchestration and Verification Services |
| Compliance, Reporting, and Advisory Services |
| Fully Managed |
| Co-Managed |
| Monitoring-Only |
| Advisory, Staff Augmentation, and Incident-Triggered |
| Network and Infrastructure |
| Endpoints and Servers |
| Cloud Workloads and Containers |
| Applications, APIs, and Databases |
| Operational Technology, Internet of Things, and Mobile Devices |
| On-Premises |
| Cloud-Based |
| Hybrid |
| Information Technology and Telecommunications |
| BFSI |
| Healthcare |
| Retail and E-Commerce |
| Manufacturing |
| Government and Defense |
| Other End-User Industries |
| North America | United States |
| Canada | |
| Mexico | |
| South America | Brazil |
| Argentina | |
| Rest of South America | |
| Europe | Germany |
| United Kingdom | |
| France | |
| Italy | |
| Spain | |
| Russia | |
| Rest of Europe | |
| Asia-Pacific | China |
| India | |
| Japan | |
| South Korea | |
| Australia | |
| Rest of Asia-Pacific | |
| Middle East | Saudi Arabia |
| United Arab Emirates | |
| Turkey | |
| Rest of Middle East | |
| Africa | South Africa |
| Egypt | |
| Nigeria | |
| Rest of Africa |
| By Service Type | Managed Vulnerability Management Services | |
| Managed Patch Management Services | ||
| Vulnerability Scanning and Assessment Services | ||
| Remediation Orchestration and Verification Services | ||
| Compliance, Reporting, and Advisory Services | ||
| By Service Delivery Model | Fully Managed | |
| Co-Managed | ||
| Monitoring-Only | ||
| Advisory, Staff Augmentation, and Incident-Triggered | ||
| By Asset Coverage | Network and Infrastructure | |
| Endpoints and Servers | ||
| Cloud Workloads and Containers | ||
| Applications, APIs, and Databases | ||
| Operational Technology, Internet of Things, and Mobile Devices | ||
| By Deployment Model | On-Premises | |
| Cloud-Based | ||
| Hybrid | ||
| By End-User Industry | Information Technology and Telecommunications | |
| BFSI | ||
| Healthcare | ||
| Retail and E-Commerce | ||
| Manufacturing | ||
| Government and Defense | ||
| Other End-User Industries | ||
| By Geography | North America | United States |
| Canada | ||
| Mexico | ||
| South America | Brazil | |
| Argentina | ||
| Rest of South America | ||
| Europe | Germany | |
| United Kingdom | ||
| France | ||
| Italy | ||
| Spain | ||
| Russia | ||
| Rest of Europe | ||
| Asia-Pacific | China | |
| India | ||
| Japan | ||
| South Korea | ||
| Australia | ||
| Rest of Asia-Pacific | ||
| Middle East | Saudi Arabia | |
| United Arab Emirates | ||
| Turkey | ||
| Rest of Middle East | ||
| Africa | South Africa | |
| Egypt | ||
| Nigeria | ||
| Rest of Africa | ||
Key Questions Answered in the Report
What is the managed vulnerability and patch management services market size?
The managed vulnerability and patch management services market is projected to increase from USD 4.63 billion in 2026 to USD 10.87 billion by 2032, at a 15.36% CAGR from 2027 to 2032.
What is driving demand for managed vulnerability and patch management services?
Faster exploitation, regulatory patch governance requirements, cloud expansion, and cybersecurity staffing gaps are supporting demand. The managed vulnerability and patch management services market addresses these pressures by providing continuous operational support rather than only periodic assessments.
Which service type is growing fastest?
Remediation Orchestration and Verification Services is projected to grow at a 15.73% CAGR through 2032 as buyers seek verified closure.
Which deployment model leads adoption?
Cloud-Based deployment held 60.83% share in 2026, while Hybrid deployment is projected to grow fastest at a 16.44% CAGR through 2032.
Which end-user sector has the highest growth outlook?
Healthcare is projected to grow at a 16.51% CAGR through 2032 due to clinical device exposure, compliance needs, and operating continuity requirements.
Which region is projected to grow fastest?
Asia-Pacific is projected to grow at a 16.36% CAGR through 2032, supported by digitalization, cyber investment, and outsourcing needs.