
Managed Virtual Desktop Operations Services Market Size and Share
Market Overview
| Study Period | 2021 - 2032 |
|---|---|
| Market Size (2027) | USD 5.52 Billion |
| Market Size (2032) | USD 10.43 Billion |
| Growth Rate (2027 - 2032) | 13.57 % |
| Fastest Growing Market | Asia-Pacific |
| Largest Market | North America |
| Market Concentration | Medium |
Major Players *Disclaimer: Major Players sorted in no particular order Image © Mordor Intelligence. Reuse requires attribution under CC BY 4.0. | |
Managed Virtual Desktop Operations Services Market Analysis by Mordor Intelligence
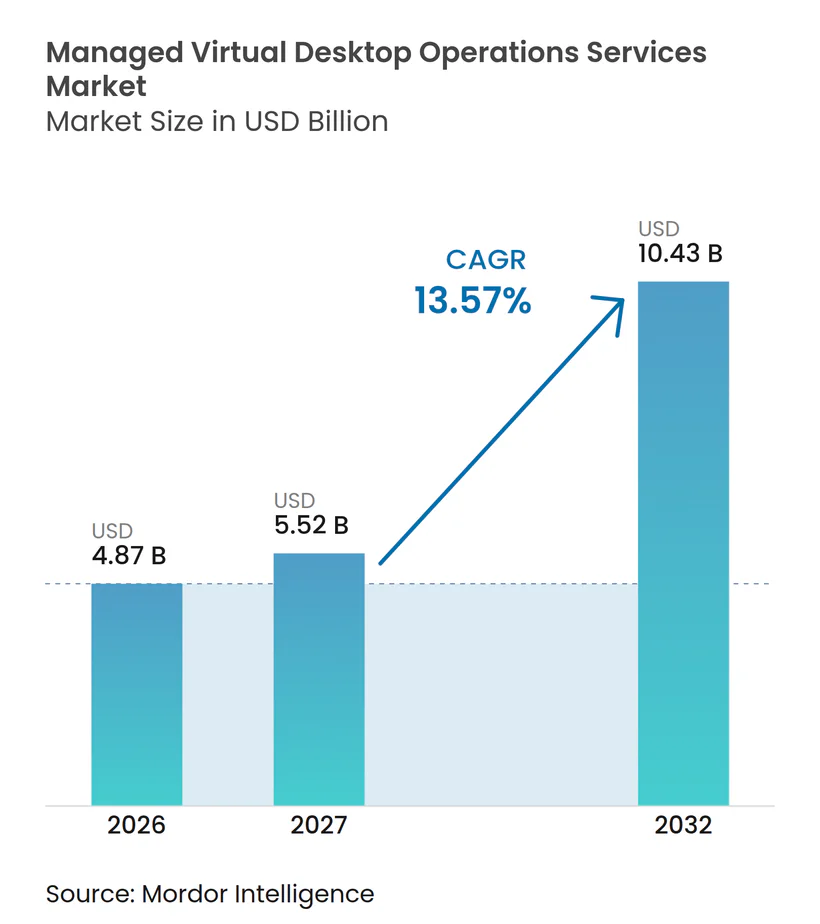
The Managed virtual desktop operations services market size is projected to expand from USD 4.87 billion in 2026 and USD 5.52 billion in 2027 to USD 10.43 billion by 2032, registering a CAGR of 13.57% between 2027 to 2032. The shift from self-managed virtual desktop infrastructure to managed delivery is changing how organizations plan desktop operations, technical support, lifecycle management, and accountability for user outcomes across increasingly distributed workforce environments. Windows 10 support ended in October 2025, while licensing changes after Broadcom acquired VMware have raised the cost and complexity of many existing estates. These conditions make phased hybrid contracts more relevant because they can support migration without forcing an immediate replacement of installed systems, applications, desktop images, or business processes that still depend on established local infrastructure. Hybrid work has also made desktop operations more complex because enterprises often run several cloud and on-premises platforms at the same time, each with distinct licensing terms, security settings, user groups, and administrative tools. The Managed virtual desktop operations services market therefore offers providers an opportunity to combine platform management, security controls, service desk support, experience monitoring, reporting, and structured migration support in one contract that gives buyers a clearer operating model.
Key Report Takeaways
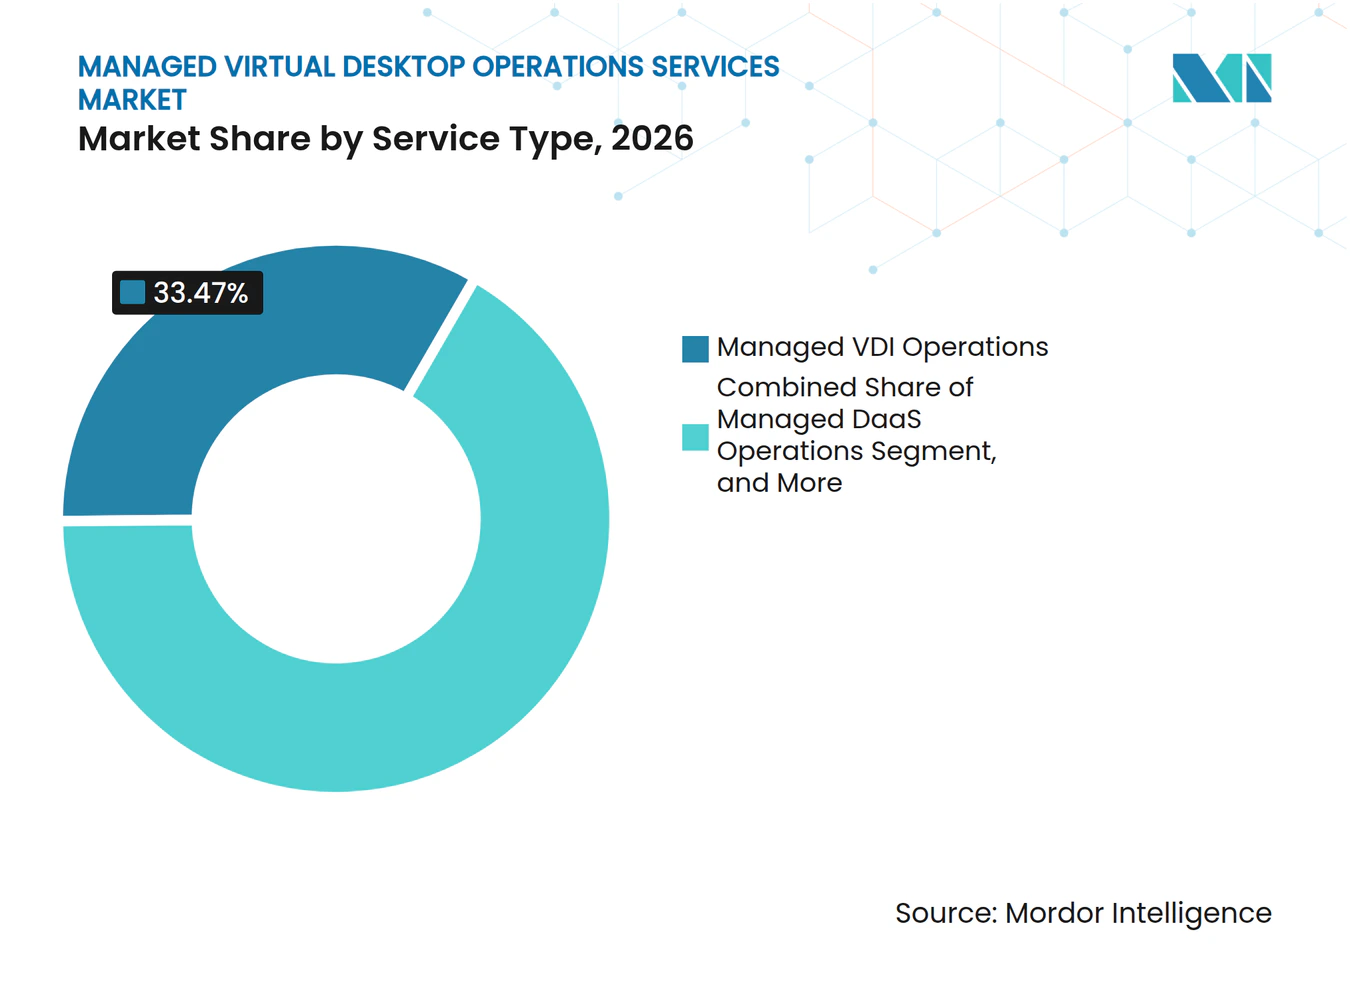
- By service type, Managed VDI Operations held 33.47% of the Managed virtual desktop operations services market share in 2026, while Managed DaaS Operations is projected to expand at a 14.23% CAGR through 2032.
- By enterprise size, large enterprises held 71.83% of the Managed virtual desktop operations services market share in 2026, while SMEs are projected to expand at a 14.87% CAGR through 2032.
- By desktop persistence, non-persistent desktops held 54.27% of the Managed virtual desktop operations services market share in 2026, while persistent desktops are projected to expand at a 14.63% CAGR through 2032.
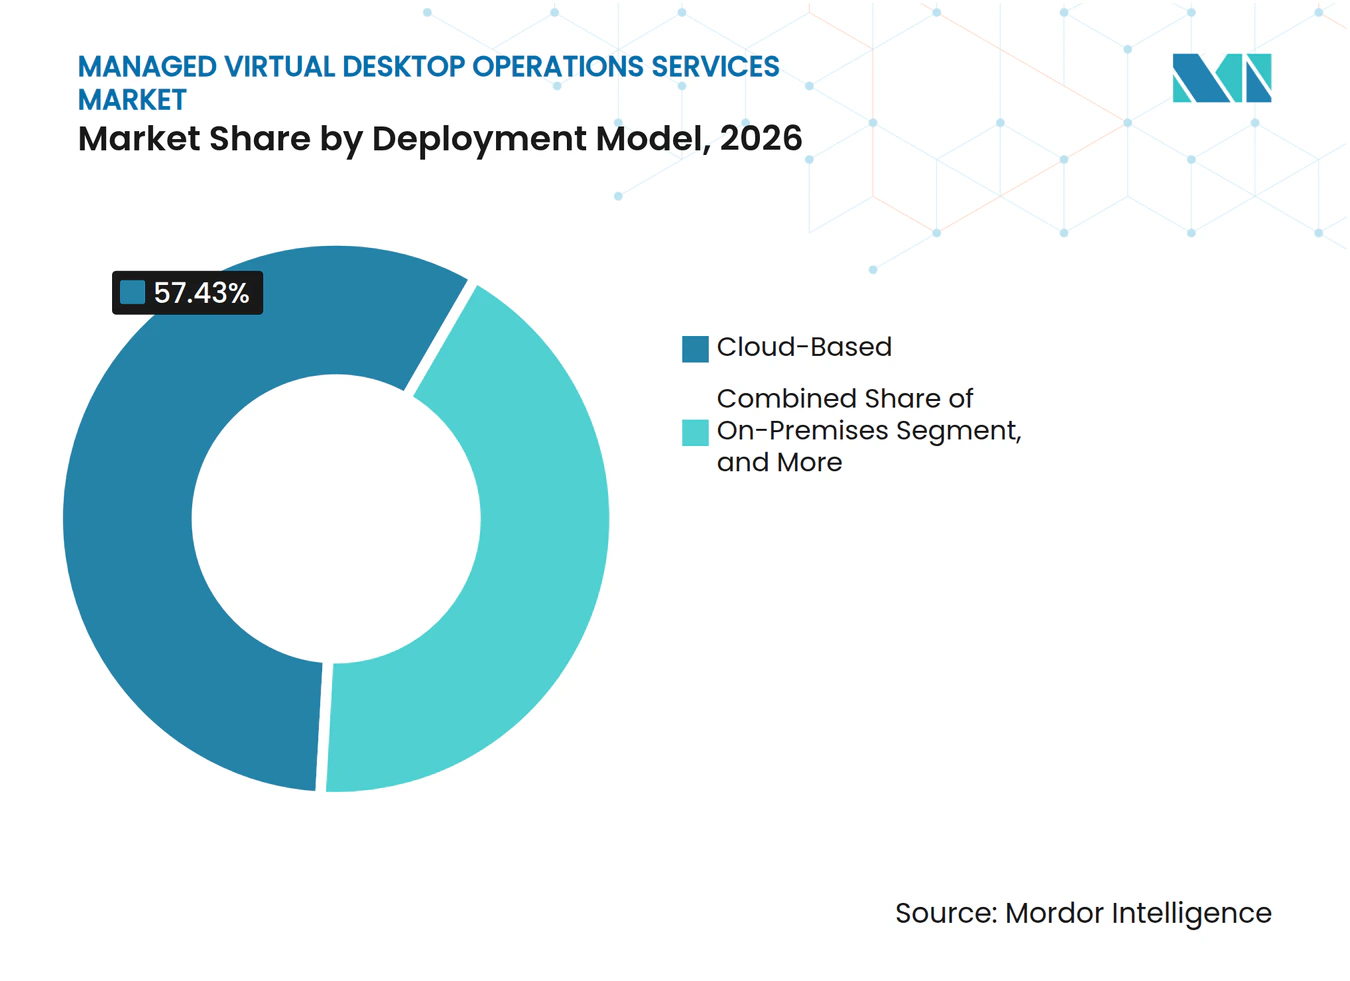
- By deployment model, cloud-based deployment held 57.43% of the Managed virtual desktop operations services market share in 2026, while hybrid deployment is projected to expand at a 14.26% CAGR through 2032.
- By end-user industry, information technology and telecommunications held 24.37% of the Managed virtual desktop operations services market share in 2026, while healthcare is projected to expand at a 14.42% CAGR through 2032.
- By geography, North America held 40.63% of the Managed virtual desktop operations services market share in 2026, while Asia-Pacific is projected to expand at a 14.93% CAGR through 2032.
Note: Market numbers in this report are based on Mordor Intelligence's proprietary estimation framework, which combines nine months of actuals with Q4 projections for base year 2026.
Market Trends and Insights
Drivers Impact Analysis of Managed Virtual Desktop Operations Services Market*
| Driver | (~) % Impact on CAGR Forecast | Geographic Relevance | Impact Timeline |
|---|---|---|---|
| Hybrid and Remote Work Normalization | +3.2% | Global | Short term (≤ 2 years) |
| Centralized Security and Compliance Requirements | +2.8% | North America and Europe | Medium term (2-4 years) |
| Cloud Migration and Flexible Infrastructure Consumption | +2.4% | Global | Medium term (2-4 years) |
| Shortage of Specialized End-User Computing Talent | +1.9% | North America, Europe, Asia-Pacific | Medium term (2-4 years) |
| AI-Assisted Operations and Experience Analytics | +1.6% | Global | Long term (≥ 4 years) |
| Sovereign and Air-Gapped Virtual Desktop Demand | +1.0% | Europe, Middle East, Asia-Pacific | Long term (≥ 4 years) |
| Source: Mordor Intelligence | |||
Hybrid and Remote Work Normalization
Hybrid work now requires continuing operational support rather than a temporary response program. Organizations commonly manage Azure Virtual Desktop, Windows 365, Citrix DaaS, and Omnissa Horizon together, which raises the need for coordinated governance. Managing hybrid environments was the leading barrier to modernization for 47% of respondents, ahead of cost optimization at 30%. The Managed virtual desktop operations services market benefits when providers can migrate workloads, standardize operating practices, and reduce the burden of multiple administration tools.
Centralized Security and Compliance Requirements
Security requirements have shifted managed desktop purchasing toward centralized controls and formal service accountability. Managed virtual desktops can apply policy at the session layer and keep sensitive information off local endpoints. This approach is relevant for healthcare, financial services, and government organizations that need consistent evidence for audits. The Managed virtual desktop operations services market gains from contracts that include continuous compliance reporting, encrypted access, and automated evidence collection.
Cloud Migration and Flexible Infrastructure Consumption
Cloud migration is gaining momentum as licensing and endpoint replacement decisions converge. Broadcom reported infrastructure software revenue of USD 27.03 billion in fiscal 2025, up from USD 21.48 billion in fiscal 2024, following changes to its software portfolio and commercial model. Microsoft ended support for Windows 10 in October 2025, while Azure Virtual Desktop and Windows 365 offer cloud-hosted Windows 10 sessions with Extended Security Updates. Nerdio secured a USD 500 million Series C investment in March 2025 at a USD 1.2 billion valuation to expand its automation platform for Azure Virtual Desktop, Windows 365, and Microsoft 365.[1] Organizations often incur overlapping costs when maintaining on-premises systems during a cloud transition.
Shortage of Specialized End-User Computing Talent
The shortage of specialized end-user computing staff supports demand for external operating teams. Enterprise desktop environments now require knowledge of virtual desktop infrastructure, cloud PCs, unified endpoint management, identity controls, and experience analytics. The required skills also vary by platform, making it difficult for a single internal team to scale across a mixed estate. This issue is especially important for mid-sized organizations that cannot maintain separate specialists for every platform. Providers can use automation to manage repeated tasks while reserving specialist staff for complex incidents and migration work.
Restraints Impact Analysis of Managed Virtual Desktop Operations Services Market*
| Restraint | (~) % Impact on CAGR Forecast | Geographic Relevance | Impact Timeline |
|---|---|---|---|
| Bandwidth, Latency, and End-User Experience Limitations | -1.8% | Asia-Pacific core, spill-over to Middle East and Africa | Short term (≤ 2 years) |
| Total Cost Uncertainty Versus Amortized Infrastructure | -1.4% | Global | Medium term (2-4 years) |
| Proprietary Protocol and Platform Lock-In | -0.9% | Europe and North America | Medium term (2-4 years) |
| Application Modernization and GPU Capacity Bottlenecks | -0.7% | North America and Europe | Long term (≥ 4 years) |
| Source: Mordor Intelligence | |||
Bandwidth, Latency, and End-User Experience Limitations
Network quality remains a practical limit on virtual desktop adoption, particularly for users located far from regional cloud capacity. Nexthink reported in 2025 that 89% of VDI operational teams receive regular user escalations, and 31% receive them daily. GPU-heavy work, such as design, rendering, and AI-assisted desktop tasks, needs both strong display performance and low latency. Providers can reduce the problem through regional capacity, edge computing, proactive monitoring, and workload placement. Network infrastructure outside the provider's control still determines the final experience for many users in the Managed virtual desktop operations services market.
Total Cost Uncertainty Versus Amortized Infrastructure
Variable cloud consumption can make managed desktop budgets harder to forecast than a fully amortized internal estate. Costs vary with usage patterns, storage, graphics capacity, and per-seat licensing, making simple price comparisons unreliable. The Software Association of Japan reported that an on-premises VDI deployment for 1,200 users required JPY 560 million (USD 3.6 million) in initial investment and equated to JPY 7,783 (USD 49.90) per user per month over 60 months. Existing data center equipment can also pose a barrier, as organizations must account for the value of systems that remain usable. Committed-use pricing and phased hybrid contracts can reduce this concern by allowing workloads to move in stages.
*Our forecasts treat driver/restraint impacts as directional, not additive. The impact forecasts reflect baseline growth, mix effects, and variable interactions.
Managed Virtual Desktop Operations Services Market Segment Analysis
By Service Type:
Managed DaaS Operations Reshapes the Revenue MixManaged VDI Operations accounted for 33.47% of the Managed virtual desktop operations services market share in 2026, reflecting the continued importance of installed VDI estates that have not fully moved to the cloud. Many organizations retain these environments because they hold established images, application dependencies, and security processes. Managed VDI providers support these clients with monitoring, image management, patching, security controls, and incident response. The service allows organizations to improve daily desktop operations without initiating an immediate, comprehensive migration program that could disrupt critical operations. Managed Application and Session Virtualization remains relevant where users need individual applications rather than a full desktop. It supports task workers and regulated environments that require controlled access to a limited set of systems. Security, compliance, backup, and disaster recovery are also increasingly included in base contracts. This bundling moves provider responsibility beyond basic platform administration.
Managed DaaS Operations is projected to record a 14.23% CAGR through 2032, making it the fastest-growing service type in the Managed virtual desktop operations services market. Organizations that migrate away from legacy VDI often prefer an operating partner that takes responsibility for the delivery platform. This choice avoids recreating internal administration complexity in a public cloud environment. Image, application, and patch management are becoming more important because enterprises use several desktop platforms at once. Monitoring, service desk, and digital employee experience management are therefore becoming central parts of the service mix. The managed virtual desktop operations services industry is moving toward contracts that combine platform operations with measurable user experience commitments.



By Enterprise Size:
SME Demand Accelerates as Per-Seat Models MatureLarge enterprises held 71.83% of the Managed virtual desktop operations services market share in 2026. Their position reflects large installed estates, multi-year contracts, and the ability to commission service-level agreements that match complex internal requirements. These organizations often combine virtual desktop operations with endpoint management, service desk, identity controls, and security services. Their global workforce also creates demand for support coverage across time zones. HCLTech reported that it supports more than 14 million managed endpoint users and recorded user-base growth of more than 10% year over year across its 3 major regions in 2025.[2] Large enterprises can use managed services to standardize operations after acquisitions or during platform consolidation. They also provide providers with the contract scale needed to invest in dedicated delivery teams. Their procurement process remains demanding because buyers expect customized governance, reporting, and service levels.
SMEs are projected to expand at a 14.87% CAGR through 2032. Per-seat managed services reduce the internal staffing threshold required to deploy virtual desktops. Multi-tenant automation platforms enable managed service providers to administer multiple smaller customers within a shared operating environment. Nerdio reported more than 23,000 global customers in October 2026, including managed service providers that use centralized automation to serve smaller clients. This model lets SMEs access specialized operations without building a full desktop engineering team. Smaller accounts can change providers more easily when per-seat pricing changes, which can raise churn risk. Providers need clear service packages, simple onboarding, and predictable pricing to retain these customers. The Managed virtual desktop operations services market size for SMEs is supported by packaged offerings that make enterprise-grade controls accessible to smaller organizations.
By Desktop Persistence:
Non-Persistent Models Dominate, Persistent Desktops Gain Strategic GroundNon-persistent desktops held 54.27% of the Managed virtual desktop operations services market share in 2026. They are widely used for task workers and contact centers because every new session starts from a clean image. This structure reduces storage requirements and limits the risk of malware remaining in user-specific desktop states. It also fits centralized security models because the provider can standardize applications and settings across a broad user group. Organizations can use non-persistent pools when employee roles have similar application requirements. These desktops work well for seasonal staff, shared workstations, and standardized service teams. Their lower operational burden supports deployment in high-volume environments. Providers can also update the golden image once, rather than maintaining separate images for each user.
Persistent desktops are projected to grow at a 14.63% CAGR through 2032. They support users who need retained settings, development tools, specialized applications, or graphics resources. Design staff, engineers, developers, and AI-focused teams often need a stable desktop state that a shared pool cannot provide. Microsoft introduced a preview of Windows 365 for Agents in November 2025, positioning cloud PCs as persistent environments for AI agents that execute longer-running work. This use case broadens the demand for stateful desktop delivery. Providers are developing tiered contracts that place high-value users on persistent desktops and task workers on non-persistent pools. This balance helps clients control cost while supporting more demanding workloads across a changing employee base. The Managed virtual desktop operations services market benefits when providers can manage both desktop types through a unified operational model.
By Deployment Model:
Cloud-Based Leads While Hybrid Drives the Next Growth CycleCloud-based deployment held 57.43% of the Managed virtual desktop operations services market share in 2026. The result reflects the adoption of cloud desktop services after the Windows 10 support deadline and VMware licensing changes. Cloud deployment can speed up new desktop provisioning and allow capacity to change with workforce demand. It also reduces the need to maintain physical desktop infrastructure in every office. Some organizations use cloud desktops to support contractors, remote employees, and temporary project teams. Others use them to deliver controlled access to applications that cannot remain on endpoint devices. Cloud delivery does not eliminate management work because identity, image, security, and performance controls still require daily attention. Managed providers remain important because they bring these activities into a repeatable service model.
Hybrid deployment is projected to expand at a 14.26% CAGR through 2032. It provides organizations with a transition path when they must retain selected workloads on-premises for performance, data residency, or investment reasons. Microsoft announced Azure Virtual Desktop for hybrid environments in November 2025, extending session host support to Arc-enabled servers across Nutanix AHV, Hyper-V, VMware vSphere, and physical Windows Server infrastructure. Nutanix then confirmed public preview support for Azure Virtual Desktop Hybrid on AHV in May 2026. These options help clients use existing infrastructure while introducing cloud management capabilities. Hybrid services also give providers a role in coordinating network design, identity, security policy, and workload placement. The Managed virtual desktop operations services market size for hybrid delivery is expected to benefit as organizations seek to avoid an abrupt infrastructure write-off. The managed virtual desktop operations services industry can use these contracts to build long-term relationships through phased modernization.

By End-User Industry:
Healthcare Leads Growth as IT and Telecom Anchors DemandInformation technology and telecommunications held 24.37% of the Managed virtual desktop operations services market share in 2026. These organizations were early adopters because their distributed application environments and technical procurement teams aligned with virtual desktop delivery. They use managed desktops to support development, operations, service teams, and distributed project work. Centralized control can also help them protect source code and customer systems from unmanaged endpoints. BFSI is another important user group because centralized desktop control supports trading applications, branch standardization, and data-loss prevention. Retail and e-commerce use managed desktops to support distributed support teams and a flexible workforce. Manufacturing uses them to deliver applications to plants, engineering teams, and field locations. Government and defense demand is growing, where agencies need controlled access to sensitive systems.
Healthcare is projected to expand at a 14.42% CAGR through 2032. Clinical organizations use managed virtual desktops to provide access to electronic health records without storing patient information on local workstations. HIPAA requirements for safeguards and access controls support centralized approaches to handling protected health information. The need is operational as well as regulatory because clinicians require consistent access across hospitals, clinics, and remote care settings. Optimum Healthcare IT achieved Microsoft Azure Virtual Desktop Advanced Specialization in 2025, illustrating the healthcare-specific skills providers are building for this environment. Providers must understand clinical workflows, application access, and the importance of system availability. Education and energy also add demand through campus virtualization and mobile field work. The Managed virtual desktop operations services market can grow in these sectors when service designs reflect operational needs rather than only infrastructure requirements.
Geography Analysis
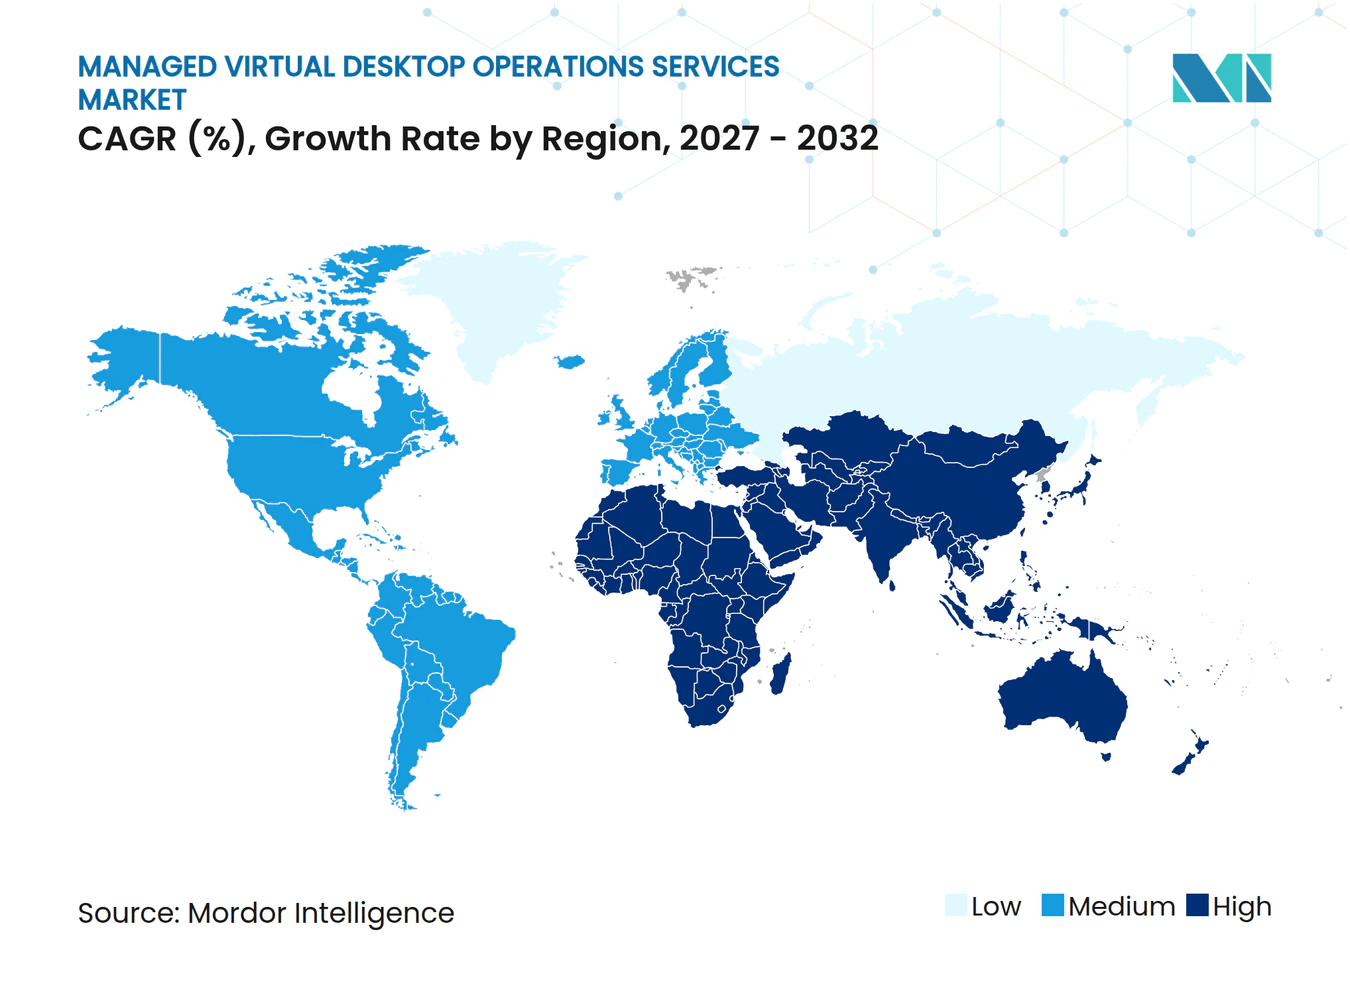
North America held 40.63% of the Managed virtual desktop operations services market share in 2026. Large enterprise budgets and regulated demand from healthcare, finance, and government support this position. The United States remains the largest contributor, aided by federal modernization activity, including CACI International's potential USD 983 million, 5-year Department of Homeland Security agreement announced in September 2025. Canada is developing sovereign offerings, as evidenced by ThinkOn and Altanora's April 2025 Desktop-as-a-Service launch for sensitive public-sector data. Mexico offers additional demand as nearshore centers support U.S.-based organizations with distributed workforces.
Europe is a substantial revenue base, led by Germany and the United Kingdom, where data residency and vendor dependency are key buying considerations. A 2025 Parallels survey reported that 94% of German information technology leaders were concerned about vendor lock-in in cloud desktop services. Providers with portable hybrid models can respond to this concern, while France, Italy, Spain, Russia, and other countries increase demand through public-sector digital programs. South America is an emerging opportunity, led by Brazil and Argentina, as cloud infrastructure supports adoption in financial services and telecommunications.
Asia-Pacific is projected to record a 14.93% CAGR through 2032, the highest regional rate in the Managed virtual desktop operations services market. Workforce scale, improving cloud infrastructure, and limited end-user computing talent support demand in Japan, India, China, South Korea, and Australia. NSW Corporation launched a managed VDI service in April 2025 using Oracle Cloud Infrastructure and Softdrive technology for Japanese manufacturing and architecture users with graphics-intensive workloads. India is both a major demand center and a delivery hub for global managed service contracts. Saudi Arabia and the United Arab Emirates are increasing procurement through sovereign cloud and government programs, while Africa remains earlier in adoption with potential from a smaller base.
Competitive Landscape
Market Concentration
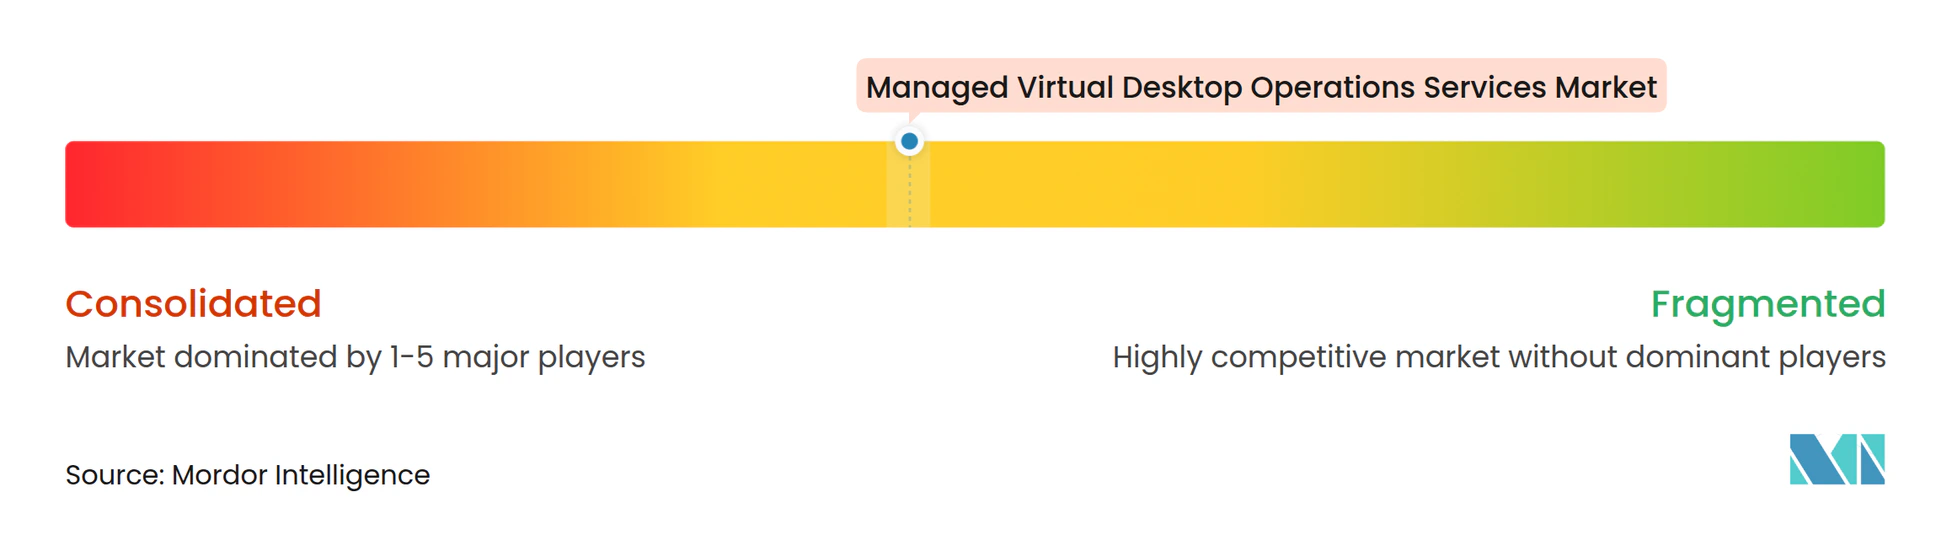
The Managed virtual desktop operations services market is moderately consolidated at the enterprise tier. Global information technology services firms compete through long-term workplace contracts that combine virtual desktop operations, endpoint management, service desk support, and security. HCLTech reported more than 14 million managed endpoint users and a user-base growth above 10% year over year across its 3 major regions in 2025. NTT DATA manages more than 7 million virtual desktops globally and uses its Azure Virtual Desktop Solution Accelerator and Smart AI Agent Suite in managed service delivery. These providers compete on scale, industry expertise, local delivery, and automation that can improve incident management and contract renewal.
Desktop-focused specialists create pressure through automation and deeper platform expertise. Nerdio's USD 500 million Series C in March 2025 funded the expansion of its end-user computing automation platform. Omnissa launched an AI agentic service in September 2025 to automate workspace tasks, while Dizzion and Expedient introduced Private Cloud PC on Nutanix infrastructure in January 2026 with an estimated 20-40% total cost of ownership reduction compared with public cloud alternatives.[3] Citrix also addresses sovereign and air-gapped public sector requirements, showing the importance of specialized compliance delivery.
Competition also reflects demand for sovereign operations, GPU capacity, and digital employee experience services. Omnissa expanded Horizon in September 2026 with AI-ready workspace functions and unified endpoint management across physical and virtual devices. Nexthink launched an AI-guided VDI monitoring product in January 2025 that provides visibility across client, network, infrastructure, desktop, and application layers. Providers that combine desktop operations with identity, network security, localized support, and performance data can meet a wider set of buyer requirements.
Managed Virtual Desktop Operations Services Industry Leaders
-
NTT DATA Corporation
-
HCLTech Limited
-
Tata Consultancy Services Limited
-
Capgemini SE
-
Accenture plc
- *Disclaimer: Major Players sorted in no particular order
Managed Virtual Desktop Operations Services Market Companies Covered in this Report
- NTT DATA Corporation
- HCLTech Limited
- Tata Consultancy Services Limited
- Capgemini SE
- Accenture plc
- Cognizant Technology Solutions Corporation
- Infosys Limited
- Wipro Limited
- Fujitsu Limited
- Computacenter plc
- Atos SE
- Unisys Corporation
- Ensono Holdings, LLC
- Compucom Systems, Inc.
- Milestone Technologies, Inc.
- Stefanini International
- Microsoft Corporation
- Amazon Web Services, Inc.
- Citrix Systems, Inc.
- Omnissa, LLC
- Nutanix, Inc.
- Nerdio, Inc.
- Workspot, Inc.
- Evolve IP, LLC
- Dizzion, Inc.
- Apporto, Inc.
Recent Industry Developments in Managed Virtual Desktop Operations Services Market
- September 2026: Omnissa released AI-ready workspace capabilities for Horizon at Omnissa ONE AMER 2026, including expanded AI-driven workload management and unified endpoint management for virtual desktops, enabling IT administrators to manage physical and virtual devices from a single console and reduce image management overhead across hybrid environments.
- March 2026: Citrix launched the Citrix Platform for Public Sector, a sovereign and air-gapped managed virtual desktop solution designed for FedRAMP High, air-gapped deployments, and sovereign cloud mandates. The platform delivers virtual desktops, networking, and zero-trust network access in a single-tenant model entirely managed within sovereign regional boundaries.
- January 2026: Dizzion and Expedient launched Dizzion Private Cloud PC powered by Nutanix infrastructure, a fully managed DaaS offering delivering an estimated 20-40% total cost of ownership reduction versus public cloud alternatives. The solution provides predictable monthly pricing, guaranteed performance, elastic scaling, and U.S.-based data hosting for enterprise clients with governance requirements.
- December 2025: Omnissa released Horizon 8 version 2512, integrating Workspace ONE unified endpoint management directly with Horizon 8 to enable unified management of physical devices and virtual desktops from a single console, with automated enrollment across vSphere, Amazon WorkSpaces Core, and Nutanix AHV capacity providers.
Global Managed Virtual Desktop Operations Services Market Report Scope
The managed virtual desktop operations services market comprises third-party services that support the deployment, management, monitoring, maintenance, security, and optimization of virtual desktop infrastructure (VDI) and desktop-as-a-service (DaaS) environments. These services enable organizations to deliver centralized, secure, and scalable virtual desktops to end users across on-premises, cloud, and hybrid IT environments.
The Managed Virtual Desktop Operations Services Market Report is Segmented by Service Type (Managed VDI Operations, Managed DaaS Operations, Managed Application and Session Virtualization, Image, Application, and Patch Management, Monitoring, Service Desk, and Experience Management, and Security, Compliance, Backup, and Disaster Recovery), Enterprise Size (Large Enterprises and Small and Medium Enterprises), Desktop Persistence (Persistent Desktops and Non-Persistent Desktops), Deployment Model (On-Premises, Cloud-Based, and Hybrid), End-User Industry (Information Technology and Telecommunications, BFSI, Healthcare, Retail and E-Commerce, Manufacturing, Government and Defense, and Other End-User Industries), and Geography (North America, South America, Europe, Asia-Pacific, Middle East, and Africa). The Market Forecasts are Provided in Terms of Value (USD).
Segmentation Overview
| Managed VDI Operations |
| Managed DaaS Operations |
| Managed Application and Session Virtualization |
| Image, Application, and Patch Management |
| Monitoring, Service Desk, and Experience Management |
| Security, Compliance, Backup, and Disaster Recovery |
| Large Enterprises |
| Small and Medium Enterprises |
| Persistent Desktops |
| Non-Persistent Desktops |
| On-Premises |
| Cloud-Based |
| Hybrid |
| Information Technology and Telecommunications |
| BFSI |
| Healthcare |
| Retail and E-Commerce |
| Manufacturing |
| Government and Defense |
| Other End-User Industries |
| North America | United States |
| Canada | |
| Mexico | |
| South America | Brazil |
| Argentina | |
| Rest of South America | |
| Europe | Germany |
| United Kingdom | |
| France | |
| Italy | |
| Spain | |
| Russia | |
| Rest of Europe | |
| Asia-Pacific | China |
| India | |
| Japan | |
| South Korea | |
| Australia | |
| Rest of Asia-Pacific | |
| Middle East | Saudi Arabia |
| United Arab Emirates | |
| Turkey | |
| Rest of Middle East | |
| Africa | South Africa |
| Egypt | |
| Nigeria | |
| Rest of Africa |
| By Service Type | Managed VDI Operations | |
| Managed DaaS Operations | ||
| Managed Application and Session Virtualization | ||
| Image, Application, and Patch Management | ||
| Monitoring, Service Desk, and Experience Management | ||
| Security, Compliance, Backup, and Disaster Recovery | ||
| By Enterprise Size | Large Enterprises | |
| Small and Medium Enterprises | ||
| By Desktop Persistence | Persistent Desktops | |
| Non-Persistent Desktops | ||
| By Deployment Model | On-Premises | |
| Cloud-Based | ||
| Hybrid | ||
| By End-User Industry | Information Technology and Telecommunications | |
| BFSI | ||
| Healthcare | ||
| Retail and E-Commerce | ||
| Manufacturing | ||
| Government and Defense | ||
| Other End-User Industries | ||
| By Geography | North America | United States |
| Canada | ||
| Mexico | ||
| South America | Brazil | |
| Argentina | ||
| Rest of South America | ||
| Europe | Germany | |
| United Kingdom | ||
| France | ||
| Italy | ||
| Spain | ||
| Russia | ||
| Rest of Europe | ||
| Asia-Pacific | China | |
| India | ||
| Japan | ||
| South Korea | ||
| Australia | ||
| Rest of Asia-Pacific | ||
| Middle East | Saudi Arabia | |
| United Arab Emirates | ||
| Turkey | ||
| Rest of Middle East | ||
| Africa | South Africa | |
| Egypt | ||
| Nigeria | ||
| Rest of Africa | ||
Key Questions Answered in the Report
What is the managed virtual desktop operations services market size?
The Managed virtual desktop operations services market is projected to expand from USD 4.87 billion in 2026 and USD 5.52 billion in 2027 to USD 10.43 billion by 2032, at a 13.57% CAGR.
What is driving demand for managed virtual desktop services?
Hybrid work, security requirements, cloud migration, and the shortage of desktop operations skills are supporting demand for managed delivery, especially where organizations operate several cloud and on-premises platforms and need a single accountable service provider.
Which service type is growing the fastest?
Managed DaaS Operations is projected to grow at a 14.23% CAGR through 2032 as organizations transfer desktop delivery operations to specialist providers.
Why are hybrid desktop deployments increasing?
Hybrid deployment is projected to grow at a 14.26% CAGR because it allows organizations to retain selected on-premises workloads while using cloud management capabilities.
Which end-user sector is expected to grow the fastest?
Healthcare is projected to record a 14.42% CAGR through 2032, supported by the need for controlled access to electronic health records, centralized security controls, reliable clinical application delivery, and reduced exposure of patient information on local endpoints.
Which region is expected to grow the fastest?
Asia-Pacific is projected to expand at a 14.93% CAGR through 2032, supported by workforce scale, improving cloud capacity, and a shortage of specialized end-user computing talent.