
Managed GPU Infrastructure Services Market Size and Share
Market Overview
| Study Period | 2021 - 2032 |
|---|---|
| Market Size (2027) | USD 4.56 Billion |
| Market Size (2032) | USD 14.21 Billion |
| Growth Rate (2027 - 2032) | 25.52 % |
| Fastest Growing Market | Asia-Pacific |
| Largest Market | North America |
| Market Concentration | Medium |
Major Players *Disclaimer: Major Players sorted in no particular order Image © Mordor Intelligence. Reuse requires attribution under CC BY 4.0. | |
Managed GPU Infrastructure Services Market Analysis by Mordor Intelligence
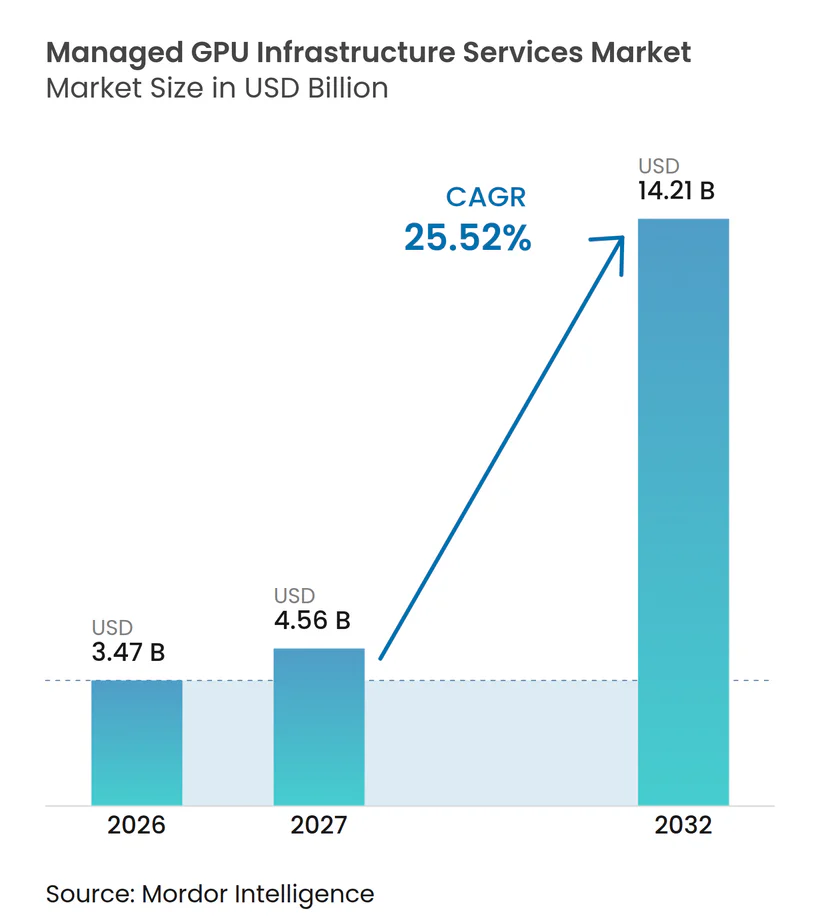
The managed GPU infrastructure services market size is expected to grow from USD 3.47 billion in 2026 to USD 4.56 billion in 2027 and is forecast to reach USD 14.21 billion by 2032 at 25.52% CAGR over 2027-2032. The managed GPU infrastructure services market is moving from periodic hardware purchases toward contracted, production-scale computing services with service-level commitments. Generative AI training and inference are increasing the need for reliable capacity, operational support, and predictable performance. Providers that combine orchestration, monitoring, and managed operations can serve more complex workloads than providers that offer basic GPU rental. Hardware availability, especially high-bandwidth memory and advanced packaging capacity, limits the pace at which providers can commission new clusters. Sovereign computing requirements and data residency rules also create opportunities for regional providers that can support regulated workloads within the required jurisdiction.
Key Report Takeaways
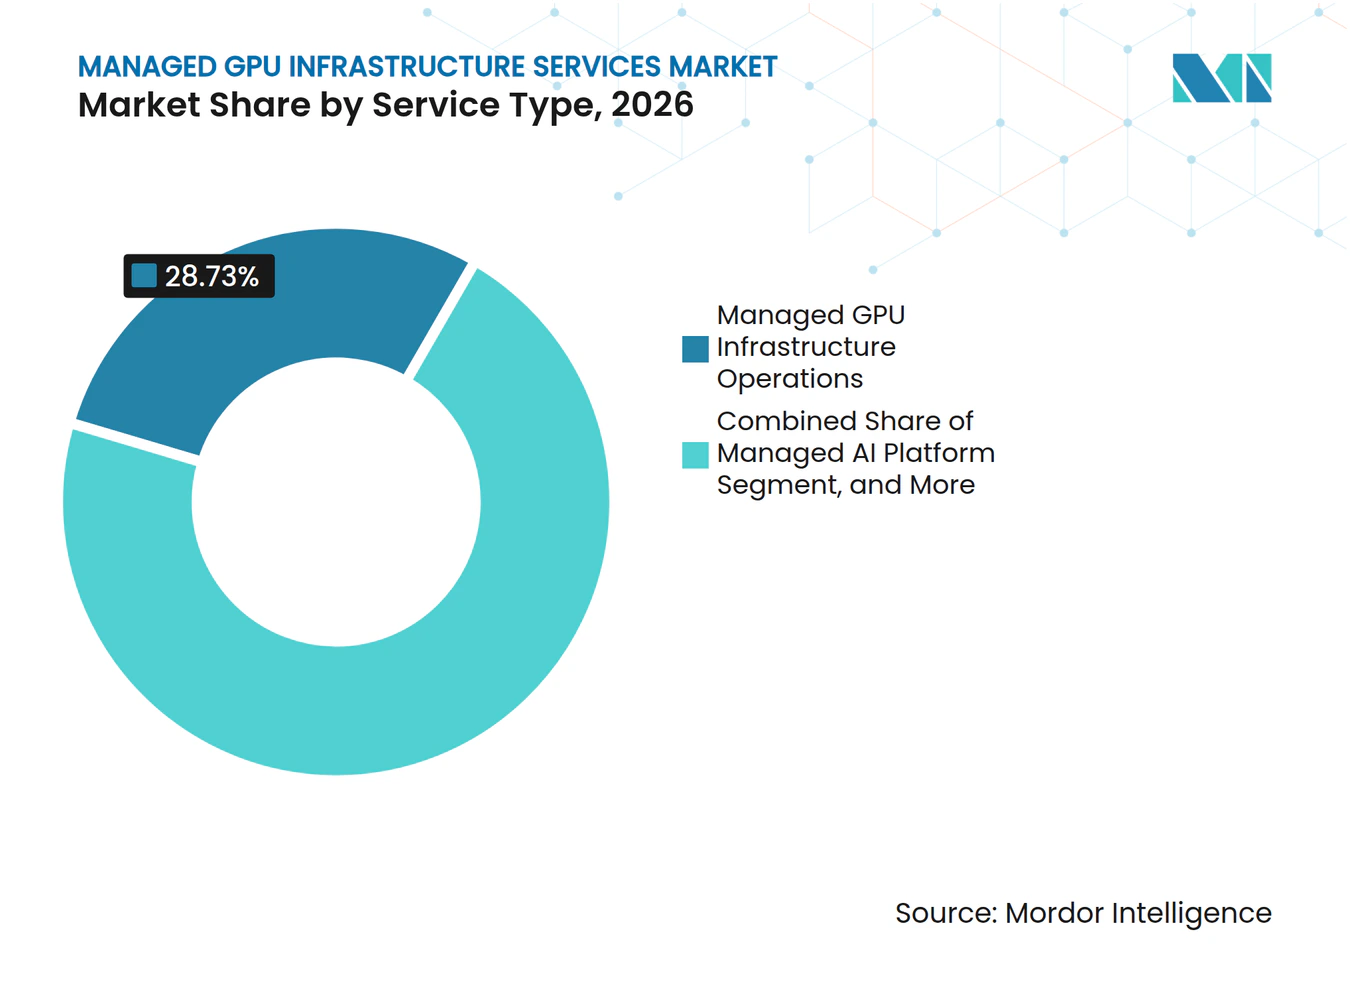
- By service type, managed GPU infrastructure operations held 28.73% of the managed GPU infrastructure services market share in 2026, while managed inference and model-serving operations are projected to expand at a 26.81% CAGR through 2032.
- By GPU workload, AI inference and model serving accounted for 36.41% of the managed GPU infrastructure services market share in 2026, while fine-tuning and RAG are projected to expand at a 27.62% CAGR through 2032.
- By deployment model, cloud-based deployment accounted for 68.58% of the managed GPU infrastructure services market share in 2026 and is projected to expand at a 27.33% CAGR through 2032.
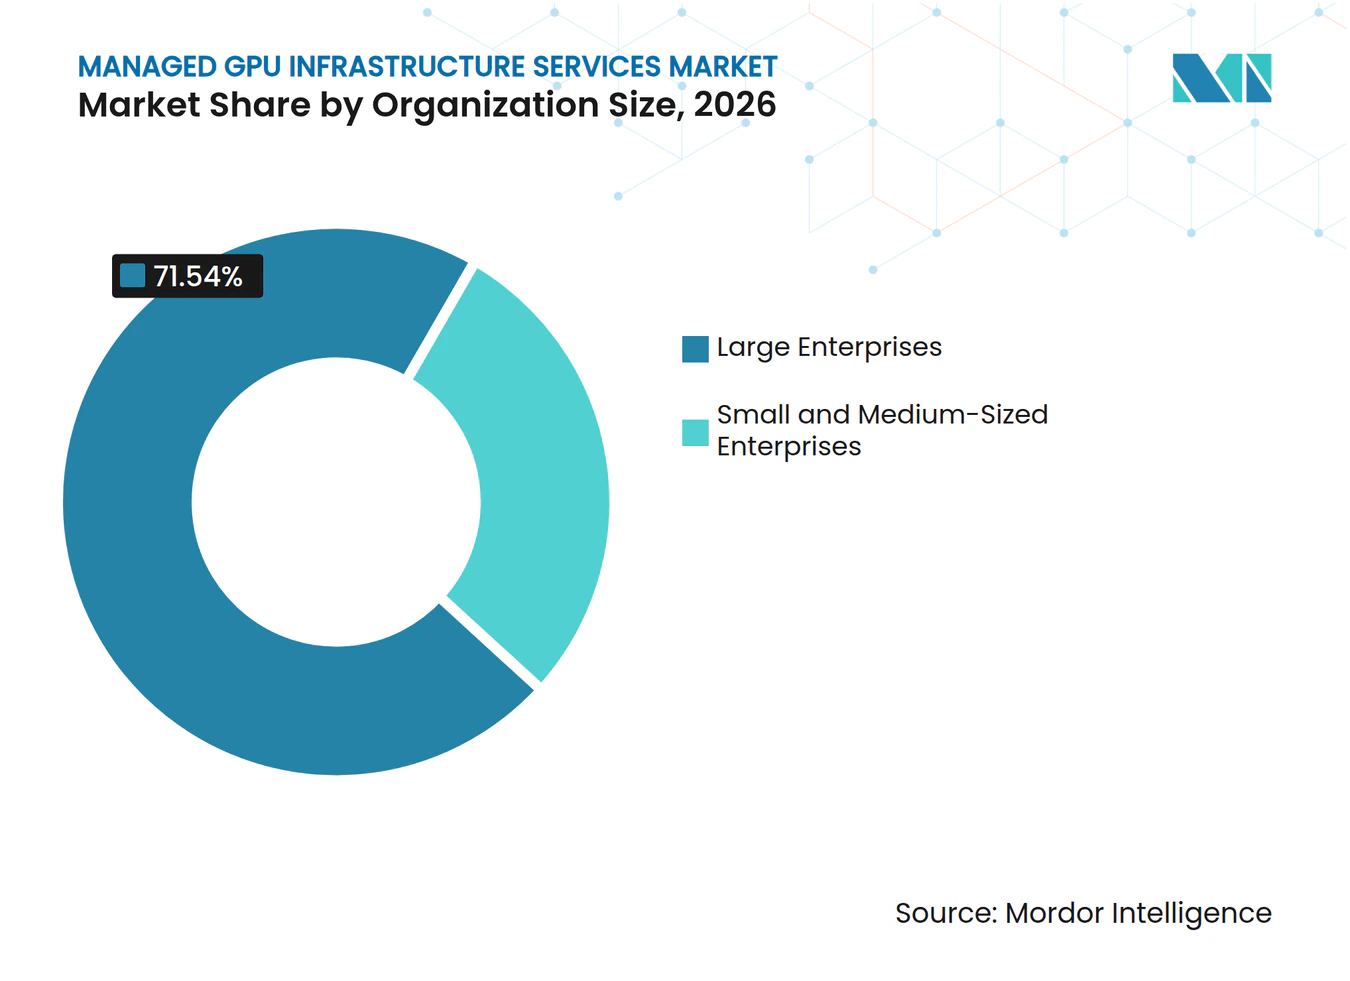
- By organization size, large enterprises held 71.54% share in 2026, while SMEs are projected to expand at a 26.59% CAGR through 2032.
- By end user, IT and telecommunications held 71.54% share in 2026, while healthcare and life sciences are projected to expand at a 28.27% CAGR through 2032.
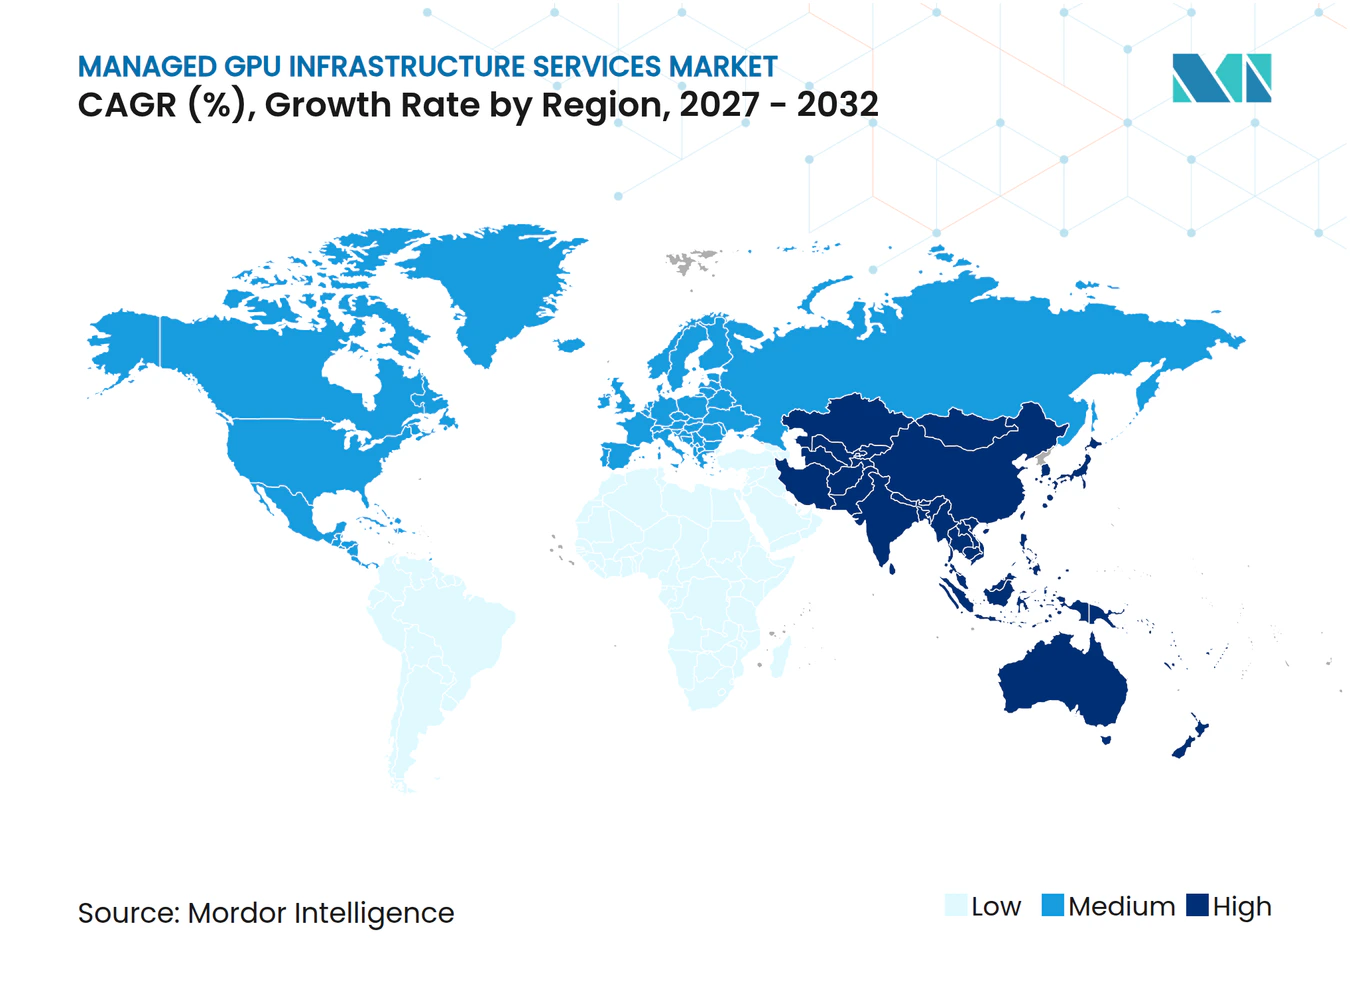
- By geography, North America held 38.64% of the managed GPU infrastructure services market share in 2026, while Asia-Pacific is projected to expand at a 27.91% CAGR through 2032.
Note: Market numbers in this report are based on Mordor Intelligence's proprietary estimation framework, which combines nine months of actuals with Q4 projections for base year 2026.
Market Trends and Insights
Drivers Impact Analysis of Managed GPU Infrastructure Services Market*
| Driver | (~) % Impact on CAGR Forecast | Geographic Relevance | Impact Timeline |
|---|---|---|---|
| Production-Scale Generative AI Training and Inference | +8.5% | Global | Medium term (2-4 years) |
| Rising Inference Density and Agentic AI Workloads | +7.2% | Global | Short term (≤ 2 years) |
| Shift From GPU Ownership to Elastic Managed Capacity | +5.8% | North America and Europe | Medium term (2-4 years) |
| Sovereign AI, Data Residency, and Regulated Workload Demand | +3.4% | Europe, Asia-Pacific, Middle East | Medium term (2-4 years) |
| GPU Utilization Optimization Through Fractional Allocation and Scheduling | +2.1% | Global | Short term (≤ 2 years) |
| Managed Cooling, Power, and Cluster Operations for High-Density Racks | +1.3% | North America, Asia-Pacific Core | Long term (≥ 4 years) |
| Source: Mordor Intelligence | |||
Production-Scale Generative AI Training and Inference
Training frontier language models requires clusters with many thousands of accelerators operating for extended periods. Production inference also requires sustained capacity, as services must handle millions of daily requests with strict latency requirements. These requirements exceed the procurement and operations capacity of many enterprise IT teams. CoreWeave reported USD 5.1 billion in revenue in FY2025, up from USD 1.9 billion in FY2024, underscoring the scale of contracted managed capacity commitments.[1] Eli Lilly deployed 1,016 NVIDIA Blackwell Ultra GPUs in October 2025 to support foundation model training for drug discovery through Lilly TuneLab. The managed GPU infrastructure services market benefits as data-sensitive sectors treat access to managed computing capacity as an operational requirement rather than a temporary project need.
Rising Inference Density and Agentic AI Workloads
A conventional chatbot request may release a GPU in milliseconds after producing a response. An agentic session can involve repeated model calls, retrieval steps, and tool actions, keeping computing resources occupied for much longer. This behavior raises the density and duration of inference demand. Providers need to configure infrastructure around memory bandwidth, scheduling, batching, and response-time management. Managed inference and model-serving operations are projected to expand at a 26.81% CAGR through 2032, reflecting this production requirement. The managed GPU infrastructure services market, therefore, favors platforms that can operate persistent inference fleets without requiring each customer to build a specialist infrastructure team.
Shift From GPU Ownership to Elastic Managed Capacity
GPU ownership carries greater risk when hardware generations advance quickly. A company that purchases a cluster can face lower efficiency when newer architectures become available. Managed services allow customers to access newer capacity without owning equipment that may become stranded. CoreWeave reported a USD 55.6 billion order backlog as of Q3 2025, reflecting large contracted commitments for AI infrastructure. Reserved commitments can also provide service providers with the demand visibility needed to finance new data center capacity. This shift supports the managed GPU infrastructure services market because contracted capacity can be more suitable than owned infrastructure for changing AI workload requirements.
Sovereign AI, Data Residency, and Regulated Workload Demand
Government policies increasingly require greater control over the location and operation of AI computing resources. The European Commission proposed a Cloud and AI Development Act that sets out a sovereignty framework for cloud and AI services.[2] The highest assurance requirements favor providers with locally controlled operations, personnel, and supply chains. India’s IndiaAI Mission allocated GPU infrastructure to 14 domestic providers under an INR 10,372 crore (USD 1.23 billion) program, as stated in the source material. Regional data localization measures create a distinct service requirement beyond basic access to accelerators. The managed GPU infrastructure services market can benefit when providers demonstrate auditable compliance, domestic hosting, and local operating support.
Restraints Impact Analysis of Managed GPU Infrastructure Services Market*
| Restraint | (~) % Impact on CAGR Forecast | Geographic Relevance | Impact Timeline |
|---|---|---|---|
| GPU, HBM, and Advanced Packaging Supply Volatility | -4.2% | Global | Short term (≤ 2 years) |
| High-Density Power and Cooling Retrofit Constraints | -3.1% | North America and Europe | Medium term (2-4 years) |
| Rapid Accelerator Obsolescence and Upgrade Risk | -1.8% | Global | Long term (≥ 4 years) |
| Data Security, Multi-Tenant Isolation, and Compliance Concerns | -1.4% | Global, Asia-Pacific and Europe Focus | Medium term (2-4 years) |
| Source: Mordor Intelligence | |||
GPU, HBM, and Advanced Packaging Supply Volatility
The supply chain for frontier AI accelerators remains constrained by high-bandwidth memory and advanced packaging. These components can limit accelerator output even when logic chip fabrication capacity is available. A limited group of providers controls a large share of advanced packaging and memory supply. New manufacturing lines require long lead times, which restricts quick capacity additions. For service providers, shortages can delay cluster commissioning and lengthen customer waitlists. The managed GPU infrastructure services market can face slower expansion and repricing pressure when contracted demand exceeds deployable hardware supply.
High-Density Power and Cooling Retrofit Constraints
AI training deployments require much higher rack densities than traditional enterprise infrastructure. NVIDIA’s GB300 NVL72-based clusters can draw up to 142 kW per rack.[3] Many legacy facilities were designed for much lower power loads and conventional air cooling. Higher-density clusters require direct liquid cooling or immersion systems, along with related changes to power distribution. These retrofit needs raise the capital and execution requirements for data center operators. The managed GPU infrastructure services market may therefore favor providers with newer facilities or the resources to redesign existing sites.
*Our forecasts treat driver/restraint impacts as directional, not additive. The impact forecasts reflect baseline growth, mix effects, and variable interactions.
Managed GPU Infrastructure Services Market Segment Analysis
By Service Type:
Operations and Inference Support Managed AdoptionManaged GPU infrastructure operations held 28.73% of total service revenue in 2026. The segment covers cluster lifecycle tasks such as firmware updates, capacity scheduling, health monitoring, and fault remediation. Organizations operating clusters with many thousands of GPUs often lack the internal staff needed to maintain service-level uptime. Fully managed operations address this gap by combining infrastructure oversight with customer support. Managed Kubernetes and container orchestration support the deployment of applications across shared computing environments. Managed AI platform and MLOps operations can then help customers monitor models and manage production workflows.
Managed inference and model-serving operations is projected to expand at a 26.81% CAGR through 2032. Its scope includes model routing, auto-scaling, token caching, and latency management for production services. These functions become more important as enterprises move from occasional model training to ongoing inference. Managed model training and fine-tuning infrastructure also supports organizations working with sensitive proprietary data. Lambda announced in October 2026 that it would integrate open-source NVIDIA Run:ai with Lambda Kubernetes Service for GPU fraction sharing, topology-aware scheduling, fair-share quotas, and automated node remediation.[4] Customers can use these functions to manage shared infrastructure while keeping workload access and resource allocation under defined operational rules. The service model also reduces the need to assemble separate teams for cluster administration, scheduling policy, and day-to-day remediation. These capabilities show why service differentiation extends beyond access to hardware in the managed GPU infrastructure services industry.



By GPU Workload:
Inference Demand Reshapes Cluster UseAI inference and model serving accounted for 36.41% of total service revenue in 2026. Enterprises increasingly use AI systems to serve real-time applications rather than only batch processing tasks. Inference workloads place a particular emphasis on memory bandwidth, response time, and efficient resource allocation. Providers need to configure clusters for stable production service rather than only peak training performance. Foundation model training remains relevant for frontier AI laboratories with large data and computing requirements. Open-weight models reduce the need for many organizations to train large models from the beginning.
Fine-tuning and RAG is projected to expand at a 27.62% CAGR through 2032. Many organizations adapt existing frontier or open-weight models to their own data instead of building foundation models from scratch. This approach creates demand for secure environments that support repeated model development and evaluation. Eli Lilly, Roche, and Bristol Myers Squibb announced dedicated GPU SuperPOD deployments through mid-2026 for research-related AI workloads. These deployments show that scientific users need repeatable access to computing capacity during iterative research cycles. Providers can support this work through managed environments that combine infrastructure control with operational continuity. HPC and scientific simulation retain separate demand from research, engineering, and technical computing users. Digital twins and rendering also use managed GPU capacity, although inference and fine-tuning take a growing share of available resources.
By Deployment Model:
Cloud Leads While Hybrid Supports Controlled WorkloadsCloud-based deployment accounted for 68.58% of the managed GPU infrastructure services market size in 2026. It is also projected to expand at a 27.33% CAGR through 2032. Cloud services let customers move from a small fine-tuning run to a much larger training cluster without purchasing physical hardware. This flexibility suits organizations with uneven demand between development cycles and production periods. It also gives providers a way to pool capacity across customers. The cloud model supports the broader managed GPU infrastructure services market by making advanced compute available through consumption-based service models.
On-premises managed GPU deployments remain relevant for organizations that face data egress restrictions or require very low latency. Government and defense users may also require physical isolation for selected workloads. Hybrid and multi-cloud environments allow enterprises to separate public-facing inference from proprietary model development. Red Hat identifies hardware, fabric, scheduler, and virtualization as distinct layers that require aligned controls for multi-tenant GPU isolation. This layered design reflects the operational work required when customers use more than 1 infrastructure environment. It also helps explain why managed services are relevant when organizations need common policies across distinct locations. Sovereign computing policies can require certain workloads to remain in a defined jurisdiction. These conditions create demand for providers that can operate coordinated environments across cloud, local, and sovereign infrastructure.
By Organization Size:
Enterprises Lead, SMEs Improve AccessLarge enterprises held 71.54% share in 2026. They can commit to multi-year reserved contracts that support data center investment decisions by neoclouds and hyperscalers. Reserved commitments can offer lower pricing than on-demand use but require clear workload planning and financial capacity. Large customers often purchase higher-value operational support, security isolation, custom network configurations, and MLOps integration. These services help maintain predictable capacity for enterprise AI programs. The concentration of large contracts also gives providers a stronger basis for financing infrastructure expansion.
SMEs are projected to expand at a 26.59% CAGR through 2032. Serverless GPU services and per-second billing reduce the minimum commitment needed to use high-performance computing. Fractional allocation allows a customer to use part of a GPU instead of reserving a full device. Fair-share scheduling and spot-instance preemption can make shared pools more practical for smaller workloads. Automated provisioning can also limit the administrative burden on teams that do not have dedicated infrastructure staff. These consumption models allow smaller customers to match capacity use more closely to a project’s duration and demand pattern. These models can increase access for organizations without a dedicated AI infrastructure budget. SME demand broadens the customer base of the managed GPU infrastructure services market while placing greater importance on automated provisioning and utilization controls.

By End User:
IT and Telecommunications Leads, Healthcare ExpandsIT and telecommunications held 71.54% share in 2026. The sector is both a major builder and a major user of AI computing infrastructure. Cloud providers need capacity for customer platforms and internal services. Telecom operators use AI for network operations and related digital services. SaaS providers also require managed GPU capacity when they add generative AI functions to existing products. These requirements make the segment a stable source of production-scale demand.
The healthcare and life sciences industry is projected to expand at a 28.27% CAGR through 2032. Pharmaceutical and biotechnology organizations use GPU-intensive systems for protein structure prediction, molecular docking, genomics, and biomedical model training. NVIDIA reported that 57% of surveyed pharmaceutical and biotechnology respondents identified drug discovery as their primary AI use case, while 44% cited genomics applications.[5] These workloads require protected computing environments because research data and model outputs can be sensitive. They also benefit from operational reliability where computational processes need repeated access to high-performance resources. BFSI users apply managed computing to risk modeling, fraud detection, and generative AI workloads. Government, industrial manufacturing, and retail organizations use services for sovereign applications, digital twins, engineering simulation, recommendation systems, and personalization. These diverse uses reduce dependence on a single end-user category in the managed GPU infrastructure services industry.
Geography Analysis
North America Managed GPU Infrastructure Services Market
North America held 38.64% of total revenue in 2026. The region has a high concentration of hyperscale cloud providers, AI-native enterprises, and purpose-built GPU cloud operators. CoreWeave operated 43 data centers with more than 850 MW of active power in 2025. The company guided USD 30 billion to USD 35 billion in 2026 capital expenditure and targeted more than 8 GW of total capacity by 2030. Canada and Mexico can benefit from infrastructure spillover and their proximity to the United States.
Europe and APAC Managed GPU Infrastructure Services Market
Europe is expanding capacity through hyperscaler regions and sovereign cloud programs. The proposed EU framework creates more structured procurement requirements for compliant cloud and AI infrastructure. Asia-Pacific is projected to expand at a 27.91% CAGR through 2032, the highest regional rate in the managed GPU infrastructure services market. Indonesia is becoming a deployment location through Ooredoo Group’s USD 800 million commitment to Zankore, which targets 1 GW of NVIDIA DSX AI Factory capacity. The plan expects 200 MW to be online in the first half of 2027.
APAC, MEA and South America Managed GPU Infrastructure Services Market
India’s IndiaAI Mission, domestic cloud expansion in China, and government-supported compute programs in Japan and South Korea support policy-led demand across Asia-Pacific. The Middle East is supported by sovereign wealth fund investment and low energy costs in Saudi Arabia and the UAE. South America has Brazil as its principal hub, with demand from banking, retail, and government digital transformation. Investment in the region remains behind the scale of the Asia-Pacific buildout. Africa remains the smallest regional segment, although South Africa, Nigeria, and Kenya show early activity. Hyperscalers are beginning to seed GPU capacity to serve the continent’s expanding digital economy.
Competitive Landscape
Market Concentration
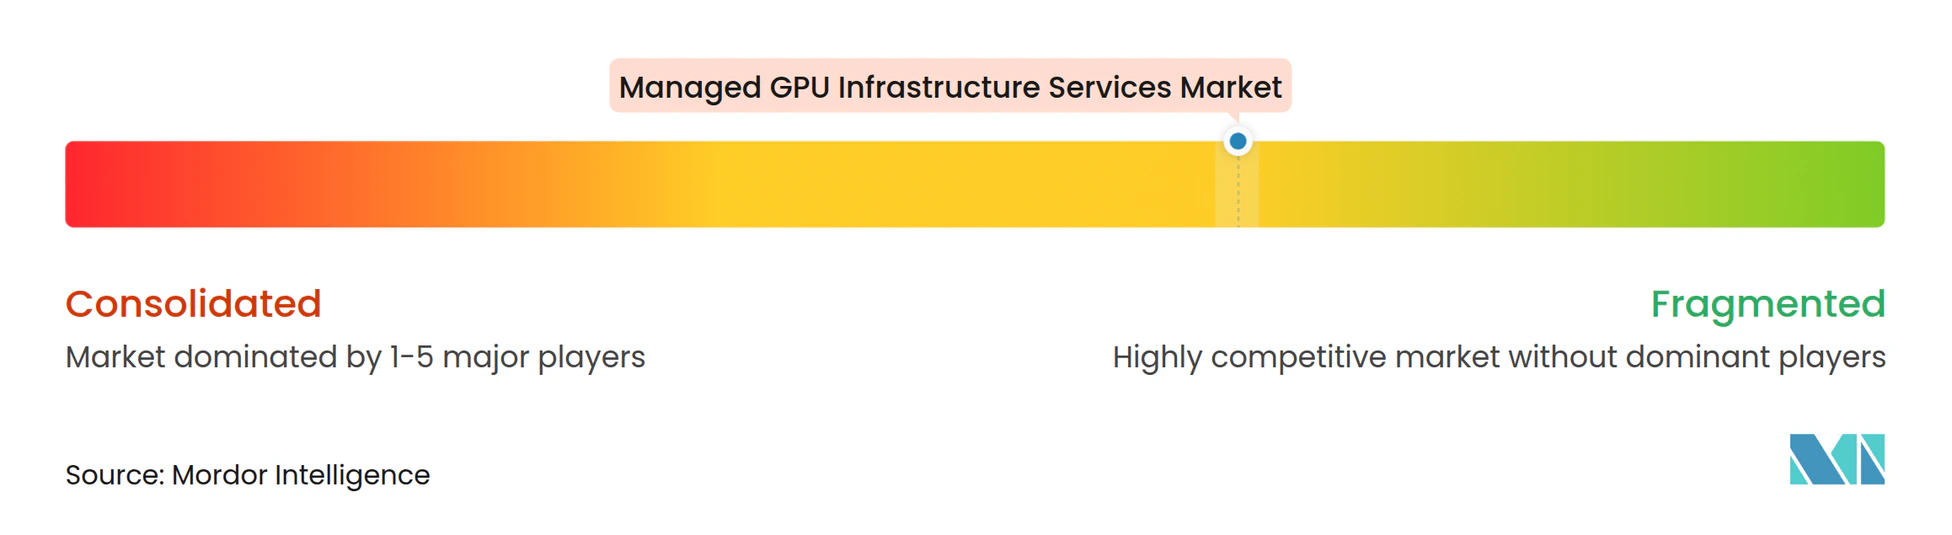
The managed GPU infrastructure services market is moderately fragmented and has a tiered competitive structure. AWS, Microsoft Azure, Google Cloud, Oracle Cloud Infrastructure, and IBM Cloud compete through broad geographic reach, integrated software, and established enterprise relationships. CoreWeave, Lambda, Crusoe, Nebius, RunPod, Vast.ai, and Voltage Park compete by focusing on newer hardware, single-tenant configurations, and faster provisioning. Providers that offer only undifferentiated GPU rental face greater pricing pressure as basic H100 access becomes more widely available. The competitive advantage is increasingly in operating the infrastructure rather than merely supplying the accelerator. Providers also need to support security, observability, capacity planning, and application-level performance.
Long-term capacity commitments can strengthen relationships between leading providers and their largest customers. CoreWeave expanded its relationship with OpenAI through a USD 6.5 billion contract in September 2025, bringing the stated total agreement value to USD 22.4 billion across 3 expansions. Crusoe launched Crusoe Spark Liquid in October 2026, a liquid-cooled modular AI factory intended for NVIDIA Vera Rubin NVL72 systems. Lambda announced its NVIDIA Run:ai integration for its Kubernetes service in October 2026. These moves address cluster density, scheduling, and managed operations, which are important areas of service differentiation.
Opportunities remain in sovereign and regulated infrastructure, SME-focused managed inference, and orchestration for agentic workloads. Regional telecom operators can combine local connectivity, enterprise relationships, and local infrastructure when they enter the managed GPU services market. Providers that can validate the full technology stack, from hardware configuration through MLOps observability, have a stronger position with regulated customers. Data sanitization and isolation practices are also important when customers share infrastructure. The market remains competitive across hyperscale, neocloud, and regional service tiers. Available source material does not provide combined market shares for the leading players, so a numerical concentration score cannot be supported without introducing an unsupported estimate.
Managed GPU Infrastructure Services Industry Leaders
-
Amazon Web Services, Inc.
-
Microsoft Corporation
-
Google LLC
-
Oracle Corporation
-
International Business Machines Corporation
- *Disclaimer: Major Players sorted in no particular order
Managed GPU Infrastructure Services Market Companies Covered in this Report
- Amazon Web Services, Inc.
- Microsoft Corporation
- Google LLC
- Oracle Corporation
- International Business Machines Corporation
- CoreWeave, Inc.
- Lambda, Inc.
- RunPod, Inc.
- Vast.ai, Inc.
- Nebius Group N.V.
- Crusoe Energy Systems LLC
- Fluidstack Limited
- Voltage Park, Inc.
- DigitalOcean, LLC
- OVH SAS
- Rackspace Technology, Inc.
- Equinix, Inc.
- Digital Realty Trust, Inc.
- Alibaba Cloud Computing Ltd.
- Tencent Cloud Computing (Beijing) Co., Ltd.
- NVIDIA Corporation
- Advanced Micro Devices, Inc.
- Hewlett Packard Enterprise Company
- Dell Technologies Inc.
Recent Industry Developments in Managed GPU Infrastructure Services Market
- October 2026: Crusoe launched Crusoe Spark Liquid at NVIDIA GTC Berlin, a liquid-cooled modular AI factory delivering 5 times the compute density of its air-cooled predecessor, engineered for NVIDIA Vera Rubin NVL72 systems. Crusoe simultaneously joined the NVIDIA DSX POD design partner ecosystem and opened private previews of Managed RL and Managed MLflow.
- October 2026: Lambda announced integration of open-source NVIDIA Run:ai with Lambda Kubernetes Service, enabling GPU fraction sharing, topology-aware scheduling, fair-share quota enforcement, and automated node remediation for enterprise shared AI infrastructure.
- October 2025: Eli Lilly deployed 1,016 NVIDIA Blackwell Ultra GPUs in a DGX SuperPOD configuration for foundation model training for drug discovery through Lilly TuneLab.
- September 2025: CoreWeave expanded its partnership with OpenAI with a USD 6.5 billion managed GPU infrastructure contract, bringing total agreement value to USD 22.4 billion.
Global Managed GPU Infrastructure Services Market Report Scope
Managed GPU infrastructure services market provides enterprises with GPU compute resources along with provider-led operations such as deployment, monitoring, capacity planning, driver and firmware maintenance, security patching, performance optimization, and incident response. These services support AI training, inference, high-performance computing, rendering, and other accelerated workloads while reducing the need for in-house expertise in GPU operations.
The Managed GPU Infrastructure Services Market Report is Segmented by Service Type (Managed GPU Cluster Design and Deployment, Managed GPU Infrastructure Operations, Managed Kubernetes and Container Orchestration, Managed AI Platform and MLOps Operations, Managed Model Training and Fine-Tuning Infrastructure, Managed Inference and Model-Serving Operations, and Other Service Types), GPU Workload (Foundation Model Training, Fine-Tuning and Retrieval-Augmented Generation, AI Inference and Model Serving, High-Performance Computing and Scientific Simulation, Rendering, Animation, VFX, and Virtual Production, Digital Twins, Engineering, and Industrial Simulation, and Other GPU Workload), Deployment Mode (Cloud-Based, On-Premises, and Hybrid and Multi-Cloud), Organization Size (Large Enterprises, and Small and Medium-Sized Enterprises), End User Industry (Banking, Financial Services and Insurance (BFSI), IT and Telecommunications, Healthcare and Life Sciences, Government and Public Administration, Industrial Manufacturing, Retail and E-Commerce, and Other End-User Industries), and Geography (North America, South America, Europe, Asia-Pacific, Middle East, and Africa). The Market Forecasts are Provided in Terms of Value (USD).
Segmentation Overview
| Managed GPU Cluster Design and Deployment |
| Managed GPU Infrastructure Operations |
| Managed Kubernetes and Container Orchestration |
| Managed AI Platform and MLOps Operations |
| Managed Model Training and Fine-Tuning Infrastructure |
| Managed Inference and Model-Serving Operations |
| Other Service Types |
| Foundation Model Training |
| Fine-Tuning and Retrieval-Augmented Generation |
| AI Inference and Model Serving |
| High-Performance Computing and Scientific Simulation |
| Rendering, Animation, VFX, and Virtual Production |
| Digital Twins, Engineering, and Industrial Simulation |
| Other GPU Workload |
| Cloud-Based |
| On-Premises |
| Hybrid and Multi-Cloud |
| Large Enterprises |
| Small and Medium-Sized Enterprises |
| Banking, Financial Services and Insurance (BFSI) |
| IT and Telecommunications |
| Healthcare and Life Sciences |
| Government and Public Administration |
| Industrial Manufacturing |
| Retail and E-Commerce |
| Other End-User Industries |
| North America | United States |
| Canada | |
| Mexico | |
| South America | Brazil |
| Rest of South America | |
| Europe | Germany |
| United Kingdom | |
| France | |
| Rest of Europe | |
| Asia-Pacific | China |
| Japan | |
| South Korea | |
| India | |
| Rest of Asia-Pacific | |
| Middle East | Saudi Arabia |
| United Arab Emirates | |
| Rest of Middle East | |
| Africa | South Africa |
| Nigeria | |
| Rest of Africa |
| By Service Type | Managed GPU Cluster Design and Deployment | |
| Managed GPU Infrastructure Operations | ||
| Managed Kubernetes and Container Orchestration | ||
| Managed AI Platform and MLOps Operations | ||
| Managed Model Training and Fine-Tuning Infrastructure | ||
| Managed Inference and Model-Serving Operations | ||
| Other Service Types | ||
| By GPU Workload | Foundation Model Training | |
| Fine-Tuning and Retrieval-Augmented Generation | ||
| AI Inference and Model Serving | ||
| High-Performance Computing and Scientific Simulation | ||
| Rendering, Animation, VFX, and Virtual Production | ||
| Digital Twins, Engineering, and Industrial Simulation | ||
| Other GPU Workload | ||
| By Deployment Model | Cloud-Based | |
| On-Premises | ||
| Hybrid and Multi-Cloud | ||
| By Organization Size | Large Enterprises | |
| Small and Medium-Sized Enterprises | ||
| By End User | Banking, Financial Services and Insurance (BFSI) | |
| IT and Telecommunications | ||
| Healthcare and Life Sciences | ||
| Government and Public Administration | ||
| Industrial Manufacturing | ||
| Retail and E-Commerce | ||
| Other End-User Industries | ||
| By Geography | North America | United States |
| Canada | ||
| Mexico | ||
| South America | Brazil | |
| Rest of South America | ||
| Europe | Germany | |
| United Kingdom | ||
| France | ||
| Rest of Europe | ||
| Asia-Pacific | China | |
| Japan | ||
| South Korea | ||
| India | ||
| Rest of Asia-Pacific | ||
| Middle East | Saudi Arabia | |
| United Arab Emirates | ||
| Rest of Middle East | ||
| Africa | South Africa | |
| Nigeria | ||
| Rest of Africa | ||
Key Questions Answered in the Report
What is the size of the managed GPU infrastructure services market?
The managed GPU infrastructure services market size is expected to grow from USD 3.47 billion in 2026 to USD 4.56 billion in 2027 and is forecast to reach USD 14.21 billion by 2032 at 25.52% CAGR over 2027-2032.
What is driving demand for managed GPU infrastructure services?
Production-scale generative AI training, persistent inference, agentic workloads, and the move from owned hardware to contracted capacity are key demand factors.
Which managed GPU service is expanding the fastest?
Managed inference and model-serving operations is projected to expand at a 26.81% CAGR through 2032 as customers operate more AI systems in production.
Which deployment model leads managed GPU services?
Cloud-based deployment held 68.58% share in 2026 and is projected to expand at a 27.33% CAGR through 2032.
Which end-user sector has the highest projected expansion?
Healthcare and life sciences is projected to expand at a 28.27% CAGR through 2032, supported by drug discovery, genomics, and biomedical model development.
Which region has the fastest projected expansion?
Asia-Pacific is projected to expand at a 27.91% CAGR through 2032, supported by sovereign compute programs and regional capacity investment.