
Managed AI Infrastructure Operations Services Market Size and Share
Market Overview
| Study Period | 2021 - 2032 |
|---|---|
| Market Size (2027) | USD 7.68 Billion |
| Market Size (2032) | USD 22.13 Billion |
| Growth Rate (2027 - 2032) | 23.57 % |
| Fastest Growing Market | Asia-Pacific |
| Largest Market | North America |
| Market Concentration | Medium |
Major Players *Disclaimer: Major Players sorted in no particular order Image © Mordor Intelligence. Reuse requires attribution under CC BY 4.0. | |
Managed AI Infrastructure Operations Services Market Analysis by Mordor Intelligence
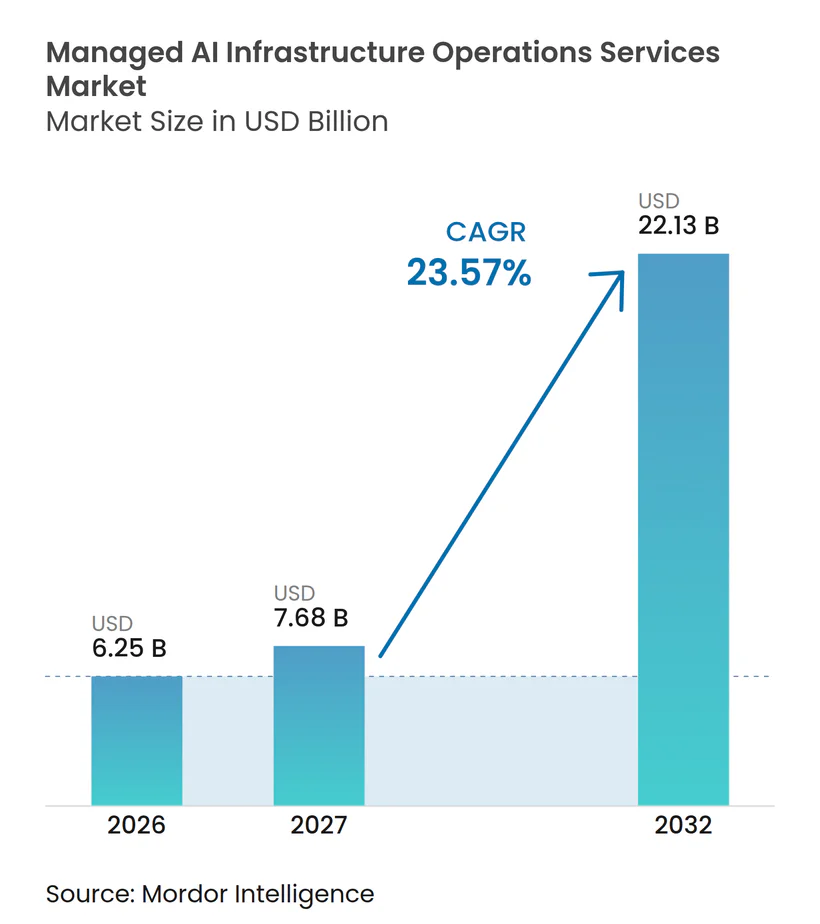
The Managed AI Infrastructure Operations Services Market size is projected to expand from USD 6.25 billion in 2026 to USD 7.68 billion in 2027, and to USD 22.13 billion by 2032, registering a CAGR of 23.57% between 2027 and 2032. The managed AI infrastructure operations services market is moving from one-time model training projects toward continuously operated inference environments. Organizations need dependable cluster availability, low response times, fleet monitoring, and cost control as AI applications enter production. Sovereignty rules are also affecting provider selection because some buyers require local operations staff, data controls, and auditable infrastructure. Providers that combine GPU capacity with operations software and compliance support can secure longer contracts and broaden their role across the customer lifecycle. Supply limits for advanced memory, GPUs, power connections, and cooling equipment remain material constraints for the managed AI infrastructure operations services market.
Key Report Takeaways
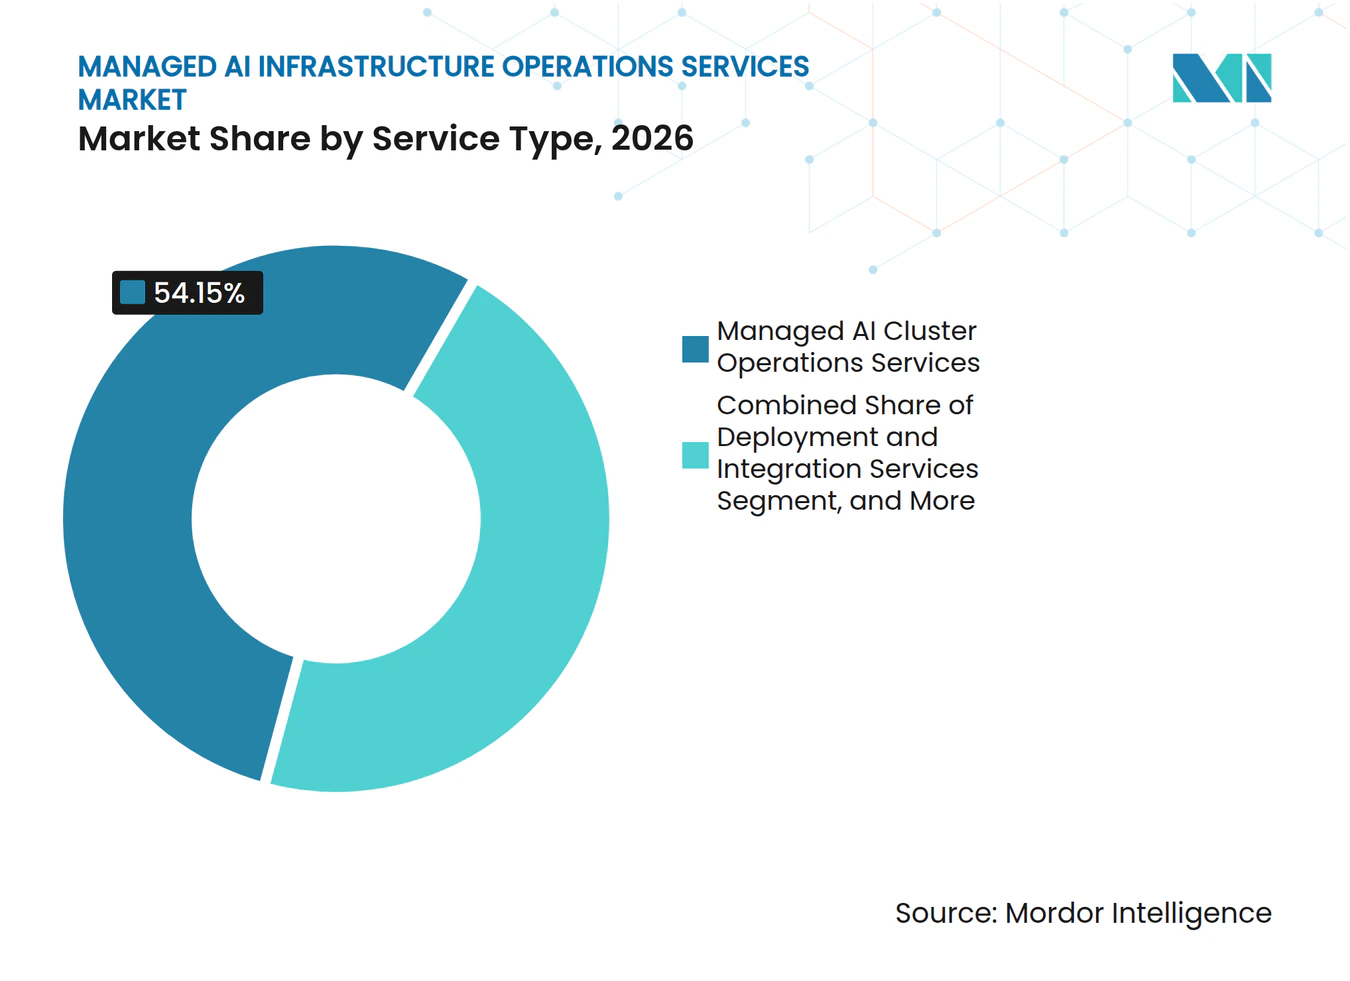
- By service type, Managed AI Cluster Operations Services held 54.15% of the Managed AI Infrastructure Operations Services Market spending, while Managed Monitoring, Observability, and AIOps Services is projected to expand at a 24.76% CAGR through 2032.
- By deployment mode, on-premise deployment accounted for 67.13% of the Managed AI Infrastructure Operations Services Market size in 2026, while cloud-based deployment is projected to expand at a 25.05% CAGR through 2032.
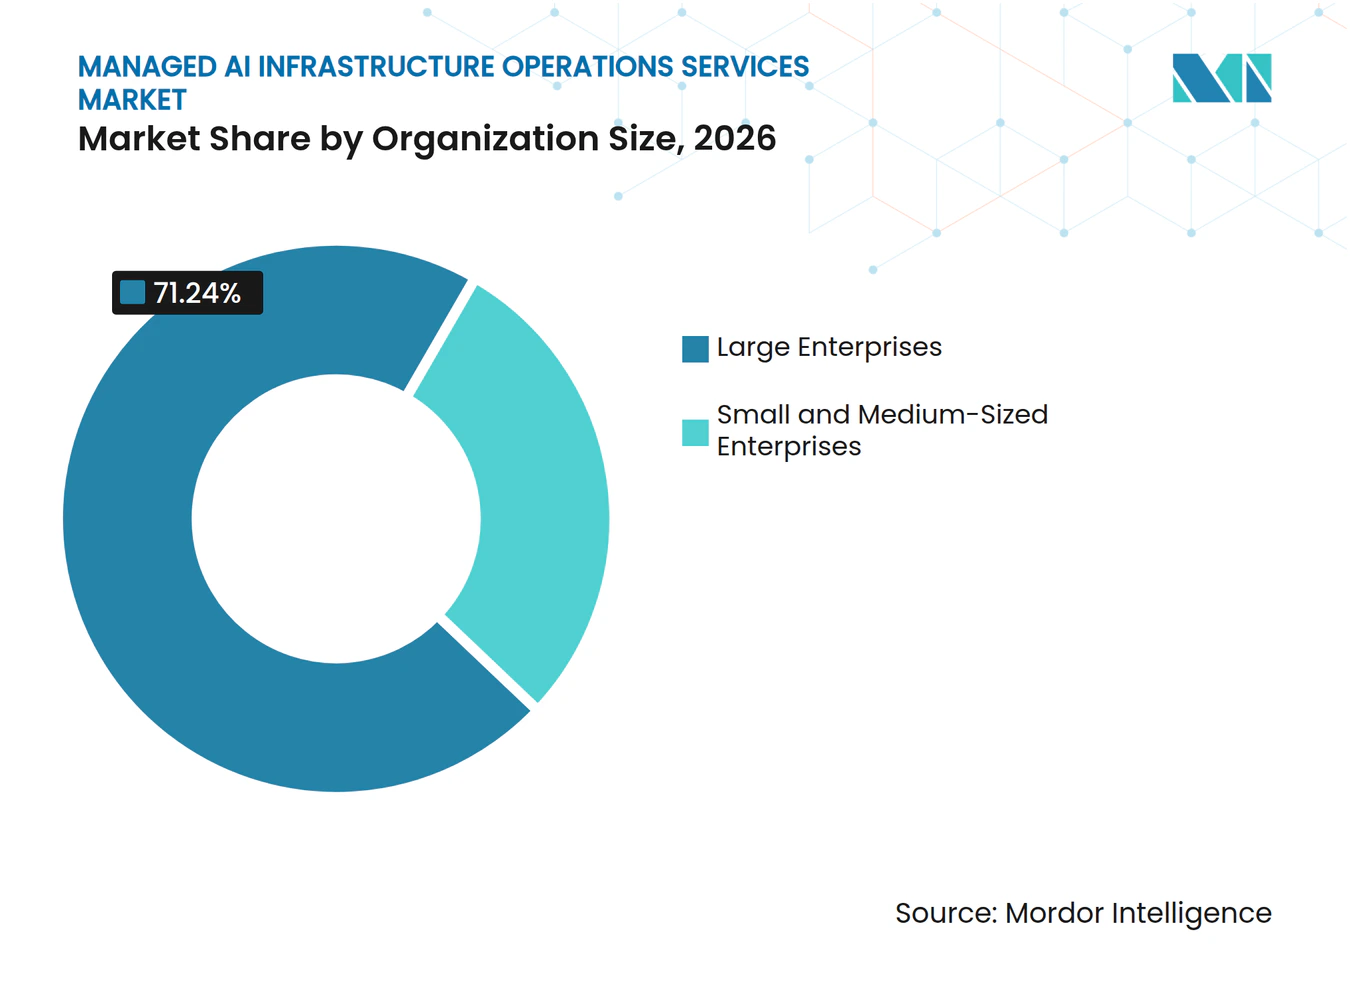
- By organization size, large enterprises accounted for 71.24% of the Managed AI Infrastructure Operations Services Market spending, while small and medium-sized enterprises are projected to expand at a 25.30% CAGR through 2032.
- By end-user industry, IT and telecommunications accounted for 29.16% of the Managed AI Infrastructure Operations Services Market spending, while government and public administration are projected to expand at a 24.08% CAGR through 2032.
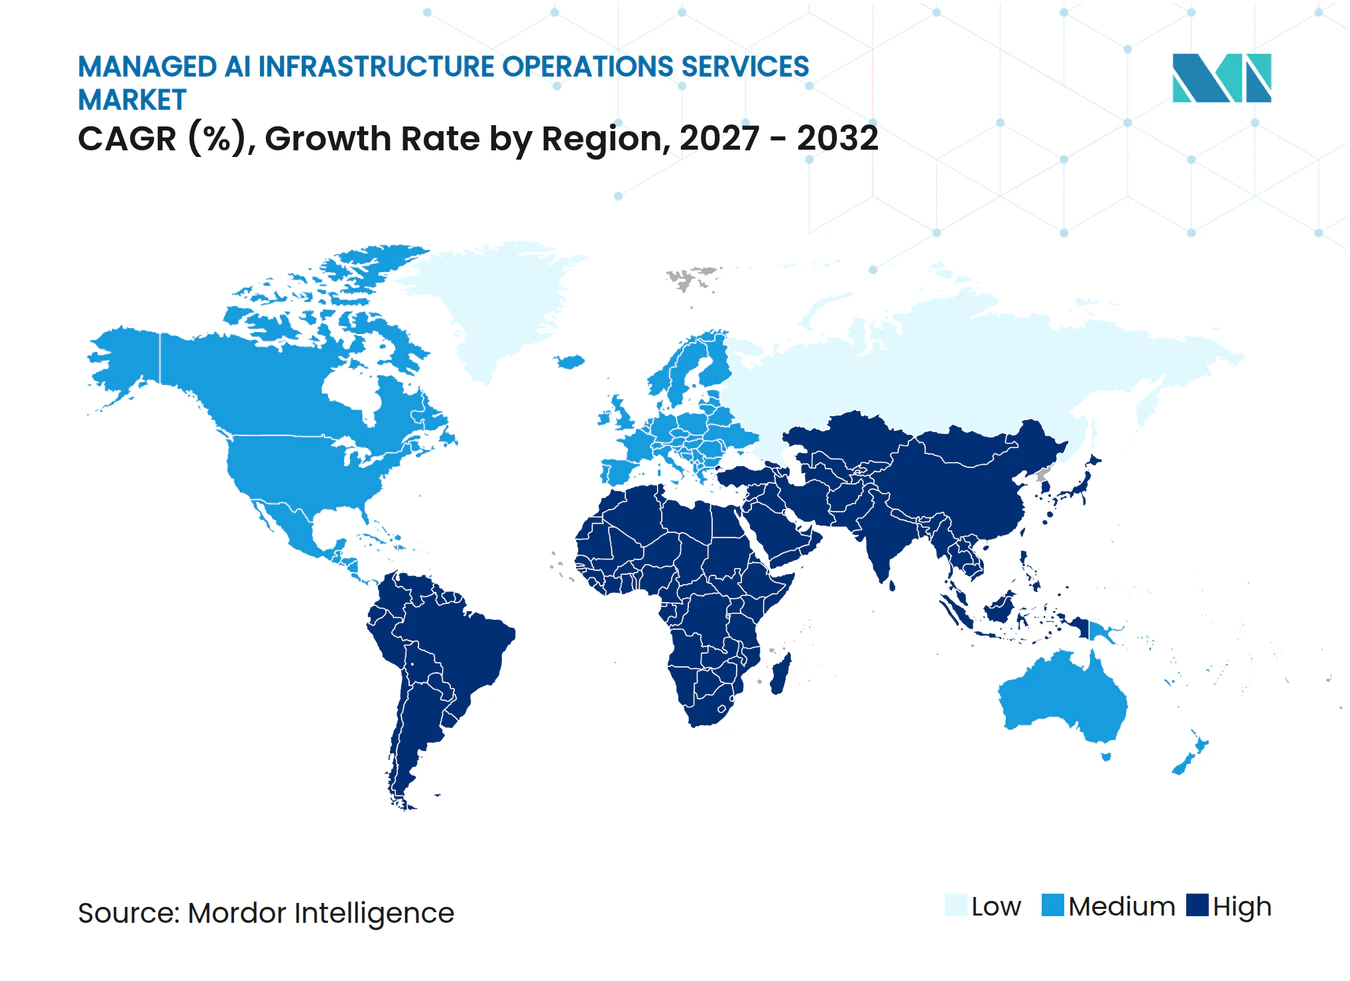
- By geography, North America accounted for 36.20% of the Managed AI Infrastructure Operations Services Market spending, while Asia-Pacific is projected to expand at a 24.35% CAGR through 2032.
Note: Market numbers in this report are based on Mordor Intelligence's proprietary estimation framework, which combines nine months of actuals with Q4 projections for base year 2026.
Global Managed AI Infrastructure Operations Services Market Trends and Insights
Drivers Impact Analysis*
| Driver | (~) % Impact on CAGR Forecast | Geographic Relevance | Impact Timeline |
|---|---|---|---|
| Rising Demand for Elastic GPU Capacity | +6.5% | Global | Short term (≤ 2 years) |
| Growth in Production AI Inference Workloads | +5.8% | Global | Short term (≤ 2 years) |
| Enterprise Shortage of AI Infrastructure Operations Talent | +4.2% | Global | Medium term (2-4 years) |
| Expansion of Sovereign and Residency-Compliant AI Infrastructure | +3.1% | EU, Asia-Pacific, Middle East | Long term (≥ 4 years) |
| Increasing Need for GPU Utilization and Energy Optimization | +2.4% | Global | Medium term (2-4 years) |
| Adoption of Multi-Cloud and Hybrid AI Workload Orchestration | +1.8% | North America and Europe | Medium term (2-4 years) |
| Source: Mordor Intelligence | |||
Rising Demand for Elastic GPU Capacity
Demand for elastic GPU capacity is making infrastructure availability central to the managed AI infrastructure operations services market and is shaping provider capacity plans. Enterprises increasingly need providers that can reserve capacity, accommodate short demand peaks, and maintain agreed cluster availability. Direct equipment procurement does not give many organizations the tools to manage changing reservation schedules or shared capacity. Large providers can use purchasing scale and established supplier relationships to improve access to scarce infrastructure. That capability makes managed operations more practical for organizations that lack hyperscale purchasing power. It also shortens the time from model validation to its use in a customer-facing or revenue-producing system.
Growth in Production AI Inference Workloads
Production inference workloads are increasing demand for managed operations in the managed AI infrastructure operations services market, as they run continuously rather than in limited training cycles. Inference systems create persistent requirements for power management, thermal control, scheduling, and performance monitoring. Research on large language model serving shows that forecast-aware autoscaling can reduce GPU-hours by up to 25% in an Office 365 serving environment with more than 10 million daily requests. Reasoning models can place much higher demands on computing resources than single-response applications. Managed teams can use workload telemetry to adjust capacity and improve utilization before service levels decline. The managed AI infrastructure operations services market therefore benefits when inference becomes a regular production workload rather than an experimental one.
Enterprise Shortage of AI Infrastructure Operations Talent
A shortage of experienced AI infrastructure staff supports demand for external operating teams in the managed AI infrastructure operations services market. The work combines knowledge of accelerated computing, networking, storage, power systems, cooling, and production application behavior. Smaller organizations often cannot build a full internal team across those disciplines. Even large enterprises may struggle to staff operations around the clock for critical inference services. Managed providers can spread scarce expertise across multiple customer environments through standardized operating practices. This staffing gap creates an opportunity for providers to offer cluster operations, monitoring, and compliance support as a combined service.
Expansion of Sovereign and Residency-Compliant AI Infrastructure
Sovereignty requirements are changing procurement criteria for the managed AI infrastructure operations services market and the provider qualification process. Customers are looking beyond data location and examining who operates systems, where model controls are administered, and how access is audited. Canada’s guidance for sovereign AI infrastructure calls for Canadian-operated Security Operations Centers and Model Operations Centers for critical workloads.[1] These requirements can favor providers with in-country personnel and operating controls. They can also create opportunities for regional partners that understand public-sector procurement and local compliance. The effect is strongest in regulated industries and government projects, where operational control is part of the service requirement.
Restraints Impact Analysis*
| Restraint | (~) % Impact on CAGR Forecast | Geographic Relevance | Impact Timeline |
|---|---|---|---|
| GPU and High-Bandwidth Memory Supply Constraints | -3.2% | Global | Short term (≤ 2 years) |
| Power-Grid and High-Density Cooling Bottlenecks | -2.8% | North America and Europe | Medium term (2-4 years) |
| Operational Risk From Incomplete Telemetry and Legacy Controls | -1.6% | Global | Medium term (2-4 years) |
| Vendor Lock-In and Workload Portability Challenges | -1.2% | Global | Long term (≥ 4 years) |
| Source: Mordor Intelligence | |||
GPU and High-Bandwidth Memory Supply Constraints
The availability of GPUs and high-bandwidth memory can limit how quickly providers add managed capacity in the managed AI infrastructure operations services market. Providers without reliable access to current accelerators may delay customer onboarding or use earlier hardware that delivers lower inference output per dollar. This situation matters most for applications with strict response-time requirements. Supply restrictions can also affect contract design because providers need more certainty before committing capacity to long-term service agreements. Geographic limits on the availability of advanced hardware add a further planning challenge for multinational customers. The managed AI infrastructure operations services market remains exposed when demand for production capacity rises faster than components can be supplied.
Power-Grid and High-Density Cooling Bottlenecks
Power availability and cooling capacity are limiting physical expansion across the managed AI infrastructure operations services market. The International Energy Agency expects global data center electricity consumption to reach 945 TWh by 2030, with accelerated servers supporting AI accounting for nearly half of the increase in electricity use. High-density GPU systems can require liquid cooling and specialized commissioning practices. Grid connections can take longer than server procurement, especially in congested locations. Providers must therefore plan power, cooling, and operations staffing together rather than treat them as separate decisions. These constraints can delay the delivery of managed services even when customer demand and capital are available.
*Our forecasts treat driver/restraint impacts as directional, not additive. The impact forecasts reflect baseline growth, mix effects, and variable interactions.
Segment Analysis
By Service Type: Cluster Operations Anchor Revenue, AIOps Drives Expansion
Managed AI Cluster Operations Services accounted for 54.15% of the Managed AI Infrastructure Operations Services Market in 2026. The segment benefits from long-term GPU fleet provisioning contracts, which establish a direct operating relationship with the customer. Providers can then offer monitoring, security, and deployment support around the core cluster service. Customers need continuing help with capacity allocation, maintenance coordination, performance tracking, and availability management. These requirements make cluster operations a stable source of recurring revenue within the managed AI infrastructure operations services industry.
Managed Monitoring, Observability, and AIOps Services are projected to expand at a 24.76% CAGR through 2032. Production inference requires real-time visibility into application behavior, resource usage, scheduling, and service performance. Static monitoring does not always provide operators with sufficient control over variable workloads. Forecast-aware autoscaling has demonstrated GPU-hour savings in large-scale model serving, which supports the case for deeper observability. Security, compliance, deployment, and integration services can use this initial operations relationship to build recurring work.



By Deployment Mode: On-Premise Leads as Cloud Adoption Accelerates
On-premise deployment accounted for 67.13% of 2026 spending. Large enterprises and public organizations often favor local environments when data residency and low response times are important. Early adopters also had existing GPU investments that required outside expertise to operate effectively. This installed base supports continued demand for on-premise cluster management. Many organizations combine owned infrastructure and external cloud capacity for different AI workloads.
Cloud-based deployment is projected to expand at a 25.05% CAGR through 2032. Consumption-based purchasing helps organizations use AI infrastructure without committing to large capital investments before demand is proven. Kyndryl found that 84% of enterprise leaders intentionally operate multiple clouds, while 41% are moving some workloads back to on-premise settings.[2] This pattern supports hybrid operations rather than a complete move away from local systems. Providers need orchestration that manages deployment boundaries without weakening operational control or visibility.
By Organization Size: Large Enterprises Anchor Volume, SMEs Drive Growth Pace
Large enterprises held 71.24% of the Managed AI Infrastructure Operations Services Market share in 2026. Their higher spending reflects larger GPU commitments and earlier movement from pilots to continuously operated AI systems. Their engagements often combine cluster operations, AIOps, security, and compliance services. Broader service use increases revenue per customer and supports longer contracts. Buyers also require providers to align with established governance, procurement, and service-level processes.
Small and medium-sized enterprises are projected to expand at a 25.30% CAGR through 2032. Lower minimum cluster sizes and consumption-based services reduce the capital barrier for organizations without data center capacity. Smaller buyers also face greater difficulty staffing separate AI infrastructure, security, and operations functions. Providers are responding with standardized service tiers, fixed pricing, and self-service dashboards. This group broadens the customer base for the managed AI infrastructure operations services market beyond early enterprise adopters.

By End-User Industry: Telecoms Lead as Government Spending Accelerates
IT and telecommunications accounted for 29.16% of end-user spending in 2026. Telecom operators use production AI for network performance management, customer churn prediction, and real-time traffic routing. These workloads need sustained availability because they affect customer experience and network operations. The sector also has experience with managed infrastructure contracts, which can simplify adoption. Providers must support low response times, resilient networks, and continuous monitoring in these engagements.
Government and public administration is projected to expand at a 24.08% CAGR through 2032. Sovereign AI programs can require managed staff with local clearances and public-sector operating processes. Canada’s guidance illustrates the importance of domestic operational control for critical workloads. Banking, financial services, healthcare, manufacturing, retail, education, and research each have distinct opportunities in fraud detection, regulated workflows, predictive maintenance, recommendation engines, and managed research computing. Compliance-led services can provide practical entry points for more cautious adopters.
Geography Analysis
North America accounted for 36.20% of the Managed AI Infrastructure Operations Services Market share in 2026. The region benefits from a concentration of model developers, hyperscaler headquarters, enterprise customers, and infrastructure providers in the United States. This creates a deep base of customers who need long-term support for cluster and inference operations. Canada creates a separate opportunity because its guidance emphasizes domestically operated security and model operations centers. South America is at an earlier stage, with Brazil leading activity and other countries attracting initial attention from providers as local capacity develops.
Europe has a complex operating environment because data protection rules and AI compliance obligations favor in-jurisdiction controls for regulated workloads. Germany’s 2026 sovereign AI cloud contract showed how public procurement can support a shared domestic AI infrastructure layer. The United Kingdom, France, and Italy are building domestic capacity while balancing performance needs with operational control. Russia faces limits on access to leading-edge hardware under export control frameworks.
Asia-Pacific is projected to expand at a 24.35% CAGR through 2032 in the managed AI infrastructure operations services market. Sovereign programs, hyperscaler expansion, and a growing enterprise user base support this outlook. Investment is moving toward markets where power can support GPU-ready facilities. The International Energy Agency identifies electricity supply as a core issue for the expansion of AI and data center infrastructure.[3] Singapore, Japan, China, the Middle East, and Africa are each developing different models for national capacity, data residency, and early AI deployment.
Competitive Landscape
Market Concentration
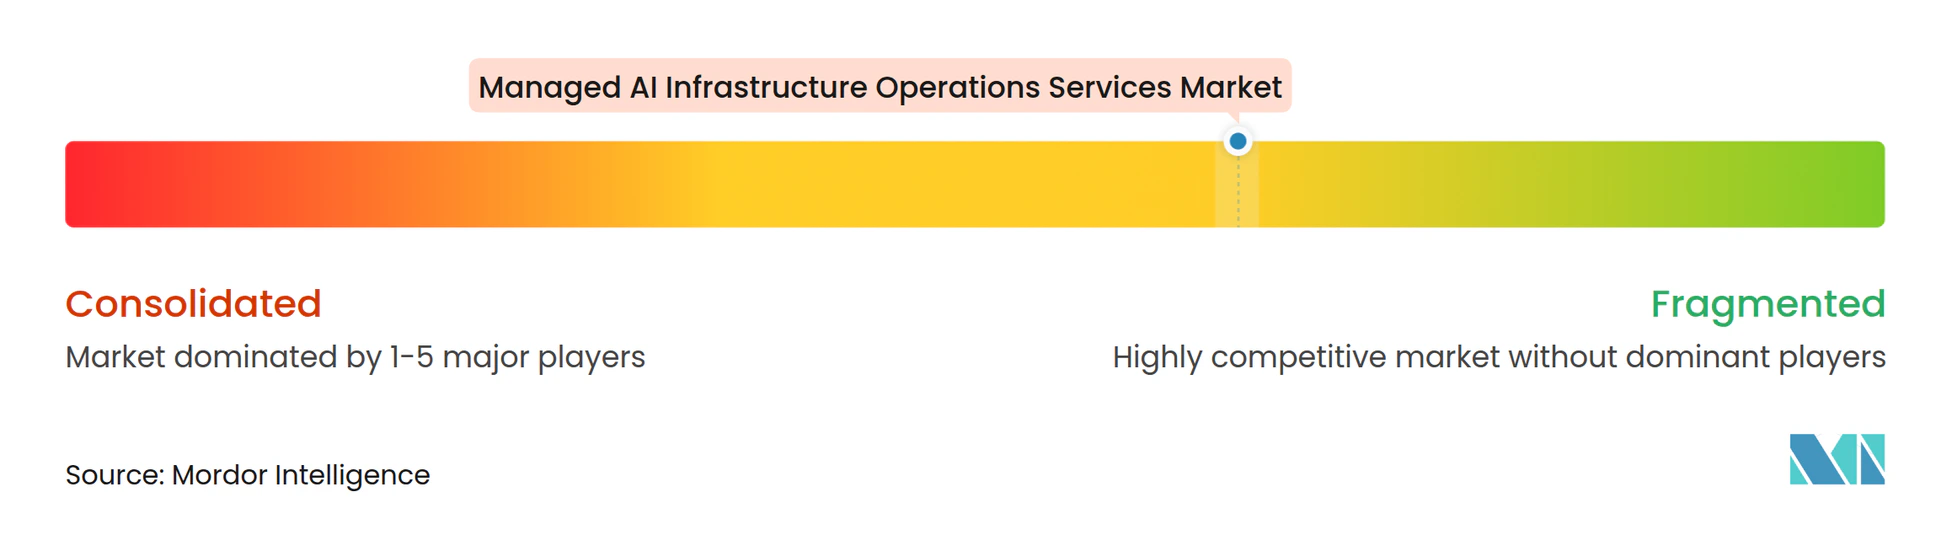
The managed AI infrastructure operations services market is fragmented across service layers, even though a smaller group of providers controls much of the available GPU capacity. Purpose-built neocloud operators combine cluster provisioning with monitoring, security, and AIOps services. This approach can be more compelling than basic AI compute because customers need sustained operational support. Operations software is becoming a point of competition in the managed AI infrastructure operations services market as buyers assess fleet visibility, scheduling, reliability, and GPU efficiency. Security and compliance operations remain an underserved area for healthcare, financial services, and government.
CoreWeave reported contracted power of 4.2 GW as of August 11, 2026, and more than USD 25 billion in net new customer commitments early in the third quarter of 2026. The company’s position shows the value of securing long-term capacity and customer commitments. Nebius reported USD 582.3 million in second-quarter 2026 group revenue and an annualized run-rate of USD 3.0 billion at the end of June 2026. Lambda expanded its data center footprint to support enterprise and hyperscaler commitments.
IREN completed the acquisition of Mirantis in August 2026, adding Kubernetes and AI orchestration software to its infrastructure portfolio. The transaction shows how infrastructure providers are adding software-defined cluster management to deepen customer relationships. Competition can move away from isolated feature claims and toward ecosystem integration, reliability, and depth of managed operations. Smaller companies with specialized AIOps or compliance capabilities may become acquisition targets or technology partners. The managed AI infrastructure operations services market is likely to see further consolidation beyond GPU cluster operations.
Managed AI Infrastructure Operations Services Industry Leaders
-
CoreWeave, Inc.
-
Nscale Global Ltd.
-
Yobitel Communications Co., Ltd.
-
Kyndryl, Inc.
-
Baseten, Inc.
- *Disclaimer: Major Players sorted in no particular order
Recent Industry Developments
- September 2026: Lambda announced a new data center at MidAmerica Industrial Park in Mayes County, Oklahoma. The site expanded its U.S. AI factory footprint and was intended to support large enterprise and hyperscaler customer commitments. The announcement linked the project to Lambda’s multibillion-dollar Microsoft infrastructure agreement and its broader demand for AI computing capacity. The location added another site where the company could develop physical infrastructure for contracted customer requirements.
- September 2026: CoreWeave reported total contracted power of 4.2 GW as of August 11, 2026, compared with 3.7 GW at June 30, 2026. It disclosed more than USD 25 billion in net new customer commitments added early in the third quarter of 2026. New agreements were signed at higher prices and included shorter contracts ranging from 3 to 6 months. The disclosure showed that customers were still contracting capacity while providers expanded their available infrastructure. It also showed the changing mix of contract duration as customers sought both longer commitments and shorter periods of additional capacity.
- September 2026: Crusoe raised a USD 3.9 billion Series F at a post-money valuation of USD 30.9 billion. It reported more than 6 GW of gross contracted capacity, with 1 GW of gross capacity delivered and operational. The funding strengthened Crusoe’s position as a vertically integrated AI infrastructure provider with both contracted future capacity and live deployments. It's reported delivered capacity distinguished operating infrastructure from the larger pipeline that remained under contract.
- August 2026: Lambda closed a USD 926 million term loan B, described as the first investment-grade-rated term loan B executed by a private neocloud. The financing backed GPU servers dedicated to an investment-grade offtaker. The transaction indicated that specialist providers could access structured debt to finance customer-linked infrastructure. It connected the loan proceeds to dedicated servers rather than a general corporate financing purpose.
Global Managed AI Infrastructure Operations Services Market Report Scope
The Managed AI Infrastructure Operations Services Market comprises outsourced services for managing, monitoring, optimizing, securing, and operating artificial intelligence (AI) infrastructure environments, including GPU clusters, AI training and inference infrastructure, orchestration platforms, observability systems, and supporting compute resources. These services include AI cluster administration, monitoring, and AIOps; security and compliance management; deployment, integration, and ongoing operational support for AI workloads across cloud, on-premises, and hybrid environments.
The Managed AI Infrastructure Operations Services Market Report is Segmented by Service Type (Managed AI Cluster Operations Services, Managed Monitoring, Observability, and AIOps Services, Managed Security and Compliance Services, Deployment and Integration Services, and Other Service Types), Deployment Mode (On-Premise, Cloud-Based, and Hybrid), Organization Size (Large Enterprises, and Small and Medium-Sized Enterprises), End-User Industry (Banking, Financial Services, and Insurance [BFSI], Government and Public Administration, Healthcare and Life Sciences, IT and Telecommunication, Industrial Manufacturing, Retail and E-commerce, Education and Research Institutions, and Other End-User Industries), and Geography (North America, South America, Europe, Asia-Pacific, Middle East, and Africa). The Market Forecasts are Provided in Terms of Value (USD).
| Managed AI Cluster Operations Services |
| Managed Monitoring, Observability, and AIOps Services |
| Managed Security and Compliance Services |
| Deployment and Integration Services |
| Other Service Types |
| On-Premise |
| Cloud-Based |
| Hybrid |
| Large Enterprises |
| Small and Medium-Sized Enterprises |
| Banking, Financial Services, and Insurance (BFSI) |
| Government and Public Administration |
| Healthcare and Life Sciences |
| IT and Telecommunication |
| Industrial Manufacturing |
| Retail and E-commerce |
| Education and Research Institutions |
| Other End-User Industries |
| North America | United States |
| Canada | |
| Mexico | |
| South America | Brazil |
| Argentina | |
| Rest of South America | |
| Europe | Germany |
| United Kingdom | |
| France | |
| Italy | |
| Russia | |
| Rest of Europe | |
| Asia-Pacific | China |
| Japan | |
| India | |
| South Korea | |
| Rest of Asia-Pacific | |
| Middle East | Saudi Arabia |
| United Arab Emirates | |
| Rest of Middle East | |
| Africa | South Africa |
| Nigeria | |
| Rest of Africa |
| By Service Type | Managed AI Cluster Operations Services | |
| Managed Monitoring, Observability, and AIOps Services | ||
| Managed Security and Compliance Services | ||
| Deployment and Integration Services | ||
| Other Service Types | ||
| By Deployment Mode | On-Premise | |
| Cloud-Based | ||
| Hybrid | ||
| By Organization Size | Large Enterprises | |
| Small and Medium-Sized Enterprises | ||
| By End-User Industry | Banking, Financial Services, and Insurance (BFSI) | |
| Government and Public Administration | ||
| Healthcare and Life Sciences | ||
| IT and Telecommunication | ||
| Industrial Manufacturing | ||
| Retail and E-commerce | ||
| Education and Research Institutions | ||
| Other End-User Industries | ||
| By Geography | North America | United States |
| Canada | ||
| Mexico | ||
| South America | Brazil | |
| Argentina | ||
| Rest of South America | ||
| Europe | Germany | |
| United Kingdom | ||
| France | ||
| Italy | ||
| Russia | ||
| Rest of Europe | ||
| Asia-Pacific | China | |
| Japan | ||
| India | ||
| South Korea | ||
| Rest of Asia-Pacific | ||
| Middle East | Saudi Arabia | |
| United Arab Emirates | ||
| Rest of Middle East | ||
| Africa | South Africa | |
| Nigeria | ||
| Rest of Africa | ||
Key Questions Answered in the Report
What is the projected value of the Managed AI Infrastructure Operations Services Market?
The market is projected to expand from USD 6.25 billion in 2026 and USD 7.68 billion in 2027 to USD 22.13 billion by 2032, at a 23.57% CAGR.
What services are included in managed AI infrastructure operations?
Services include AI cluster operations, monitoring and AIOps, security and compliance, deployment and integration, managed networking, and lifecycle support. Providers combine these functions to run infrastructure, oversee workloads, and manage operational issues throughout the service period.
Which deployment model is expanding fastest for managed AI operations?
Cloud-based deployment is projected to expand at a 25.05% CAGR through 2032, while on-premise deployment held the largest 2026 share at 67.13%. Hybrid models are also relevant because they allow customers to place different data, training, and inference workloads in the locations that best meet their requirements.
Why do enterprises use managed AI operations providers?
Providers help enterprises operate continuous inference workloads, manage scarce GPU capacity, improve monitoring, and meet security or residency requirements. They can also supply the specialized operating staff that many customers cannot recruit or retain internally.
Which end-user segment leads spending on managed AI operations?
IT and telecommunication led spending with a 29.16% share in 2026 because network and customer applications need continuous availability and low response times. Network operations and customer platforms often require managed support outside normal business hours.
Which region is projected to expand fastest?
Asia-Pacific is projected to expand at a 24.35% CAGR through 2032, supported by sovereign infrastructure programs, hyperscaler expansion, and enterprise adoption.